On the IMF’s latest forecasts, India will grow 7.0% this year and China 4.5%. Yet China’s economy is still nearly five times larger. Both facts are true, and the interesting question is how they fit together.
This post compares the two economies on ten numbers, mostly from the World Bank’s 2025 data. Each shows something different: how big the gap is, which way it is moving, and what might change it.
1. $19.5 trillion versus $3.96 trillion: the size gap
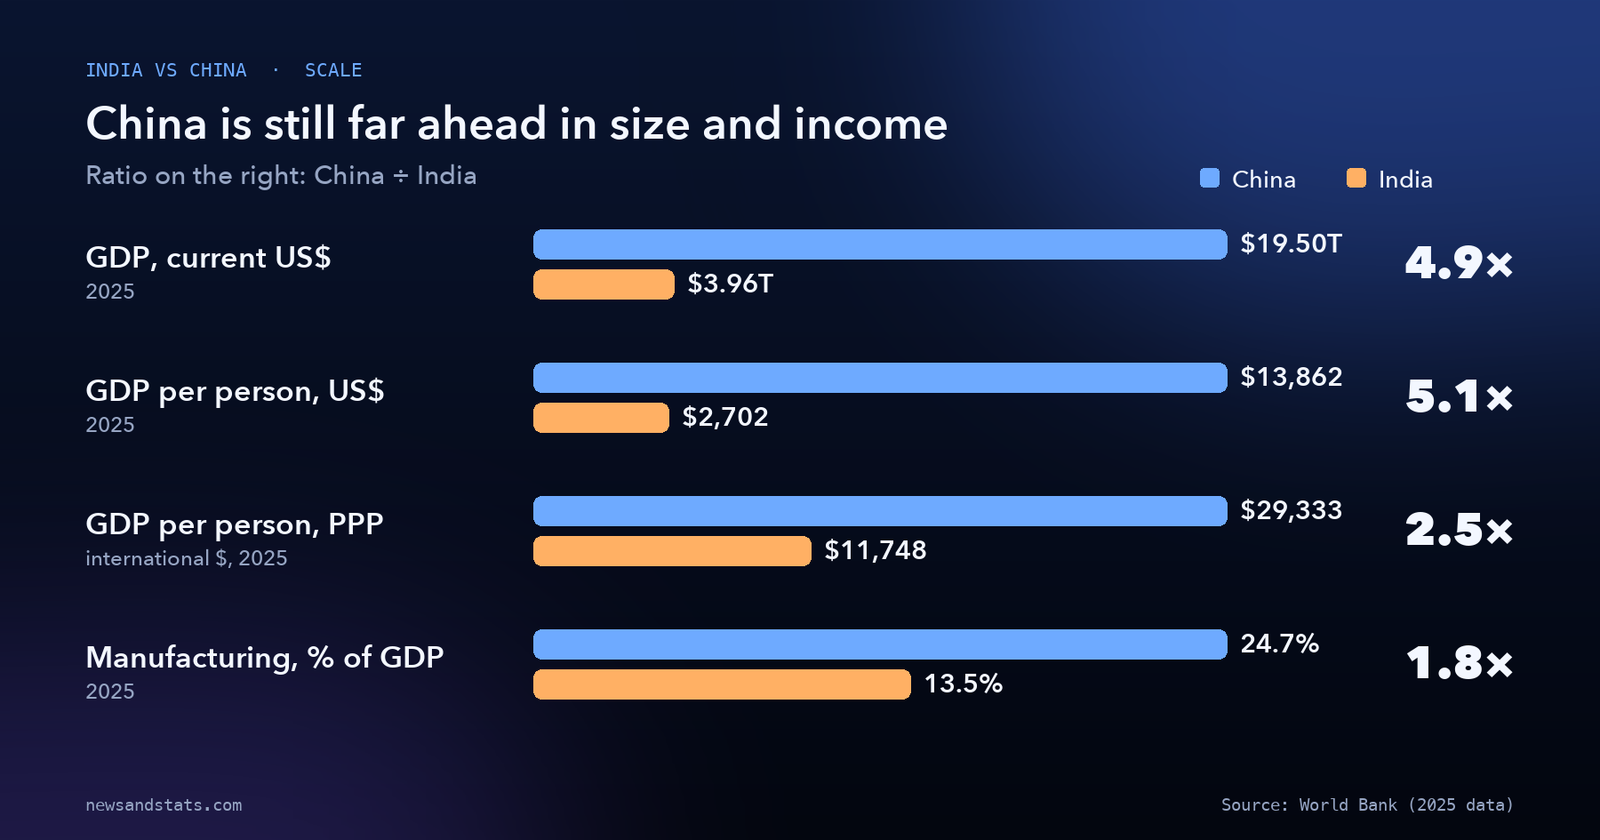
At market exchange rates, China’s economy was about $19.5 trillion in 2025 and India’s about $3.96 trillion, according to the World Bank. China is about 4.9 times larger. That ratio was about 5.6 times in 2020, when China was $15.0 trillion and India $2.67 trillion. So India is closing the gap, but slowly: it has taken five years to move from 5.6 to 4.9.
2. $13,862 versus $2,702: the income gap
Divide by population and the picture is similar. China’s GDP per person in 2025 was about $13,862, India’s about $2,702, a ratio of roughly 5.1 times. In 2020 the figures were $10,627 and $1,907, a ratio of 5.6 times. Income per person is a better guide to living standards than total GDP, and here India has a long way to go.
3. 2.4 times: what changes at purchasing-power prices
Market exchange rates do not capture the fact that a rupee or a yuan buys more at home than the dollar equivalent. Adjusting for local prices (purchasing power parity, or PPP), China’s economy was about $41.3 trillion in 2025 and India’s about $17.2 trillion, a ratio of about 2.4. Per person, China was about $29,333 and India about $11,748, a ratio of about 2.5.
PPP is the better measure for comparing what people can buy day to day. Market rates matter for debts, trade and how much the economy counts in global markets. Neither is wrong, but the gap looks about half as wide in PPP terms.
4. 7.0% versus 4.5%: the growth gap
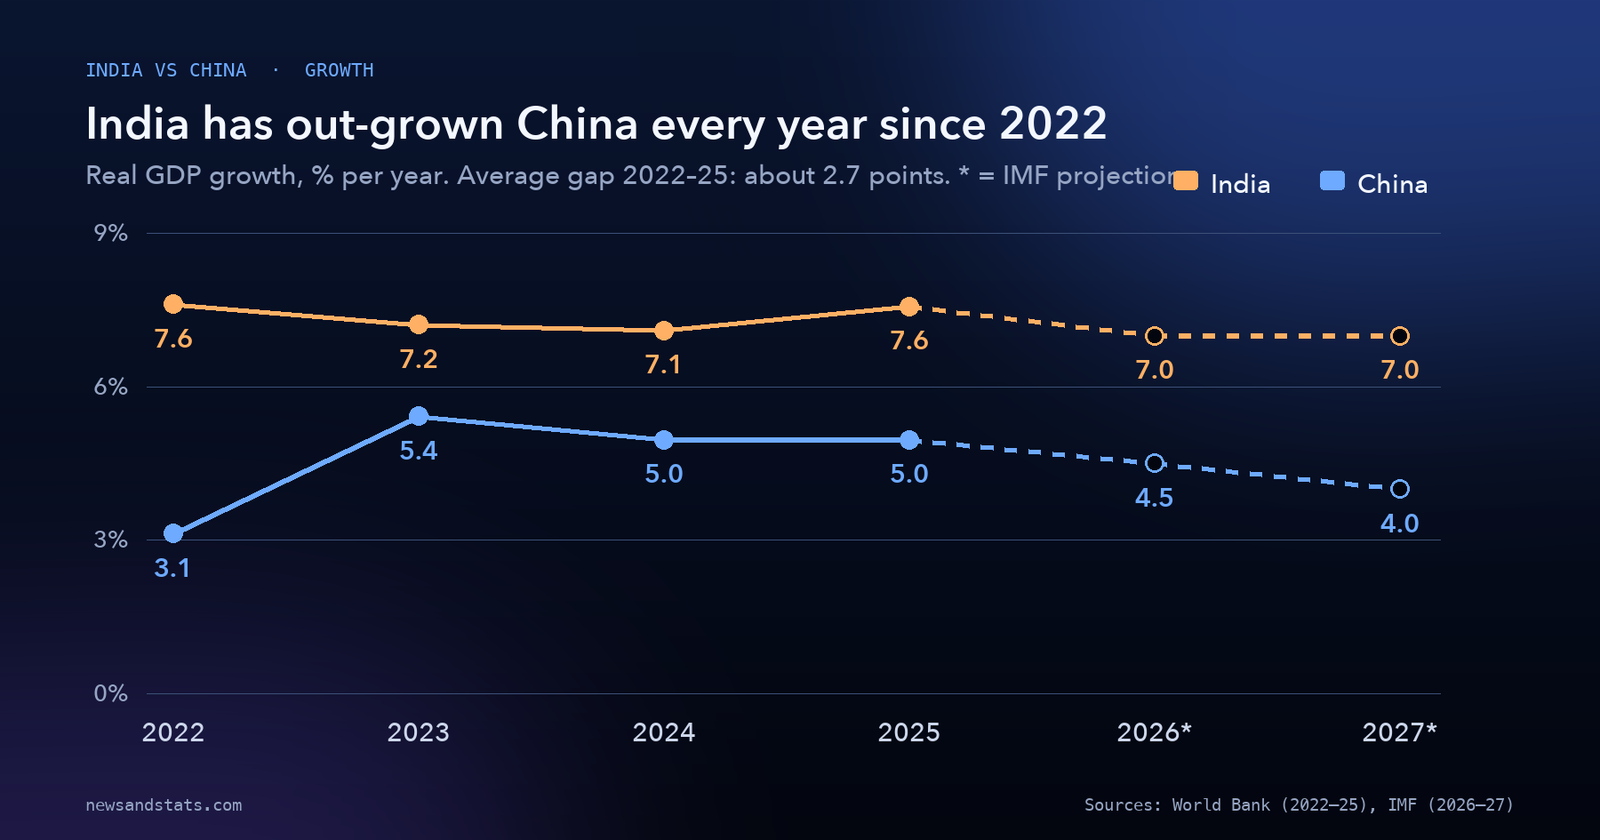
India has grown faster than China in every year since 2022. World Bank data show India growing 7.6%, 7.2%, 7.1% and 7.6% from 2022 to 2025, against China’s 3.1%, 5.4%, 5.0% and 5.0%. The average gap over those four years is about 2.7 percentage points a year.
The IMF’s October forecasts show the pattern continuing: India at 7.0% in both 2026 and 2027, China at 4.5% and 4.0%. Recent data fits. China’s economy grew 4.5% in the third quarter, after 4.3% in the second quarter, which was its slowest pace in more than three years. Growth in the first nine months was 4.6%. India reported 7.8% growth for April to June 2026, according to government data reported by Xinhua.
A growth gap of this size compounds. A simple rule of thumb is that an economy growing 7% a year doubles in about ten years, while one growing 4% takes about seventeen and a half. If both kept to those rates, India’s real output would double by the mid-2030s while China’s would take until the early 2040s. Applied to the PPP numbers above, the gap between them would narrow from about 2.4 times to about 1.8 times over a decade. That is illustrative arithmetic, not a forecast: it ignores exchange rates, inflation and the fact that growth rates change.
5. 1.464 billion versus 1.407 billion: who has more people
By World Bank figures, India’s population passed China’s in 2023 and was about 1.464 billion in 2025, against China’s 1.407 billion. India’s population is growing about 0.9% a year. China’s is shrinking about 0.17% a year, and has been falling since 2022. More people can mean more workers and more consumers, but only if they are employed.
6. 14.9% versus 7.4%: aging
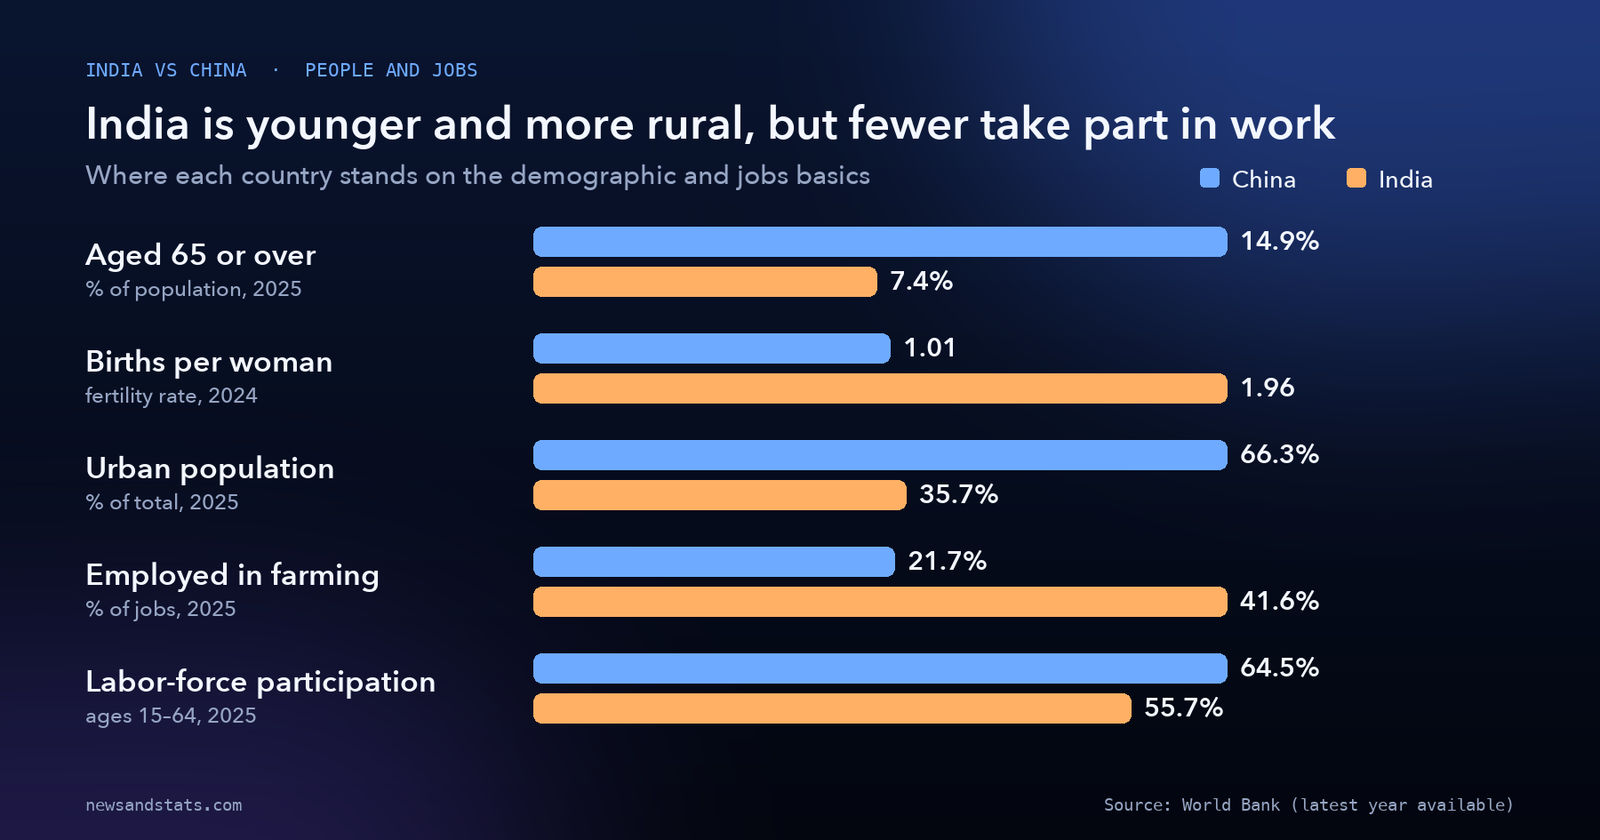
The share of the population aged 65 or over was about 14.9% in China in 2025 and 7.4% in India. China’s fertility rate was about 1.01 births per woman in 2024, among the lowest in the world, against about 1.96 in India. Secondary sources put the median age at about 41 in China and about 30 in India.
China’s working-age population (15 to 64) is still a large share of the total, about 69.7%, close to India’s 68.4%. But China’s has been shrinking since it peaked around 2014, while India’s is still growing. Over the next few decades, China will have fewer people supporting more retirees.
7. 24.7% versus 13.5%: the manufacturing gap
Manufacturing made up about 24.7% of China’s GDP in 2025 and about 13.5% of India’s, according to the World Bank. India’s share has been flat or slightly lower for years: 14.1% in 2020. Indian government sources use a different measure, gross value added, and put the sector at around 17.5%, but also describe it as broadly stagnant at 16% to 18% for two decades.
The global comparison is starker. NITI Aayog, the Indian government’s policy think-tank, reports that India accounted for about 3.2% of world manufacturing value added in 2023 against about 32% for China, up from about 5% in 1995. India’s Chief Economic Adviser puts India’s share at about 3% in 2025, up from 2.4% in 2014. In other words, India’s share of global manufacturing is about a tenth of China’s. A Federal Reserve note observed that China, Japan, Korea and Taiwan each had manufacturing shares of 25% to 35% of GDP at the late stage of their fast-growth periods; India’s was under 15% in 2024.
8. 40.5% versus 34.6%: investment, and 43.3% versus 32.6%: saving
China invests more of its output than almost any large economy. Gross capital formation was about 40.5% of GDP in 2024 in China and about 34.6% in India in 2025. India’s has risen sharply, from 28.9% in 2020, a gain of about 5.7 percentage points. Savings show the same pattern: about 43.3% of GDP in China (2024) against about 32.6% in India (2025).
Investment drives growth, but returns matter as much as volume. China’s high rate has produced heavy industry and infrastructure and also overbuilding, particularly in property. India’s lower rate means it has less capital to deploy each year, but also more room to invest productively.
9. $1.2 trillion versus $860 billion: trade
China’s goods trade surplus reached a record of about $1.19 trillion in 2025, and was running at about $938 billion in the first nine months of 2026, according to reports based on customs data. In June, monthly exports hit a record $412 billion, up about 27% on a year earlier. Part of the surge is being driven by soaring chip prices and demand for AI data-center hardware, a theme covered in our post on the memory chip shortage.
India’s total exports of goods and services were about $860 billion in the fiscal year to March 2026, up about 4.2%, with services doing much of the lifting. India’s share of world merchandise exports was about 1.8% in 2024, up from about 1% in 2005, according to WTO data cited in India’s Economic Survey. To put the scale in perspective, India’s entire year of exports, goods and services combined, is roughly equal to two months of China’s goods exports at the June record. That comparison mixes services and goods, so treat it as an order of magnitude, not an exact ratio.
10. 41.6% versus 21.7%: the jobs picture
About 41.6% of Indian workers were employed in agriculture in 2025, against about 21.7% in China. Only about 35.7% of India’s population lives in cities, compared with about 66.3% in China.
These two numbers are the heart of the long-term India story. When workers move from low-productivity farm work to factories and services, output per worker jumps. China has largely made that move; India has much of it ahead. But there is a catch in the labor-force data. About 55.7% of Indian people aged 15 to 64 are in the labor force, against about 64.5% in China. In other words, India’s demographic advantage is only as valuable as the jobs available to its growing workforce. A young population that cannot find work is a burden rather than a dividend.
Why the gap will take a long time to close
Put the ten numbers together and the picture is a classic catch-up story with real obstacles. India is growing about three points faster, but from a base that is one-fifth the size in dollar terms. Even in the optimistic arithmetic above, India would need decades, not years, to reach China’s current level of income per person.
Three ways these numbers get misread
Faster growth does not mean more added output. India’s 7.0% growth is applied to a smaller base. Applying the IMF’s 2026 growth rates to the 2025 World Bank GDP figures gives a rough picture: 7.0% of India’s $3.96 trillion is about $277 billion of added output, while 4.5% of China’s $19.5 trillion is about $877 billion. Even while growing more slowly, China is adding roughly three times as much output each year in dollar terms. This is a back-of-envelope calculation that mixes real growth rates with current-dollar GDP, so it shows orders of magnitude rather than a precise forecast. The point is that a growth rate and a growth contribution are different things.
Market rates and PPP answer different questions. Headlines that call India “the fifth-largest economy” or “the third-largest” are often using different measures. At market exchange rates India is far behind; at PPP it is much closer. The right measure depends on the question. For comparing living standards, PPP is better. For measuring purchasing power abroad, paying off dollar debts or influencing global markets, market rates are better.
A young population is a potential, not a result. India’s median age and growing workforce are real advantages, but the labor-force participation figure above shows how much depends on whether jobs appear. More than four in ten Indian workers are still on farms. If manufacturing and services do not create enough jobs for those leaving agriculture and the new entrants, the demographic dividend does not show up in GDP. China’s experience is the reference case: it grew fastest when its working-age population was rising and manufacturing absorbed it. India has the first condition; the second is still being built.
China’s headwinds
China’s slowdown is visible in the domestic data. Retail sales grew only 1.1% in the first nine months of 2026, and fixed-asset investment fell 7.2% over the same period, according to the National Bureau of Statistics. Industrial output grew 5.3%, so exports and factories are carrying the economy while consumers and investors hold back. The statistics bureau itself said domestic demand is still insufficient. Add a shrinking workforce and an aging population, and the IMF’s forecast of growth easing from 4.5% to 4.0% next year looks reasonable.
India’s constraints
India’s growth rests more on domestic demand and services than on manufacturing exports. Its barriers are the ones in the numbers above: a manufacturing sector that has not expanded as a share of the economy, lower labor-force participation, and a heavy reliance on imported energy. India’s net energy imports were about 36% of energy use in 2024, against about 24% for China. As we saw in the energy shock post, India’s extra fuel import bill in the first six months of the war was equal to about 0.57% of its GDP, roughly three times China’s 0.18% share.
What to watch
- India’s manufacturing share. If it rises meaningfully above 14% to 15% of GDP, the catch-up story strengthens. If it stays flat while services expand, the gap with China narrows more slowly.
- Chinese consumption. Retail sales growing 1.1% is weak. A recovery in household spending would reduce China’s reliance on exports.
- Jobs in India. Whether labor-force participation rises along with growth.
- Energy prices. Both are net importers; India is more exposed.
- The next IMF and World Bank updates. Both could revise the 7.0% and 4.5% forecasts.
The bottom line
India is the faster-growing economy and will keep gaining ground, but the gap is large. China is about five times bigger in dollars, about 2.4 times in PPP terms, and about five times richer per person. India’s advantages are youth, momentum and a long runway of farm-to-factory transition. Its challenges are creating jobs, building a larger manufacturing base and managing its energy exposure. China’s challenge is the reverse: sustaining growth with an aging population, weak consumer demand and a property sector that is still a drag.
Sources
- World Bank, World Development Indicators (GDP, GDP per capita, PPP, population, manufacturing, investment, savings, age, labor, urbanization), accessed October 2026
- IMF, World Economic Outlook, October 2026, as summarized by Trading Economics
- China National Bureau of Statistics, third-quarter 2026 release, as reported by Il Sole 24 Ore, People’s Daily and others
- Ministry of Statistics and Programme Implementation (India), Q1 FY2026-27 GDP, as reported by Xinhua
- NITI Aayog on manufacturing shares, reported by ThePrint; US Federal Reserve note “India and the Global Economy” (April 2026)
- India Economic Survey and WTO data on merchandise exports, as reported by IANS; China customs data as reported by Trading Economics and Il Sole 24 Ore