
Amazon, Microsoft and Alphabet all reported third-quarter 2026 results within three days of each other in late October, giving the clearest side-by-side look yet at cloud market share 2026: who is biggest, who is growing fastest, and who is making the most money doing it. The headline numbers point in different directions. AWS remains the largest cloud business by a wide margin. Google Cloud grew the fastest of the three, more than doubling its revenue from a year earlier. And when the growth rates are turned into dollars, Google Cloud actually added more new revenue in the quarter than either of its larger rivals. This post works through the numbers company by company, and what they do and do not show about who is winning.
Source: Amazon.com Announces Third Quarter 2026 Results; Microsoft Fiscal Year 2027 First Quarter Earnings Release; Alphabet Announces Third Quarter 2026 Results.
1. AWS: $46.0 billion, and growth that is accelerating again
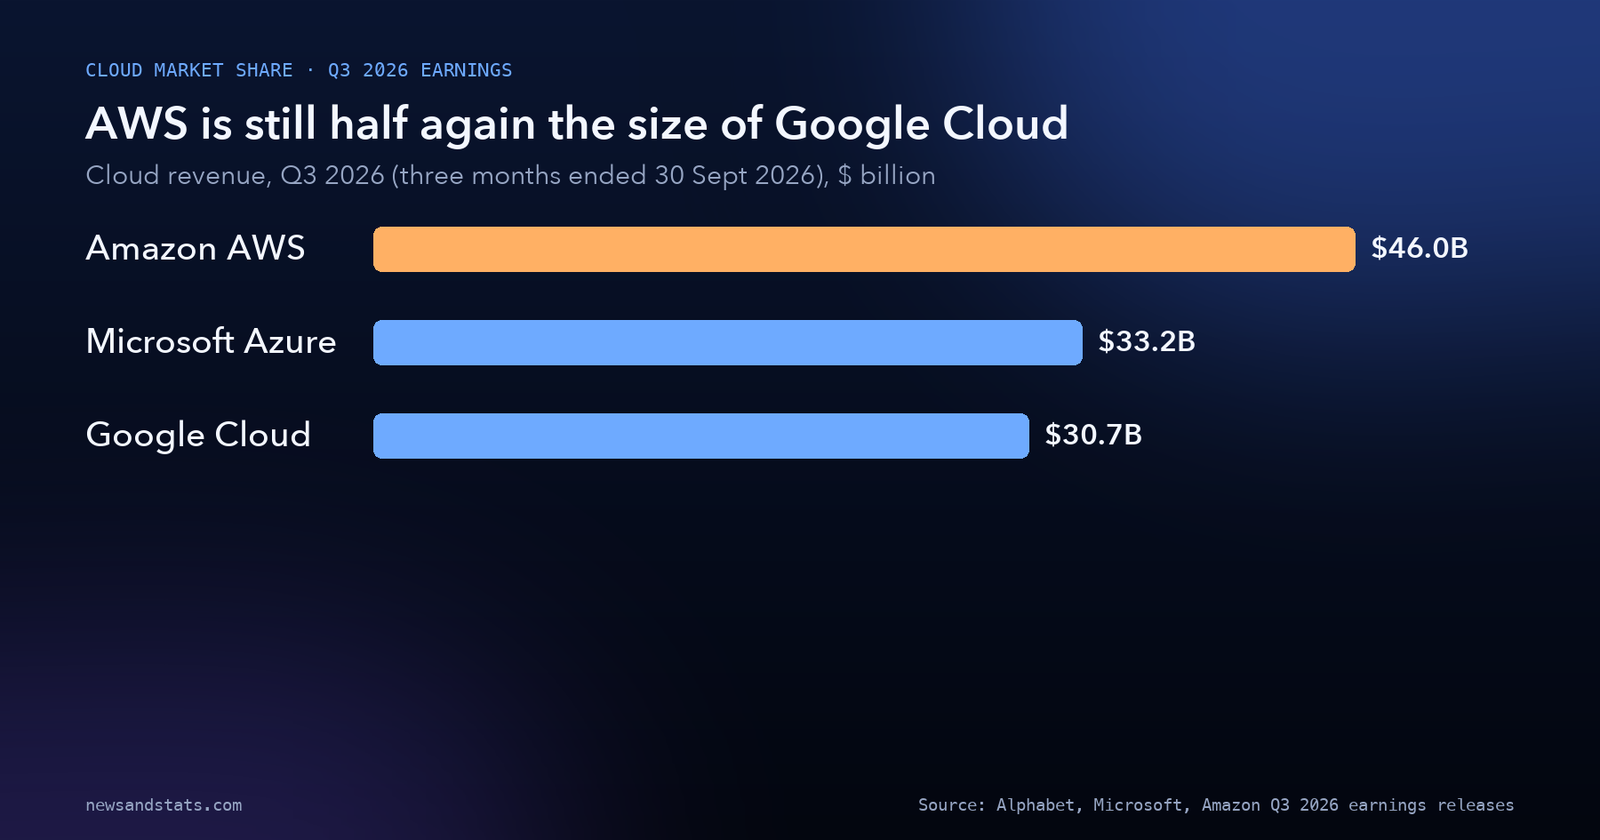
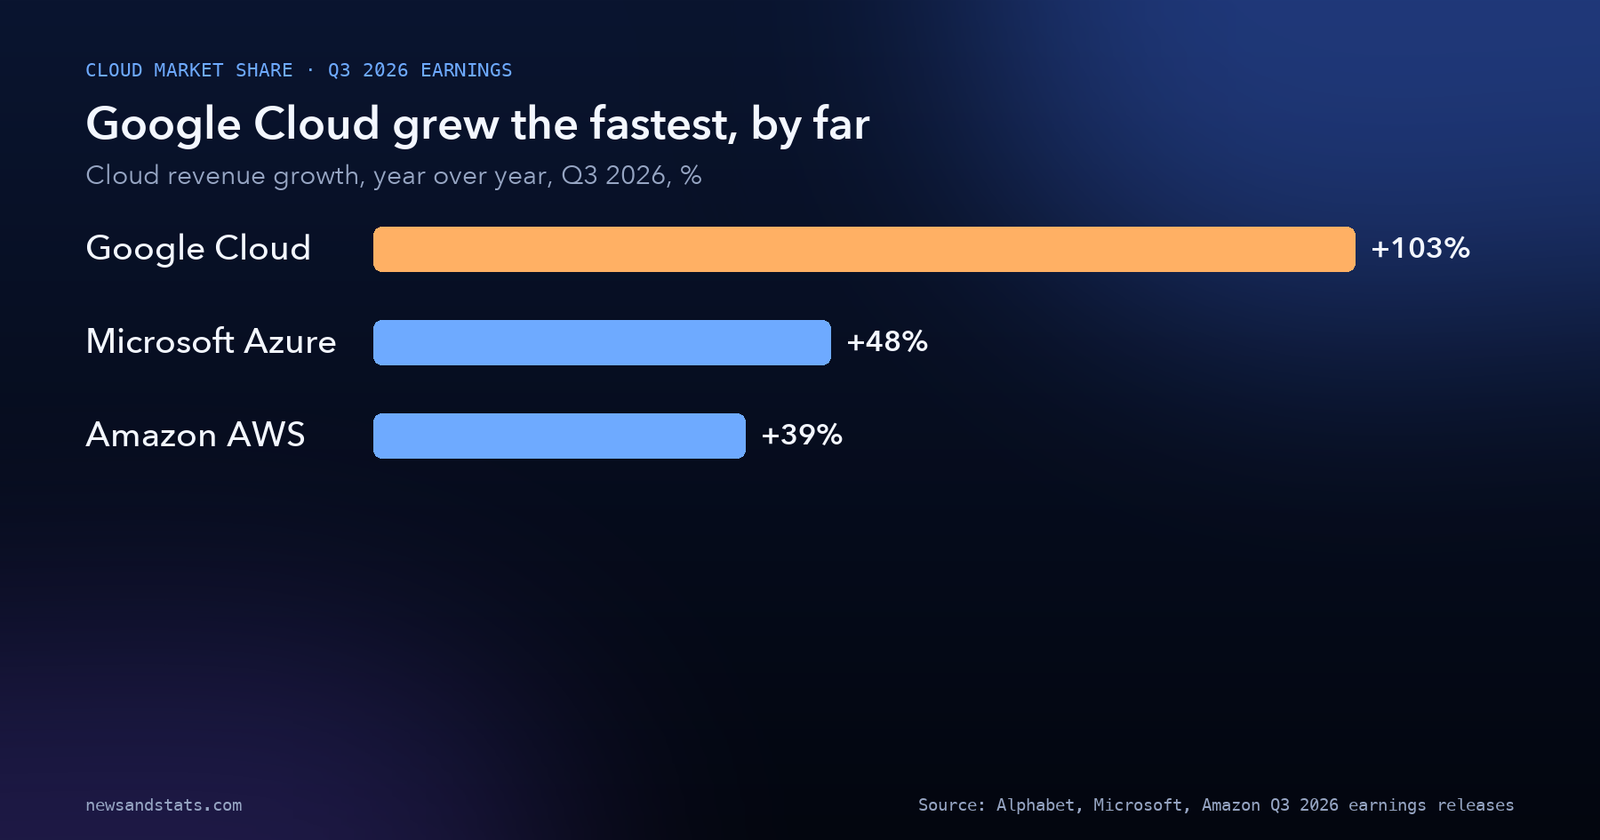
Amazon’s cloud unit reported third-quarter 2026 results on 29 October 2026, for the three months ended 30 September 2026. AWS segment sales rose 39% year over year to $46.0 billion, up from $33.0 billion in the third quarter of 2025. AWS segment operating income was $17.8 billion, compared with $11.4 billion a year earlier, so operating income grew faster than revenue did.
AWS remains Amazon’s profit engine. The whole company’s operating income for the quarter was $28.1 billion, which means AWS alone generated considerably more operating profit than Amazon’s much larger North America and International retail segments combined contributed, even though AWS is a smaller share of total revenue. Amazon’s total net sales for the quarter were $201.9 billion, up 12% from $180.2 billion a year earlier, and net income was $20.7 billion.
2. Microsoft Azure: $33.2 billion, up 48%, and a $677 billion order backlog
Microsoft’s results, covering the same three months but labeled “the first quarter of fiscal year 2027” in its own release, showed Azure revenue of $33,165 million, up from $22,384 million a year earlier, a 48% increase. Microsoft’s total revenue for the quarter was $92.3 billion, up 19%, and total operating income was $45.9 billion, up 21% (22% in constant currency). Net income was $36.6 billion, up 32% from $27.7 billion ($27,747 million).
One figure stands out beyond the quarter itself: Microsoft’s commercial remaining performance obligation, the dollar value of contracted cloud and software work not yet delivered, increased 73% to $677 billion. That is a leading indicator of demand still to be recognized as revenue in future quarters, and its growth rate outpaced Azure’s own revenue growth.
A reporting change complicates year-over-year comparisons: beginning this quarter, Microsoft manages and reports its business under two segments, “Agents and Infra” and “Devices and Consumer,” replacing its previous segment structure, a change the release says was made “to conform to the way we internally manage and monitor our business.” Agents and Infra, the segment that includes Azure, reported $76.8 billion of revenue, up 25%, with operating income of $40.6 billion.
3. Google Cloud: $30.7 billion, up 103% from the smallest base
Alphabet’s release, covering the same July-to-September quarter, states that Google Cloud “delivered record growth as revenues increased 103% to $30.7 billion,” up from $15,157 million a year earlier. Google Cloud’s operating income rose to $11,121 million from $3,594 million. Dividing those two figures gives an operating margin of about 36.2% this quarter against about 23.7% a year earlier (my calculation; Alphabet’s release does not state the margin directly).
Alphabet as a whole reported consolidated revenue of $127.6 billion, up 25%, and consolidated operating income of $40.6 billion, up 30%, with an operating margin of 31.8%. Google Cloud is now a meaningfully larger contributor to that profit than it was a year ago, even though Google Services (Search, YouTube ads and the rest) still supplies the majority of both revenue and operating income, with Google Services operating income of $39.2 billion for the quarter.
4. The dollar math behind the growth rates
Growth percentages can be misleading when the three bases are so different in size. Adding the three companies’ own disclosed figures gives a clearer picture of who actually gained the most ground in the quarter (my calculation from the figures above):
| Cloud provider | Q3 2026 revenue | Q3 2025 revenue | Revenue added, year over year | Growth rate |
|---|---|---|---|---|
| Google Cloud | $30.7B | $15.2B ($15,157M) | +$15.6B | +103% |
| Amazon AWS | $46.0B | $33.0B | +$13.0B | +39% |
| Microsoft Azure | $33.2B | $22.4B ($22,384M) | +$10.8B | +48% |
Source: Amazon, Microsoft and Alphabet Q3 2026 earnings releases (linked above).
Google Cloud’s 103% growth rate gets the headlines, but the more striking fact is that it added more new dollars of revenue in the quarter, $15.6 billion, than AWS ($13.0 billion) or Azure ($10.8 billion) did, despite starting the quarter as the smallest of the three. Combined, the three companies’ cloud units took in roughly $109.9 billion in the quarter (my calculation: $45,984 million + $33,165 million + $30,709 million), a figure that did not exist a year ago in anything like this size.
Source: Alphabet, Microsoft and Amazon Q3 2026 earnings releases (linked above).

Source: Alphabet, Microsoft and Amazon Q3 2026 earnings releases (linked above).
5. Cloud market share 2026: AWS still leads, but the gap is narrowing
None of this changes the basic order of cloud market share 2026 by revenue. AWS at $46.0 billion is still about 39% larger than Azure’s $33.2 billion and about 50% larger than Google Cloud’s $30.7 billion (my calculation from the revenue figures above). Even after a year in which Google Cloud roughly doubled its revenue, it would need several more quarters of growth at a very different pace than AWS’s to close the dollar gap, since AWS’s own growth rate (39%) is still adding a large absolute amount on its bigger base.
What changed this quarter is the trend line, not the ranking. A year ago, in the third quarter of 2025, Google Cloud’s $15.2 billion in revenue was less than half of AWS’s $33.0 billion. In the third quarter of 2026, Google Cloud’s $30.7 billion is about two-thirds of AWS’s $46.0 billion. The gap, measured as a ratio, narrowed from Google Cloud being 46% of AWS’s size to 67% of AWS’s size over the year (my calculation from the revenue figures above).
6. The capex behind the numbers
None of this cloud growth is free. In the same quarter, Amazon’s companywide purchases of property and equipment (predominantly data centers and logistics infrastructure, not broken out by segment) were $77.3 billion, Alphabet’s were $51.4 billion ($51,355 million, up from $24.0 billion, or $23,953 million, a year earlier), and Microsoft’s additions to property and equipment were $39.4 billion. Added together, the three companies spent roughly $168.0 billion on capital investment in a single quarter (my calculation: $77,259 million + $51,355 million + $39,367 million).
Amazon separately said it continues “to expect 2026 cash capital expenditures to be approximately $220 billion” for the full year, a figure that is the company’s own forward-looking projection, not a reported outcome. This spending is the same story we covered in our look at hyperscaler capex guidance, which looked at full-year 2026 capex guidance across four companies; this quarter’s figures show that spending continuing at a high rate even as cloud revenue accelerates. Some of that capex is going toward the kind of memory and server hardware behind the rising cost of memory chips, and feeding demand for electricity at a moment when the grid is already the bottleneck for new data centers in several regions.
Capex figures across the three companies are not perfectly comparable: Amazon’s and Alphabet’s figures cover their whole company (including non-cloud operations), Microsoft’s figure explicitly excludes finance leases, and all three can shift spending between a capitalized purchase and a leased asset in ways that make quarter-to-quarter and company-to-company totals an approximate guide rather than an exact one.
7. What this gets misread as
The 103% growth figure invites a “Google Cloud is winning” headline, and the $46.0 billion AWS figure invites an “AWS is untouchable” headline. Both overstate a single quarter. A 103% growth rate against a smaller base is mechanically easier to produce than against a larger one, which is part of why Azure’s 48% and AWS’s 39% still look respectable, and in AWS’s case, represent a reacceleration from the 20% growth rate AWS itself reported in the third quarter of 2025. None of the three companies’ quarterly filings make a claim about overall “market share” in percentage terms; the comparisons in this article come from the companies’ own disclosed revenue and operating-income figures, not from a third-party market-share index.
It is also worth separating the cloud story from the broader question of whether this spending translates into jobs or productivity gains elsewhere in the economy, a question this site examined separately in looking at whether AI is actually replacing entry-level workers, and from the macro backdrop described in the IMF’s broader growth outlook. Cloud revenue growth says something about demand for AI infrastructure specifically; it is not a direct measure of economic growth, employment, or profitability outside these three companies.
What to watch
- Whether Google Cloud’s margin keeps climbing. Its operating margin rose from about 23.7% to about 36.2% year over year on this article’s calculation; a further rise (or a reversal) next quarter will show whether this was a one-off mix shift or a durable trend.
- Whether Microsoft’s $677 billion backlog converts into revenue on schedule. A 73% increase in remaining performance obligation only matters if the contracted work is delivered and billed in a timely way.
- Whether AWS’s 39% growth rate holds or fades. It followed a slower 20% growth rate a year earlier, so the next one or two quarters will show whether the acceleration is a new normal or a temporary jump.
- How the two new Microsoft segments (Agents and Infra; Devices and Consumer) get reported going forward, since the change makes it harder to compare this quarter’s Azure-specific figures against Microsoft’s pre-2027 fiscal disclosures without adjustment.
- Whether capital spending (roughly $168.0 billion combined this quarter alone) keeps growing faster than cloud revenue, which would squeeze free cash flow at all three companies even as reported profits rise.
The bottom line
In the third quarter of 2026, AWS remained the largest cloud provider by revenue at $46.0 billion, Microsoft’s Azure grew revenue 48% to $33.2 billion and posted the largest contracted-but-undelivered order backlog of the three, and Google Cloud grew fastest in percentage terms at 103% while also adding more new revenue, $15.6 billion, than either rival. All three are spending heavily to sustain it: a combined $168.0 billion in one quarter’s capital expenditure. The scoreboard depends on which number you read: AWS wins on absolute size, Google Cloud wins on both growth rate and dollars added, and Azure sits in between with the single largest contracted-but-undelivered backlog of the three at $677 billion.
Related reading
- The AI bet: who spends it, and who pays: the full-year 2026 capex guidance that funds the cloud growth described in this article.
- Why memory chips got so expensive: the DRAM shortage in numbers: one of the cost pressures behind the capital spending described above.
- Data Center Power Demand Is Set to Double by 2030. The Grid Is the Bottleneck.: the electricity-supply constraint on the data centers this spending builds.
- Is AI hurting entry-level jobs? Two studies, two answers: a separate look at what AI investment is and is not changing in the labor market.