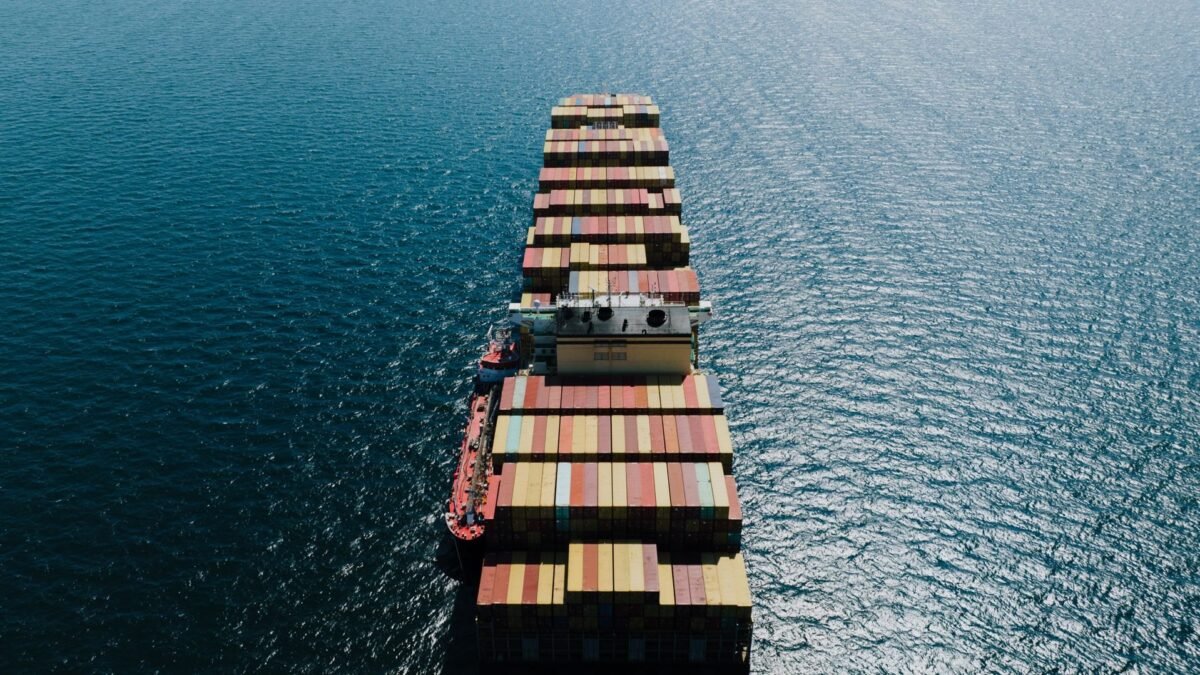
Maritime transport is the indispensable circulatory system of the world economy. According to UN Trade and Development (UNCTAD) in its flagship report Review of Maritime Transport 2025, global maritime trade accounts for more than 80% of the total volume of international merchandise commerce. Every consumer device, barrel of crude oil, grain shipment, and manufacturing component relies at some stage on commercial vessels navigating international waterways.
Yet over the past two years, global shipping lanes have confronted an unprecedented convergence of geopolitical, logistical, and environmental disruptions. Houthi attacks in the Red Sea forced container ships and bulk carriers to abandon the Suez Canal and sail thousands of miles around Africa. At the same time, severe drought restricted transit slots through the Panama Canal, and rising tensions in the Middle East elevated risks across the Persian Gulf. As ships sailed longer distances, ton-miles expanded nearly three times faster than underlying trade volumes, driving up freight rates, extending delivery lead times, and lifting fleet emissions. Here are the eight numbers from UNCTAD’s maritime review that explain how global shipping is adapting to chronic volatility.
1. Over 80%: The lifeblood of international merchandise commerce
The overarching reality of global commerce is its absolute reliance on maritime transport. According to UNCTAD’s long-running assessment, ships transport more than 80% of the volume of all international trade in goods. For developing nations, small island developing states (SIDS), and landlocked developing countries, that dependency is even higher.
The institutional framework behind these statistics has been maintained continuously since 1968 in the Review of Maritime Transport. The report monitors commercial fleet ownership, shipbuilding, port throughput, and freight rates across hundreds of coastal nations.
Because seaborne shipping handles the vast majority of raw materials and finished goods, any disruption to maritime supply chains translates directly into domestic inflation. As analyzed in our review of fossil fuel import price shocks, import-dependent economies face compounded fiscal strain when elevated maritime insurance premiums and volatile freight rates coincide with higher landed fuel bills.
2. 0.5% vs 2.2%: Maritime trade volume growth stalls
While maritime shipping carried record absolute tonnage, the pace of cargo volume expansion experienced a pronounced deceleration. According to UNCTAD, global maritime trade expanded by a modest 2.2% in 2024, but growth slowed to just 0.5% in 2025.
This deceleration to 0.5% reflects broader macroeconomic headwinds: tightening monetary policy, trade policy fragmentation, tariff escalation in North America, and sluggish industrial demand across Western Europe. Despite steady consumer spending in select advanced markets, manufacturing inventories remained disciplined, preventing a broad restocking cycle.
The slowdown illustrates that the shipping industry’s recent earnings boom was not generated by a surge in physical goods demand. Rather, shipping lines achieved elevated revenues because vessels were trapped on longer routes, creating artificial capacity shortages across major ocean corridors.
3. 6%: Ton-miles surge nearly three times faster than trade volume
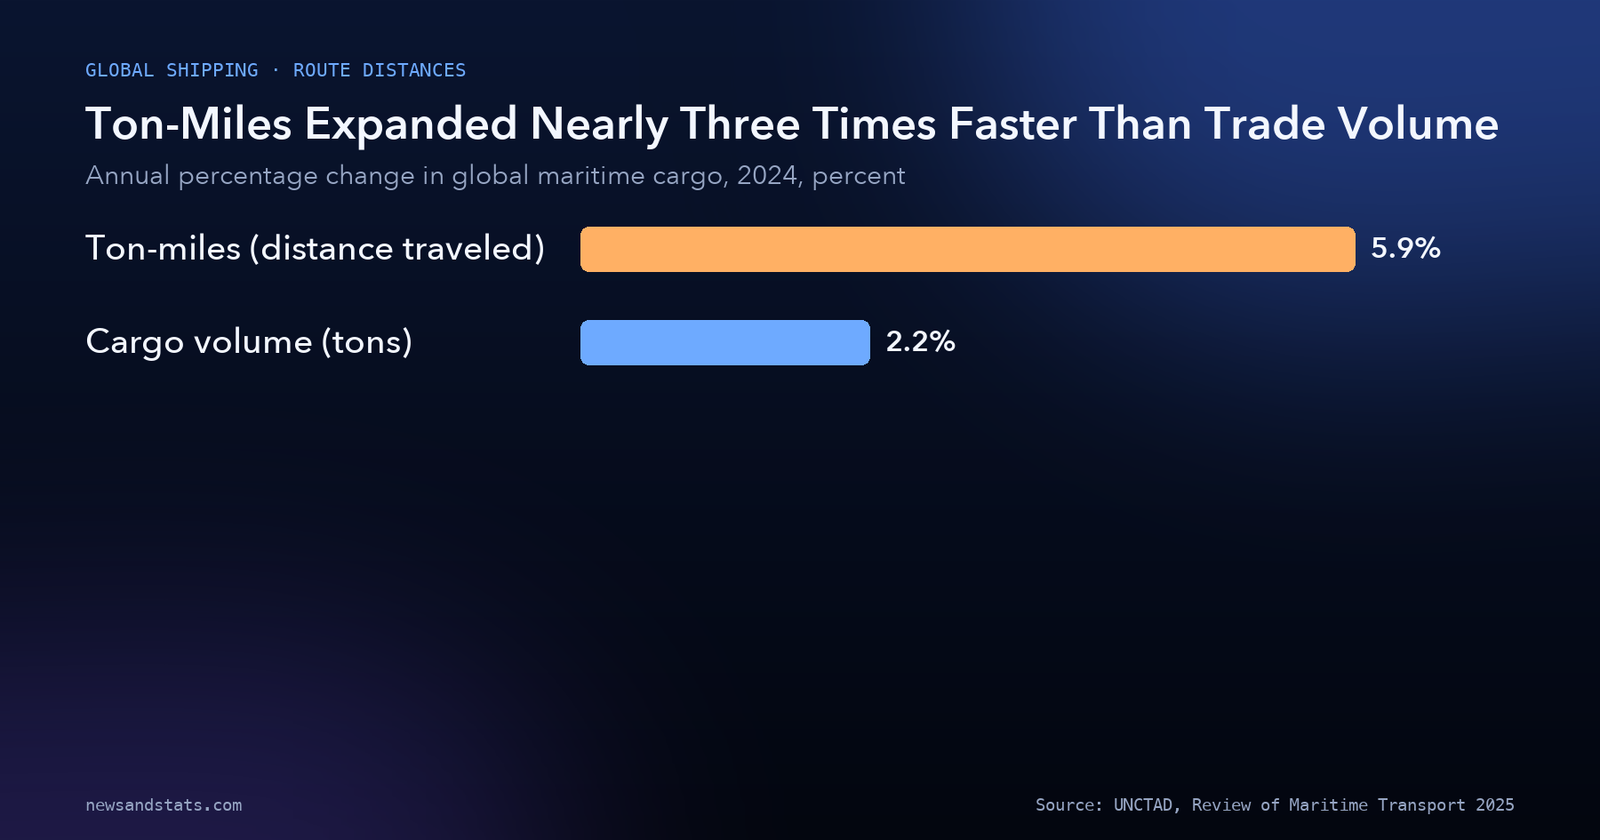
The defining structural distortion in modern shipping is the decoupling of cargo weight from voyage distance. While maritime cargo volume grew by 2.2% in 2024, maritime ton-miles—a metric multiplying cargo tonnage by the distance traveled in miles—surged by a record 6% (measured at 5.9% in detailed data).
Our calculation: ton-miles expanded 2.68 times faster than underlying cargo volume in 2024 (5.9% divided by 2.2%). This marks the widest gap between volume growth and distance growth recorded in modern maritime history.
Source: UNCTAD, Review of Maritime Transport 2025.
When commercial vessels are forced to avoid key shortcut waterways, they must sail thousands of additional nautical miles to deliver the same physical ton of cargo. For example, sailing from Shanghai to Rotterdam via the Cape of Good Hope adds roughly 10 to 14 days and 3,500 nautical miles per voyage compared to the Suez Canal. This detour effectively absorbed substantial new ship capacity, preventing a market oversupply from crashing freight rates.
The surge in distance traveled also impacted energy shipping. While global crude oil volumes remained flat, tankers took longer voyages to transport Atlantic basin crude to Asia, and Russian crude sailed extended voyages to India and China. Similarly, global trade in liquefied natural gas export infrastructure faced rerouting around Africa, tying up specialized LNG carriers for weeks.
4. 70%: Suez Canal transit tonnage collapses
The primary catalyst behind the ton-mile explosion was the prolonged crisis in the Red Sea. By May 2025, commercial cargo tonnage transiting the Suez Canal remained 70% below 2023 baseline levels.
Historically, the Suez Canal handled a vital share of global trade, including roughly one-fifth of all container traffic and significant volumes of refined petroleum and grain. Missile and drone attacks on merchant vessels transiting the Bab al-Mandab Strait prompted major ocean carriers—including Maersk, MSC, CMA CGM, and Hapag-Lloyd—to indefinitely divert their Asia-Europe liner services around the southern tip of Africa.
Our calculation: a 70% collapse in Suez Canal tonnage diverted roughly seven out of every ten tons of normal canal traffic onto the Cape of Good Hope route, adding thousands of ton-miles to standard bilateral trade lanes.
This diversion disrupted port scheduling worldwide. European destination ports experienced “vessel bunching,” where delayed container ships arrived simultaneously, overwhelming terminal cranes and causing severe yard congestion in Rotterdam, Antwerp, and Hamburg.
As examined in our comparison of the economic gap between India and China, Asian export hubs bore heavy logistical burdens. Indian exporters shipping textiles and engineering goods to Europe saw transit times lengthen by up to 20 days, eroding cash flow and raising container insurance costs.
5. 11% and one-third: The strategic vulnerability of Hormuz
While the Red Sea experienced persistent rerouting, the global energy system faced acute exposure at the Strait of Hormuz. According to UNCTAD, 11% of all global maritime trade and one-third (33%) of worldwide seaborne oil pass through this narrow waterway between Oman and Iran.
Unlike the Suez Canal, the Strait of Hormuz cannot be bypassed by sailing around a continent. It is a strict physical bottleneck with no maritime alternative for crude exports from Saudi Arabia, Kuwait, Iraq, Qatar, Bahrain, and the United Arab Emirates.
UNCTAD’s analysis warns that disruption in the Persian Gulf risks crippling global energy logistics. In June 2025, geopolitical friction spiked tanker risk premiums, sending dirty and clean tanker freight indices surging. For energy-importing economies across East Asia, where over 70% of crude supplies transit Hormuz, securing escort corridors and strategic petroleum reserves has become a national priority.
6. 149%: Shanghai container freight rates soar
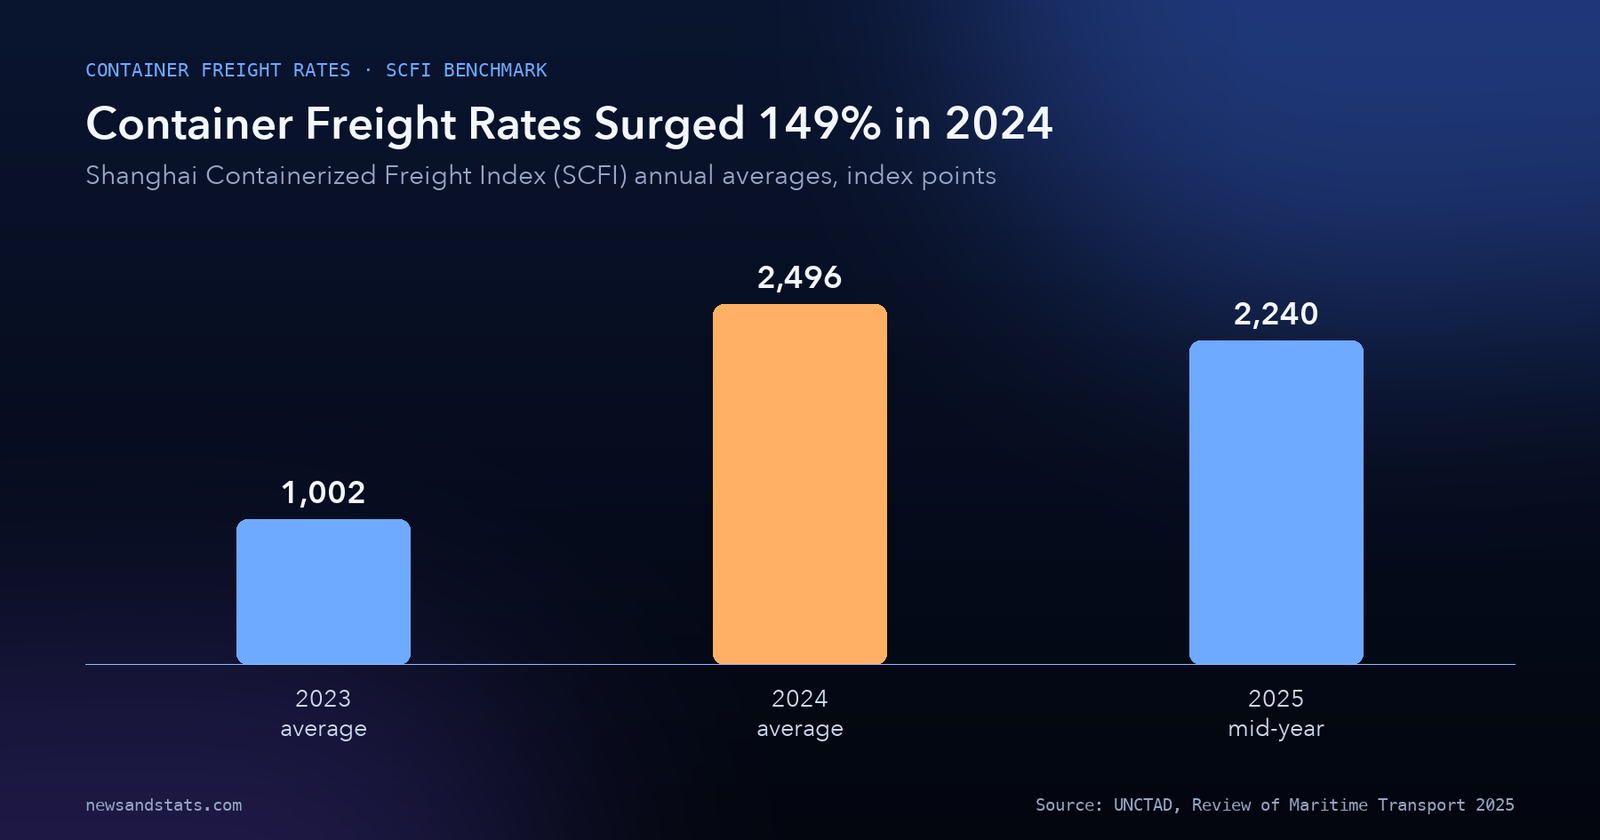
The absorption of vessel capacity on lengthened voyages triggered violent swings in ocean freight costs. The Shanghai Containerized Freight Index (SCFI)—the global benchmark measuring spot container rates from China—averaged 2,496 points in 2024, representing an extraordinary 149% surge over 2023 levels.
Our calculation: with the 2024 average reaching 2,496 points after a 149% increase, the 2023 baseline average stood at approximately 1,002 points.
Source: UNCTAD, Review of Maritime Transport 2025.
Spot freight rates on Asia-to-Europe routes spiked to $3,600 per twenty-foot equivalent unit (TEU) in July 2024, approaching levels previously seen only during pandemic supply chain disruptions. By mid-2025, spot rates softened slightly to $2,240 per TEU as a wave of newly built container ships entered service, but rates remained more than double their historical pre-crisis baselines of $869 to $916.
High shipping costs hit vulnerable developing economies hardest. Small island developing states and least developed countries pay shipping rates up to three times higher than the global average due to low trade volumes, transshipment dependencies, and inadequate port infrastructure.
For global technology supply chains reliant on advanced manufacturing and semiconductor supply chains, freight rate inflation and equipment shortages caused spot component lead times to extend, demonstrating how physical shipping logistics govern high-tech manufacturing.
7. 5%: Longer voyage routes drive up greenhouse emissions
Rerouting vessels around continents carries an immediate environmental penalty. According to UNCTAD, global maritime shipping greenhouse gas emissions expanded by 5% in 2024.
This 5% emissions increase reversed recent efficiency gains achieved through slow steaming and hull modifications. When container ships take the Cape of Good Hope detour, they must sail at higher engine speeds to make up for lost schedule time. Burning bunker fuel at elevated speeds over 3,500 additional nautical miles increases total fuel consumption and carbon dioxide output per voyage.
Monthly carbon dioxide emissions from international merchant vessels climbed toward historical peak levels, complicating international decarbonization commitments. The energy demand from commercial shipping mirrors the broader industrial energy squeeze examined in our analysis of power grid bottlenecks and infrastructure constraints, where industrial sectors struggle to reconcile expanding operational requirements with carbon reduction targets.
In response, the International Maritime Organization (IMO) has advanced its Net-Zero Framework, targeting net-zero greenhouse gas emissions from international shipping by or around 2050. The framework incorporates a global marine fuel standard mandating gradual reductions in fuel greenhouse gas intensity, alongside an economic carbon pricing mechanism to fund clean technology deployment in developing ports.
8. Only 8%: The alternative fuel transition bottleneck
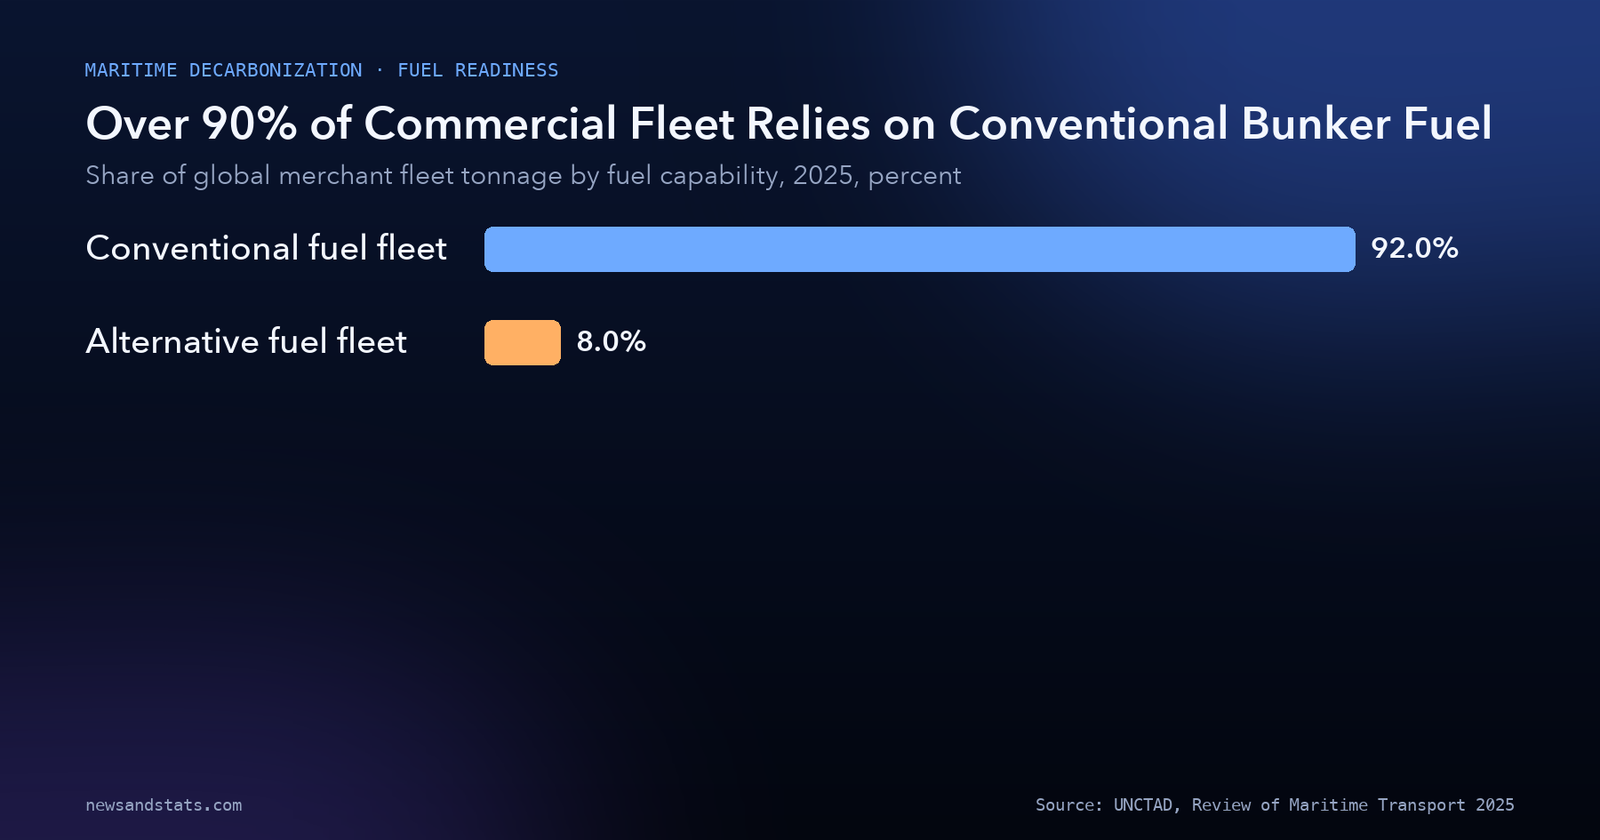
Achieving long-term maritime decarbonization requires replacing conventional heavy fuel oil and marine gasoil with green alternatives. However, UNCTAD’s fleet data reveals an immense infrastructure gap: only 8% of the world merchant fleet’s gross tonnage is currently equipped to use alternative fuels.
Our calculation: 92% of the world’s commercial fleet remains entirely dependent on conventional petroleum bunker fuels.
Source: UNCTAD, Review of Maritime Transport 2025.
While dual-fuel ships (primarily capable of running on liquefied natural gas or methanol) account for nearly half of new shipbuilding orders placed in Asian shipyards, replacing the existing 112,500-vessel global fleet takes decades. Commercial vessels have an average operating lifespan of 20 to 25 years, and ship recycling rates remain historically depressed as operators keep older vessels active to meet rerouting demands.
Furthermore, ports worldwide face shortages of green bunkering infrastructure. Producing and distributing green methanol, ammonia, and hydrogen at scale requires trillions of dollars in capital expenditure, port adaptation, and renewable energy generation. Until clean fuel availability expands in major bunkering hubs like Singapore, Rotterdam, and Fujairah, international shipping will remain firmly anchored in fossil fuels.
How to read the Review of Maritime Transport numbers
Interpreting international maritime datasets requires recognizing five critical operational distinctions:
- Cargo volume differs from transport work. Cargo volume measures weight in metric tons (expanding 2.2% in 2024 and 0.5% in 2025). Transport work measures ton-miles (tons multiplied by nautical miles traveled), which surged 6% due to chokepoint diversions.
- Spot freight rates differ from contract rates. The SCFI tracks spot container rates for immediate booking. Large multinational shippers move the majority of their cargo under long-term annual service contracts, meaning spot market spikes take several quarters to filter into retail prices.
- Fleet orderbook delivery is cyclical. An influx of new container ship capacity ordered during the pandemic began entering service in 2024 and 2025, which began easing freight rates despite ongoing Red Sea detours.
- Alternative fuel capability is not green fuel consumption. An 8% share of dual-fuel capable tonnage does not mean 8% of maritime fuel consumed is green. Many dual-fuel vessels operate predominantly on standard fossil bunker fuel when green methanol or bio-LNG is unavailable or cost-prohibitive.
- Chokepoint vulnerabilities are cumulative. Shifting routes away from the Red Sea concentrates maritime traffic in secondary bottleneck ports like Algeciras, Tanger Med, and Durban, creating cascading regional berthing delays.
The global maritime shipping transition at a glance
The following table summarizes the primary metrics tracked in UNCTAD’s Review of Maritime Transport 2025 across trade volume growth, route distances, freight benchmarks, and environmental indicators.
| Metric | Measured value | Reference period | Key operational or geopolitical driver | Source |
|---|---|---|---|---|
| Seaborne share of world trade volume | >80% | Ongoing baseline | Core backbone of international merchandise commerce | UNCTAD Maritime Review 2025 |
| Maritime trade volume growth 2024 | 2.2% | Calendar 2024 | Modest post-pandemic trade recovery | UNCTAD Maritime Review 2025 |
| Maritime trade volume growth 2025 | 0.5% | 2025 forecast | Macroeconomic headwinds and tariff uncertainty | UNCTAD Maritime Review 2025 |
| Global shipping ton-miles growth | 5.9% (record ~6%) | Calendar 2024 | Cape of Good Hope rerouting around Africa | UNCTAD Maritime Review 2025 |
| Suez Canal cargo tonnage decline | 70% below baseline | As of May 2025 | Commercial avoidance of Red Sea security threats | UNCTAD Maritime Review 2025 |
| Strait of Hormuz share of global trade | 11% of world trade | Strategic baseline | Critical maritime energy and goods conduit | UNCTAD Maritime Review 2025 |
| Strait of Hormuz share of seaborne oil | 33% (one-third) | Energy baseline | Primary global crude oil transport bottleneck | UNCTAD Maritime Review 2025 |
| SCFI container freight index average | 2,496 points | 2024 average | Surged 149% over 2023 baseline (1,002 points) | UNCTAD Maritime Review 2025 |
| Peak container spot freight rate | $3,600 per container | July 2024 | Approached pandemic-era emergency highs | UNCTAD Maritime Review 2025 |
| Mid-2025 container spot freight rate | $2,240 per container | June 2025 | Eased but remained double pre-crisis baseline | UNCTAD Maritime Review 2025 |
| Pre-crisis container spot rate baseline | $869 to $916 | 2015-2023 low | Historical normalized baseline freight rate | UNCTAD Maritime Review 2025 |
| Shipping greenhouse gas emissions growth | 5% increase | Calendar 2024 | Longer voyage distances and higher vessel speeds | UNCTAD Maritime Review 2025 |
| Fleet share equipped for alternative fuels | 8% of world tonnage | 2025 fleet status | 92% of commercial fleet remains on fossil fuel | UNCTAD Maritime Review 2025 |
Source: UNCTAD, Review of Maritime Transport 2025.
What to watch
- Whether Red Sea security conditions stabilize to allow ocean liners to resume regular Suez Canal transits, or whether Cape of Good Hope routing becomes permanent.
- The delivery cadence of the global container ship orderbook in 2026, observing whether new vessel tonnage creates fleet overcapacity and depresses freight rates.
- The adoption of the IMO Net-Zero Framework in international negotiations, specifically the implementation mechanics of a global maritime carbon pricing levy.
- Port infrastructure adaptation in the Mediterranean and Southern Africa, tracking whether terminal congestion eases as carriers normalize rerouted schedules.
- Fuel availability in green bunkering corridors, monitoring whether supplies of bio-methanol and green ammonia expand fast enough to serve new dual-fuel deliveries.
- Geopolitical developments in the Strait of Hormuz, assessing whether tanker insurance surcharges impact crude delivery costs to Asian refineries.
The bottom line
Global maritime shipping remains the irreplaceable carrier of more than 80% of world trade, but geopolitical fractures have reconfigured international supply routes. With Suez Canal transits down 70% and ton-miles surging by 6% in 2024, ocean carriers navigated chronic route lengthening that drove container freight rates up 149% and pushed shipping emissions up 5%. As maritime trade growth slows to 0.5% and 92% of the commercial fleet remains dependent on conventional bunker fuel, the shipping industry is absorbing higher operational costs while confronting an ambitious IMO net-zero 2050 transition. For the broader macroeconomic backdrop framing international trade, explore our review of the global macroeconomic environment from the IMF, and visit our Industries section for continuing analysis of global technology and supply chain networks.
Related reading
- Who pays for the 2026 energy shock? The numbers, country by country: how shipping bottlenecks and oil price surges impact national budgets.
- The Global LNG Supply Wave Is Still Coming, but the Gulf Outage Has Delayed Its Relief: liquefied natural gas export projects, maritime routes, and regional gas pricing.
- India vs China: the economic gap in 10 numbers: manufacturing capacity, trade infrastructure, and demographics compared.