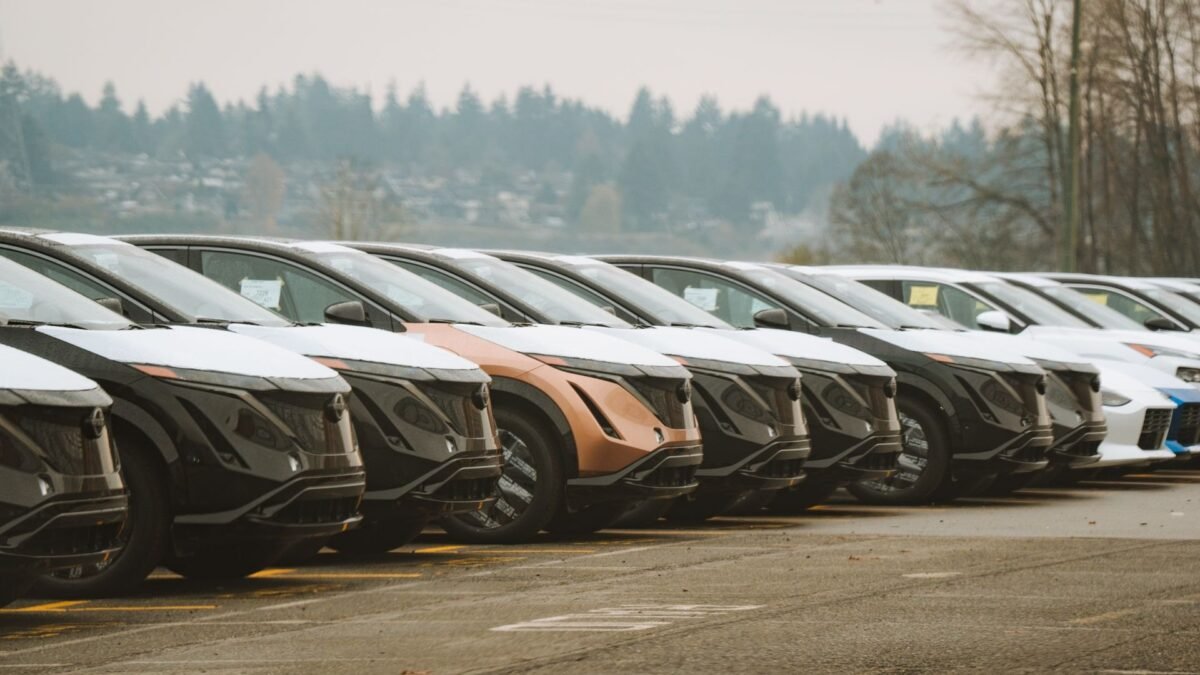
The worldwide automotive industry crossed an irreversible threshold in 2025. According to the International Energy Agency (IEA) in its report Global EV Outlook 2026, global electric car sales expanded by 20% in 2025 to exceed 20 million units. That single-year milestone means that exactly one in every four new passenger cars sold worldwide was electric.
This market expansion is fundamentally altering international commerce, industrial manufacturing, and oil consumption. While traditional internal combustion vehicle sales remain far below their 2017 historical peak, electric vehicle (EV) production surged by more than 25% to approach 22 million units in 2025. Yet beneath this headline growth lies an extraordinary concentration of industrial supply chains. China now manufactures nearly three out of every four electric cars produced on earth and refines over 80% of battery cells. Here are the eight numbers from the IEA’s assessment that explain how global electric car sales are redrawing trade balances, accelerating oil displacement, and transforming the automotive landscape.
1. More than 20 million units: Global electric car sales reach one in four
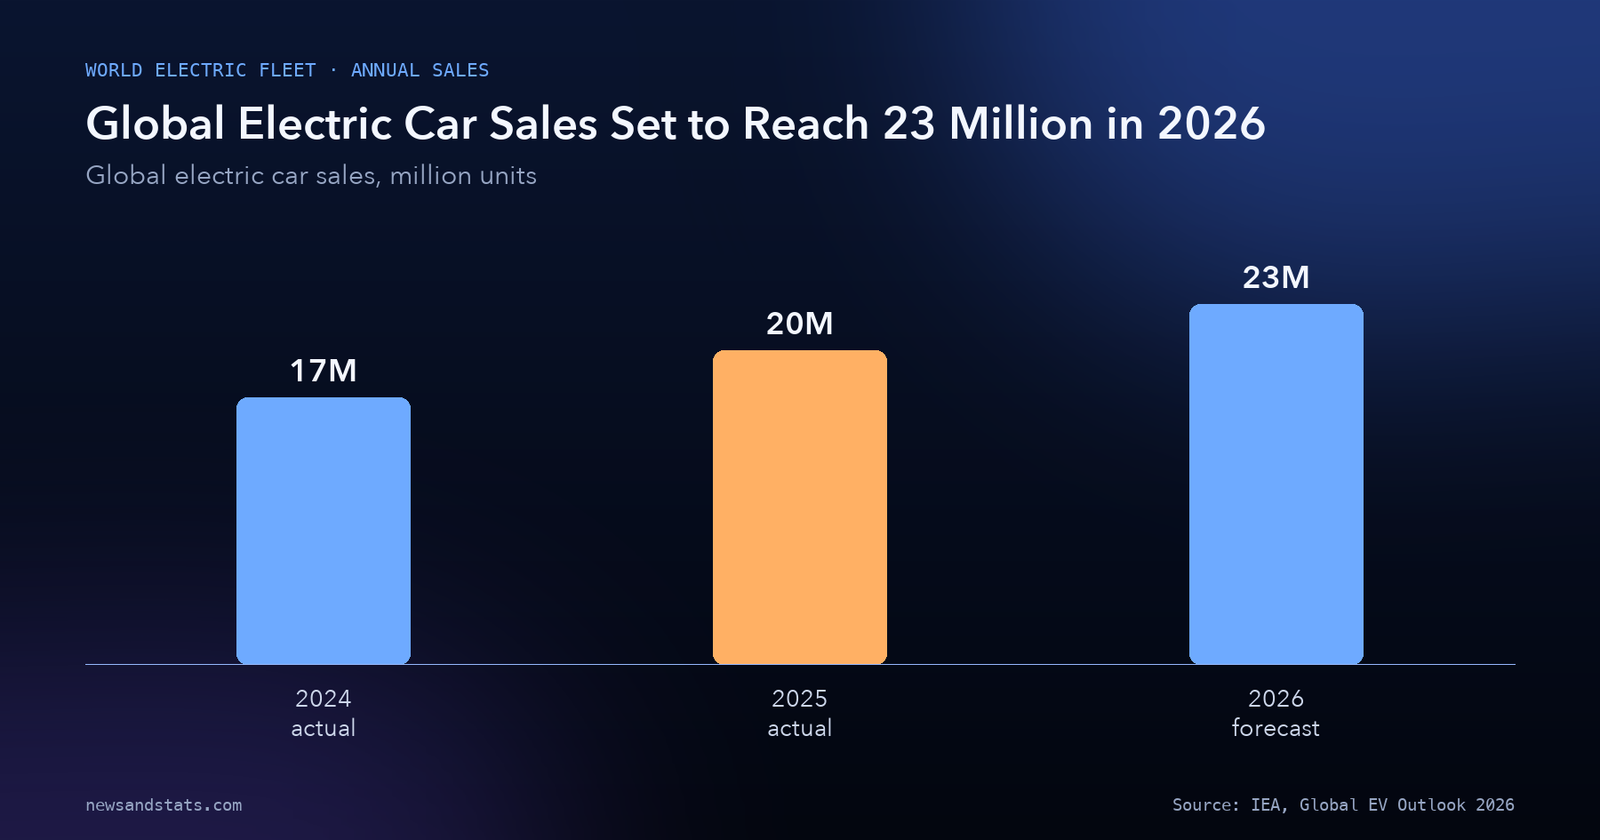
The headline metric of the automotive transition is total annual delivery volume. According to the IEA, global electric car sales grew by 20% in 2025 to exceed 20 million units, up from more than 17 million in 2024.
This delivery volume elevated electric drivetrains—encompassing fully battery electric vehicles (BEVs) and plug-in hybrids (PHEVs)—to 25% (one-quarter) of all new passenger cars sold globally. Sales growth was recorded in more than 100 countries during 2025, and in one-third of those markets, electric models accounted for at least 10% of new registrations.
The medium-term outlook points to sustained compounding. The IEA projects that global electric car sales will expand to 23 million units in 2026, capturing 28% of the worldwide passenger car market. Looking further ahead, the agency projects the global operational fleet of electric light-duty vehicles to expand more than sixfold from 2025 levels, reaching as many as 510 million cars by 2035.
Source: IEA, Global EV Outlook 2026.
The broader economic implications are significant for fuel-importing nations. As demonstrated in our analysis of fossil fuel import price shocks, volatile international crude prices create persistent trade deficits for consuming economies, making domestic fleet electrification a strategic priority for energy security.
2. Nearly 55% vs 28% vs 10%: The regional adoption gap widens
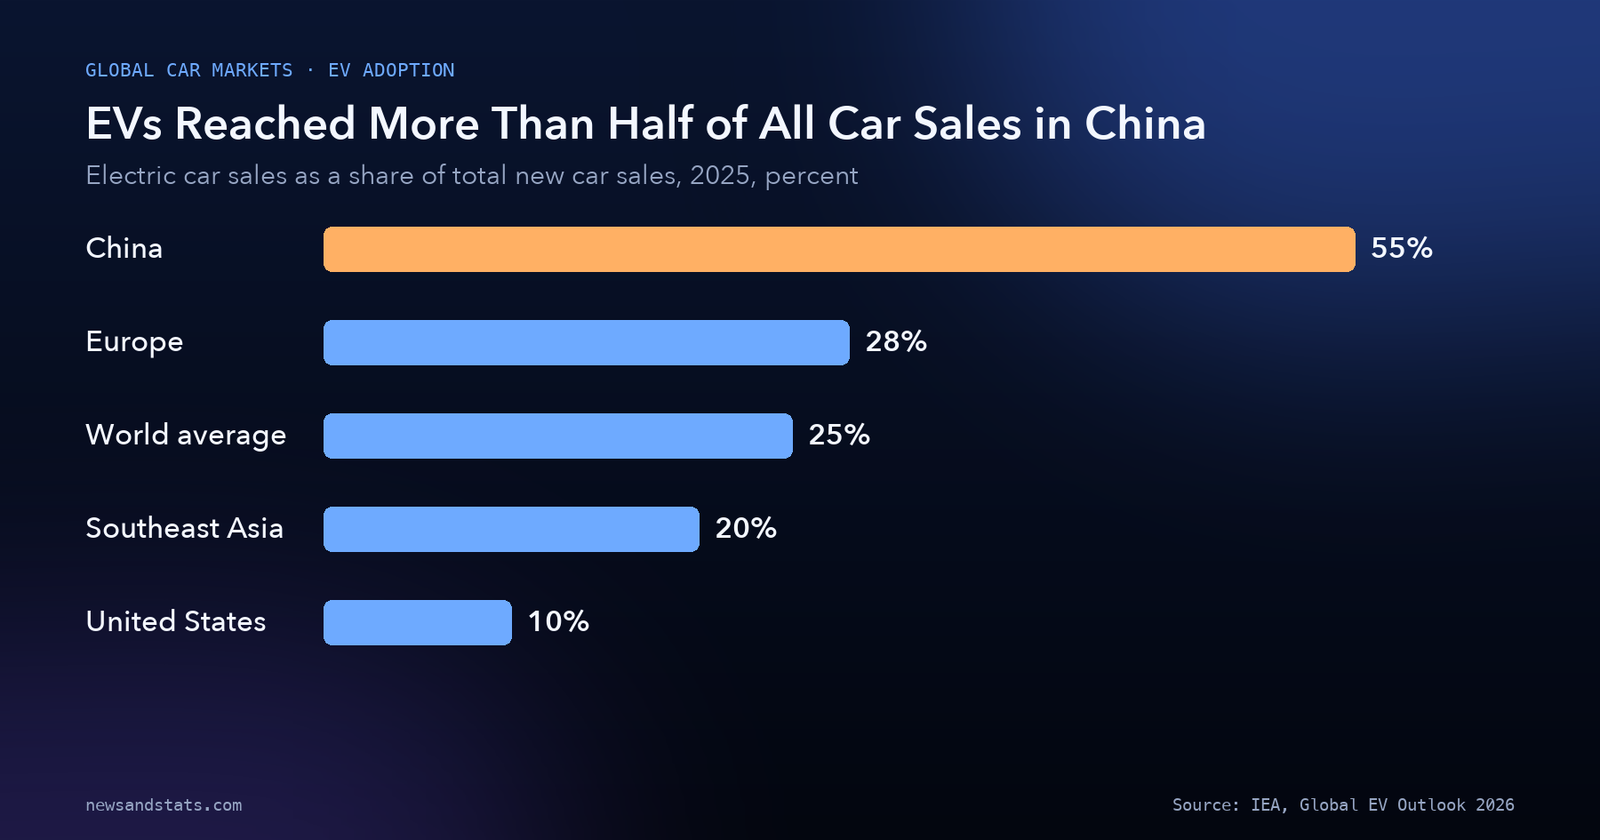
While global sales averaged 25%, regional adoption patterns diverged sharply among the world’s three largest automotive markets:
- In China, electric models captured nearly 55% of all new passenger car sales in 2025.
- In Europe, electric car sales surged by more than 30% to reach a 28% market share.
- In the United States, electric car sales stabilized at just under 10% of total sales.
In China, consumer preference has tipped decisively toward electric platforms, supported by widespread fast-charging infrastructure and intense domestic competition. In April 2026, preliminary monthly figures indicated that electric cars exceeded 60% of all new car registrations in China.
In Europe, the 30% surge was propelled by regulatory mandates, specifically the tightening of European Union corporate fleet CO2 emission standards, which compelled automakers to introduce more affordable models to avoid regulatory fines. In 2026, the IEA expects European electric car sales to expand by another 20%, bringing the region’s adoption rate to one in three cars (33%).
Source: IEA, Global EV Outlook 2026.
In the United States, adoption lagged other advanced economies. The expiration of specific federal purchase incentives at the end of 2025 contributed to softer fourth-quarter volumes, leaving the US market share at roughly 10%. As examined in our coverage of the clean energy innovation and battery patent race, North American automakers face higher initial battery pack manufacturing costs, slowing their deployment of affordable entry-level mass-market models.
Meanwhile, emerging markets recorded rapid adoption. In Southeast Asia, annual electric car sales more than doubled in 2025 to achieve a sales share of nearly 20%, led by Viet Nam, Indonesia, and Thailand. In Latin America, sales grew by 75%, anchored by Brazil and Mexico.
3. 60%: Chinese automakers capture the global market
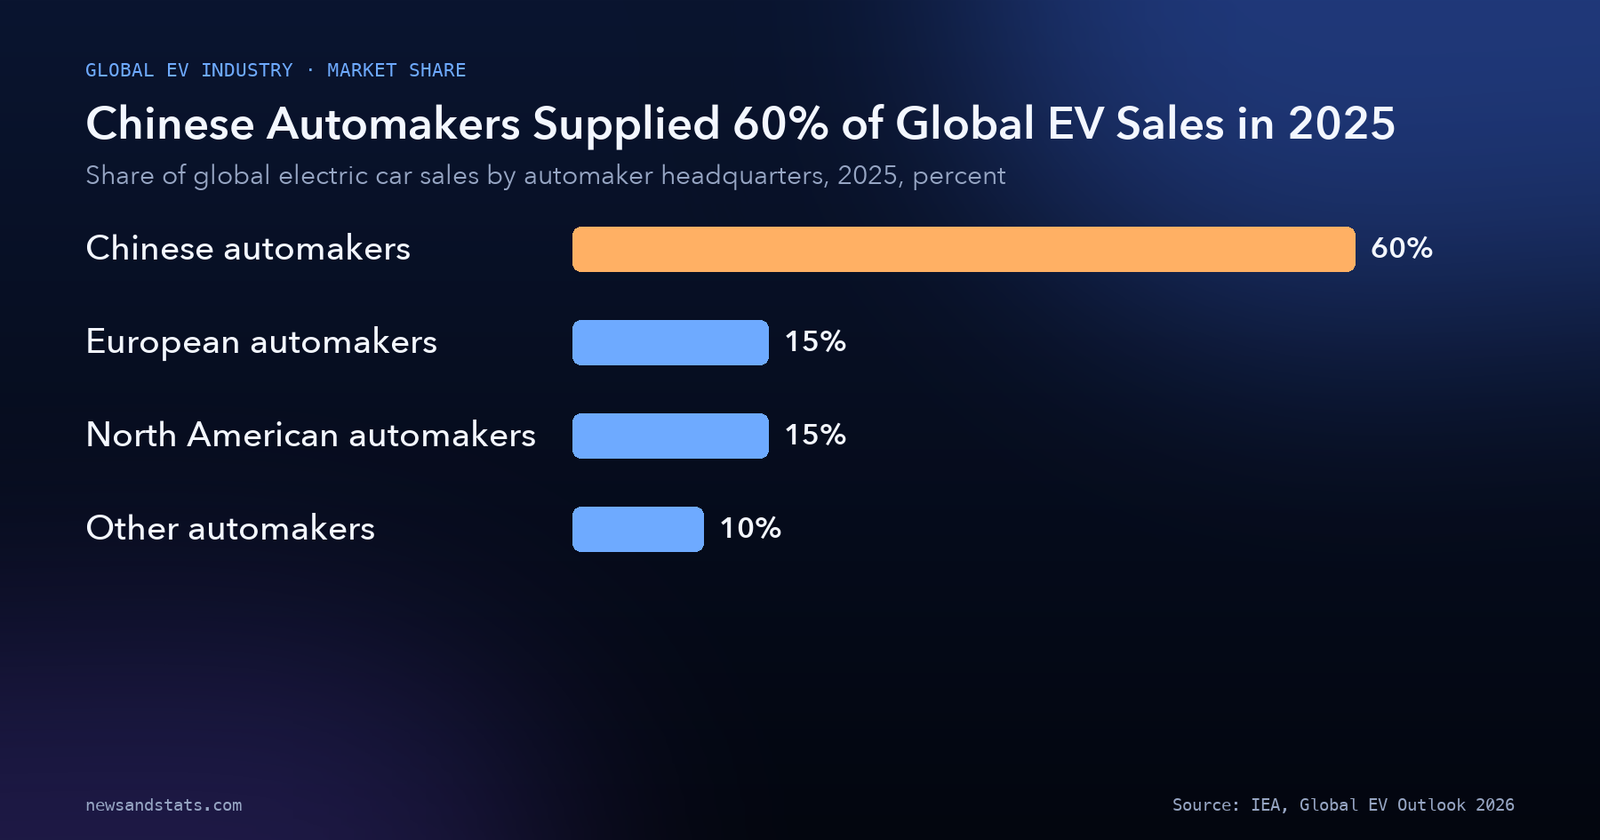
The corporate control of electric vehicle supply has centralized rapidly in China. In 2025, Chinese automakers supplied 60% of all electric cars sold worldwide.
By contrast, European and North American automobile manufacturers each accounted for about 15% of global sales. The remaining 10% was divided among Japanese, South Korean, and other regional manufacturers.
Source: IEA, Global EV Outlook 2026.
Our calculation: Chinese automakers (60%) sold four times as many electric vehicles in 2025 as European automakers (15%), and four times as many as North American automakers (15%).
This structural advantage reflects more than domestic market volume. In emerging economies across Southeast Asia, Latin America, and the Middle East, Chinese manufacturers accounted for 55% of all electric car sales in 2025, up from less than 5% five years earlier. In Southeast Asia specifically, Chinese brands captured more than half of all EV deliveries.
The rising power requirements of charging infrastructure for millions of new vehicles are intersecting with utility planning. As documented in our review of power grid bottlenecks and transmission constraints, deploying megawatt-scale charging corridors requires proactive distribution upgrades to avoid straining suburban substations.
4. Nearly 75%: China’s dominance in EV and battery manufacturing
The gap between where electric cars are manufactured and where legacy automakers reside is striking. In 2025, China produced nearly 75% of all electric cars assembled worldwide.
Total worldwide electric car production approached 22 million units in 2025, representing a more than 25% increase compared with 2024. China’s domestic assembly plants produced approximately 16.5 million of those vehicles.
The upstream concentration in electrochemistry is even more pronounced. The IEA reports that China accounted for over 80% of global battery cell production in 2025, alongside an even higher share of cathode and anode active materials. Nearly all lithium-ion battery cells used in the global automotive sector are produced by firms headquartered in China, South Korea, or Japan.
Our calculation: with China producing 75% of electric vehicles and over 80% of battery cells, international supply chains remain heavily reliant on Chinese industrial clusters. As analyzed in our comparison of the economic gap between India and China, China’s vertical integration—spanning raw lithium refining, cathode synthesis, cell fabrication, and chassis assembly—has created a multi-year cost barrier for Western and Asian competitors attempting to re-shore supply chains.
5. Over 2.5 million units: Chinese EV exports double to record highs
Because China’s domestic manufacturing capacity expanded faster than its domestic consumption, Chinese automakers aggressively scaled exports. In 2025, Chinese electric car exports doubled to reach an all-time record of over 2.5 million vehicles.
China overtook the European Union in 2024 to become the world’s largest exporter of motor vehicles. In 2025, electric vehicles accounted for more than 35% of all automobile exports departing Chinese ports, up from 20% in 2024.
Our calculation: an increase from 20% to 35% represents a 15 percentage point increase in the EV share of Chinese automotive exports within a single year. Approximately one in every four electric cars produced worldwide in 2025 was traded across an international border.
This export surge created trade friction. In Europe, electric car imports from China expanded by around 35% in 2025 to surpass 900,000 units, with Chinese models accounting for almost 60% of all EV imports into the European Union. In the first quarter of 2026, Chinese electric car exports more than doubled again compared to the same period in 2025. However, the IEA notes that inventories began accumulating in overseas hubs during late 2025, as Chinese export shipments exceeded foreign retail deliveries by more than 25%.
6. 70%: Price parity transforms consumer economics in China
The primary catalyst behind China’s rapid EV adoption is sticker price competitiveness. The IEA reports that in China, 70% of all battery electric cars sold in 2025 were already cheaper than the average conventional internal combustion car in their respective vehicle segments.
In China’s small and compact passenger car segments, electric vehicles have already largely displaced conventional gasoline vehicles. Western markets exhibit a stark contrast: in Europe and North America, electric vehicles continue to carry a purchase price premium over comparable gasoline models, although total cost of ownership (TCO) parity is increasingly achieved through lower operating expenditures.
The IEA calculates that based on prevailing crude oil prices, the annual fuel savings associated with driving an electric vehicle in the European Union in 2025 were 35% higher than in previous years. For commercial and corporate fleets that log high annual mileage, running cost savings can be several times larger than for private individual owners.
As vehicles transition into software-defined platforms, automakers are incorporating automotive semiconductor and memory chip supply chains to power advanced driver assistance systems (ADAS) and smart battery management systems (BMS). Fully autonomous robotaxis—all exclusively electric—are now operating commercially across more than 20 cities globally, primarily in China and the United States.
7. 9%: Electric trucks more than double as heavy commercial fleets electrify
While passenger cars represent the largest volume of EV deliveries, the electrification of commercial logistics gained substantial momentum in 2025. Sales of electric trucks more than doubled worldwide compared with 2024, reaching 9% of all commercial truck sales globally.
China drove the vast majority of this expansion, where electric truck sales doubled for the second consecutive year. One in every four trucks (25%) sold in China in 2025 was electric.
While heavy electric trucks remain two to three times more expensive to purchase upfront than diesel counterparts, falling battery pack costs have made total cost of ownership competitive in urban and regional freight. Chinese electric trucks are built almost entirely within a domestic ecosystem, with battery giant CATL supplying 80% of all electric truck batteries deployed in China.
In Europe, the IEA projects total cost of ownership parity between electric and diesel trucks by 2030, supported by the deployment of over 1,000 dedicated high-power commercial charging points along European highway corridors. Under current policy trajectories, electric trucks are projected to capture at least 20% of global truck sales by 2035, led by China where electric trucks are set to exceed 60% of sales.
In the micro-mobility sector, electric two- and three-wheelers remain the most electrified transport category globally. Sales in China and India reached 8.4 million units in 2025, while sales in Africa climbed to approximately 70,000 units—over 80 times the level recorded at the start of the decade.
8. 1.7 million barrels per day: The accelerating bite into global oil demand
The cumulative effect of millions of electric vehicles operating on global roadways is now visibly altering crude oil consumption. The IEA calculates that in 2025, the global fleet of electric vehicles avoided the consumption of approximately 1.7 million barrels of oil per day (mb/d).
This displacement occurred primarily in regions with strict corporate fuel economy standards and strong EV incentives, notably China and the European Union. In China alone—the world’s largest crude oil importer—the domestic EV fleet displaced around 1 mb/d of oil demand in 2025, a figure projected to rise to 2.7 mb/d annually by 2030.
On a global scale, the IEA projects that annual oil displacement from electric road transport will triple to around 5 mb/d by 2030. When combined with growing electric truck deployment—which is projected to avoid an additional 1 mb/d of diesel by 2035—the electrification of road transport is permanently capping global refined fuel demand.
The broader institutional and statistical framework of this transition is published in the IEA’s complete Global EV Outlook 2026. While global power demand from electric vehicles could exceed 1,500 TWh by 2035—growing sixfold from 2025 levels—this electricity will represent only about 4% of total worldwide power demand in 2035, proving that grid expansion can comfortably accommodate vehicle fleet electrification.
How to read the Global EV Outlook numbers
Interpreting international electric vehicle metrics requires recognizing five essential industry distinctions:
- Electric cars encompass both BEVs and PHEVs. The IEA’s 20 million sales figure covers both pure battery electric vehicles and plug-in hybrids. While BEVs represent the majority of deliveries, PHEVs with range extenders have expanded rapidly in China.
- Production origin differs from brand headquarters. China produced nearly 75% of all electric cars in 2025, but Chinese automakers accounted for 60% of global sales. The difference reflects Western brands (such as Tesla, BMW, and Volkswagen) manufacturing vehicles inside Chinese facilities for domestic sale and export.
- Upfront purchase price differs from total cost of ownership (TCO). An EV may carry a higher purchase price in Europe or the US, but lower per-mile electricity costs and reduced maintenance result in lower lifecycle ownership costs.
- Oil displacement is cumulative and structural. The 1.7 mb/d displaced in 2025 represents ongoing fuel that was not combusted because an electric vehicle drove those miles instead. Unlike temporary refinery outages, this demand reduction does not rebound when crude oil prices decline.
- Sales share is an annual flow, not total vehicle stock. Reaching 25% of new sales means 75% of new vehicles sold in 2025 were still internal combustion models. Because passenger cars remain in service for 15 to 20 years, turnover of the global two-billion-vehicle fleet takes decades.
The 2025 global electric vehicle transition at a glance
The following table synthesizes the primary metrics from the IEA’s Global EV Outlook 2026 across vehicle sales, market penetration, manufacturing shares, and oil displacement.
| Metric | Measured value in 2025 | Growth or comparison | Leading geography or milestone | Source |
|---|---|---|---|---|
| Global electric car sales | >20 million units | +20% year-on-year | Captured 25% (one in four) of all car sales | IEA Global EV Outlook 2026 |
| Global sales forecast 2026 | 23 million units | Projected +15% | Set to reach 28% of global passenger car sales | IEA Global EV Outlook 2026 |
| China EV sales share | ~55% of all sales | Nearly 55% | Reached record monthly high >60% in April 2026 | IEA Global EV Outlook 2026 |
| Europe EV sales share | 28% of all sales | +30% sales surge | One in three cars sold projected in 2026 | IEA Global EV Outlook 2026 |
| United States EV sales share | <10% of all sales | Relatively stable | Tax credit expiration slowed Q4 deliveries | IEA Global EV Outlook 2026 |
| Chinese automaker global sales share | 60% of world sales | Dominant | European and US automakers held 15% each | IEA Global EV Outlook 2026 |
| China share of EV production | ~75% of global output | Heavy concentration | Assembled bulk of ~22 million global EV build | IEA Global EV Outlook 2026 |
| China battery cell production share | >80% of world cells | Upstream monopoly | Headquartered firms supply nearly all cells | IEA Global EV Outlook 2026 |
| Chinese electric car exports | >2.5 million units | Doubled in 2025 | EVs comprised >35% of all Chinese car exports | IEA Global EV Outlook 2026 |
| China EV purchase price parity | 70% cheaper than ICE | Major tipping point | Small electric cars displaced conventional cars | IEA Global EV Outlook 2026 |
| Global electric truck sales share | 9% of all trucks | More than doubled | China led at 25% (one in four trucks electric) | IEA Global EV Outlook 2026 |
| Avoided daily oil consumption | ~1.7 mb/d | Structural reduction | Displaces 1 mb/d in China; set to hit 5 mb/d by 2030 | IEA Global EV Outlook 2026 |
Source: IEA, Global EV Outlook 2026: Executive Summary.
What to watch
- Whether global electric car sales achieve the IEA’s forecast of 23 million units in 2026, reaching 28% of total passenger car sales.
- The outcome of European Union regulatory reviews regarding proposed Automotive Package revisions and their impact on 2035 EV sales targets.
- Chinese electric vehicle inventory absorption in international export hubs, following 2025 shipments exceeding overseas sales by more than 25%.
- Adoption trajectories in Southeast Asia and Latin America, monitoring whether regional sales growth sustains its 50% to 75% expansion rates.
- The commercial rollout of 1,000-volt battery architectures and sub-10-minute ultra-fast charging systems in commercial passenger fleets.
- Electric heavy truck adoption in Europe and North America, observing whether total cost of ownership parity accelerates fleet transitions before 2030.
The bottom line
The global transition to electric mobility reached critical mass in 2025: worldwide sales grew 20% to surpass 20 million units, meaning one in every four new cars sold on earth was electric. China has established unprecedented industrial hegemony over this transition, supplying 60% of all global EV sales, assembling nearly 75% of all electric cars, producing over 80% of battery cells, and doubling vehicle exports to exceed 2.5 million units. While adoption in the United States and Europe navigates policy adjustments, the physical displacement of 1.7 million barrels of oil per day proves that the electrification of road transport is permanently capping global oil demand. For the wider macroeconomic backdrop, see our review of the global macroeconomic environment from the IMF, and explore our Industries section for detailed reporting on global industrial supply chains.
Related reading
- Who pays for the 2026 energy shock? The numbers, country by country: how fossil fuel import vulnerabilities shape national balance of payments.
- India vs China: the economic gap in 10 numbers: industrial strategy, manufacturing output, and export competitiveness compared.
- Data Center Power Demand Is Set to Double by 2030. The Grid Is the Bottleneck.: the transmission and power challenges created by digital infrastructure.