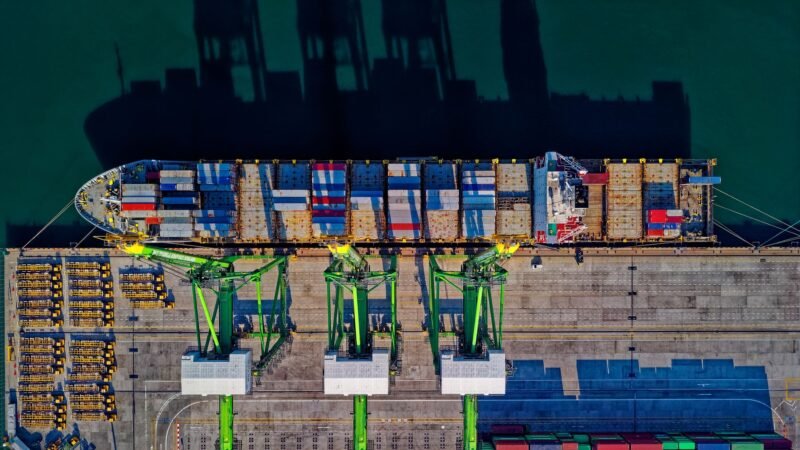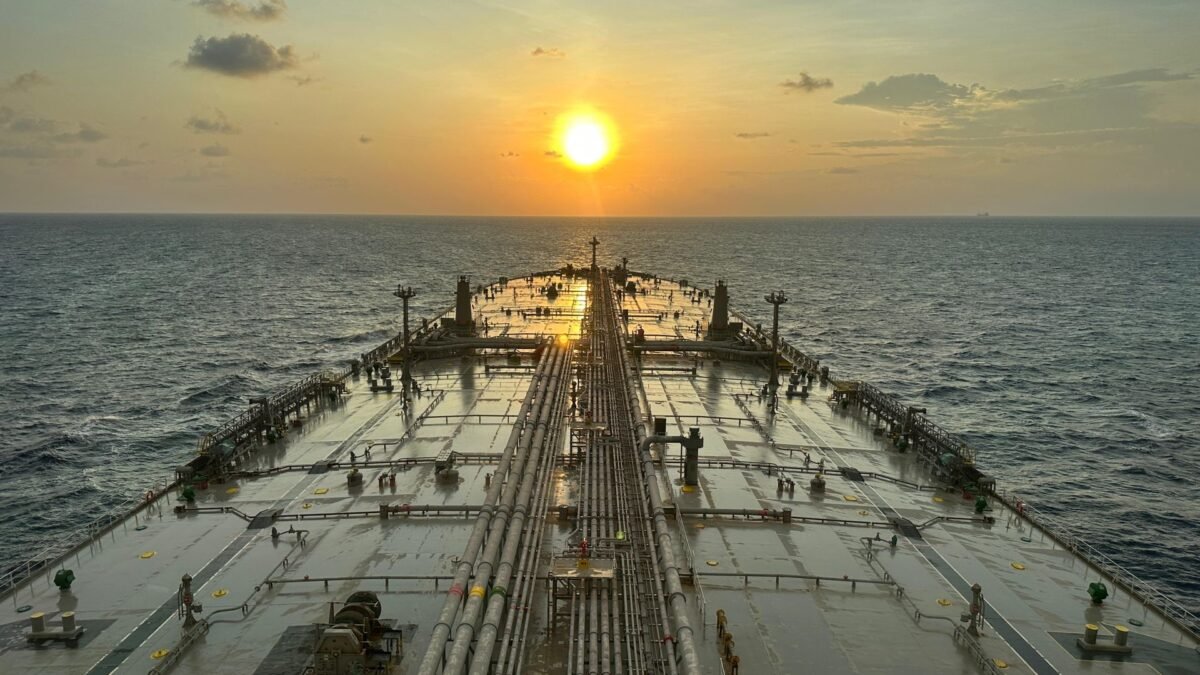
On Monday 26 October, Brent crude traded at about $115 a barrel, roughly 78% above where it stood a year earlier, according to Trading Economics. Eight months after the war involving Iran began to choke the Strait of Hormuz, the price sits close to its highest level since late April.
A price is only a number until someone has to pay it. This post follows the money: how big the bill is, which countries are carrying it, which ones have cushions, and why the households with the least room to absorb it are the ones the IMF worries about most.
How we got here, in five dates
- 28 February: US and Israeli strikes on Iran begin the war. Iran responds and closes the Strait of Hormuz. Before the war, the strait carried about 35% of the world’s seaborne crude oil trade, according to the World Bank, which called the resulting disruption the largest oil supply shock on record.
- Early March: LNG shipments through the strait stop and Qatar’s Ras Laffan plant, with capacity of 77 million tonnes a year, shuts. Europe’s gas benchmark jumps about 55% in a few days.
- 7 to 8 April: A two-week ceasefire is agreed, mediated by Pakistan, and Iran says ships can pass under its military’s coordination. Reports indicate the ceasefire period ran to early July, with fighting resuming on 8 July.
- Summer: The United States escorts tankers and keeps a blockade of Iranian ports. US Central Command says more than 1.5 billion barrels have moved through the strait with American help since the summer.
- October: Shipping-security tallies report 28 confirmed ship attacks in the strait this month, the worst of the year, and 113 since February. Houthi forces have also struck targets in Saudi Arabia.
How open is the strait today? Sources disagree. The International Energy Agency says Gulf crude exports in September were approaching pre-war levels, while warning that recent attacks could derail the recovery. One tracking site still describes the strait as effectively closed to commercial traffic. The $115 oil price suggests the market sees the risk as very much alive.
The price: forecasts keep chasing it

Forecasters have been revising upward all year. Brent averaged about $69 in 2025. In April, the World Bank projected an average of $86 for 2026, on the assumption that Hormuz shipping would return to near pre-war levels by October. It warned that damage to energy facilities could push the average as high as $115. A Reuters poll of analysts in September averaged about $89, with individual forecasts from $77 to $98. The IMF’s October outlook assumes $95.74 for 2026 and $87.39 for 2027.
Brent is now at the World Bank’s “more damage” number. Goldman Sachs has laid out the two paths: about $80 in the fourth quarter if the strait stays open and tensions ease, and above $120 if disruption continues.
Higher prices have a quieter side effect: people use less. The IEA’s October report projects global oil demand to fall by about 2.6 million barrels a day in 2026, with diesel accounting for roughly a quarter of the drop. Before the war, the agency had expected demand to grow. Even with a partial recovery of 2 million barrels a day in 2027, the IEA says consumption would still sit 0.6% below 2025. That is a bill paid in fewer flights, shorter trips and idled industrial plants rather than in dollars.
The bill: more than $330 billion in six months
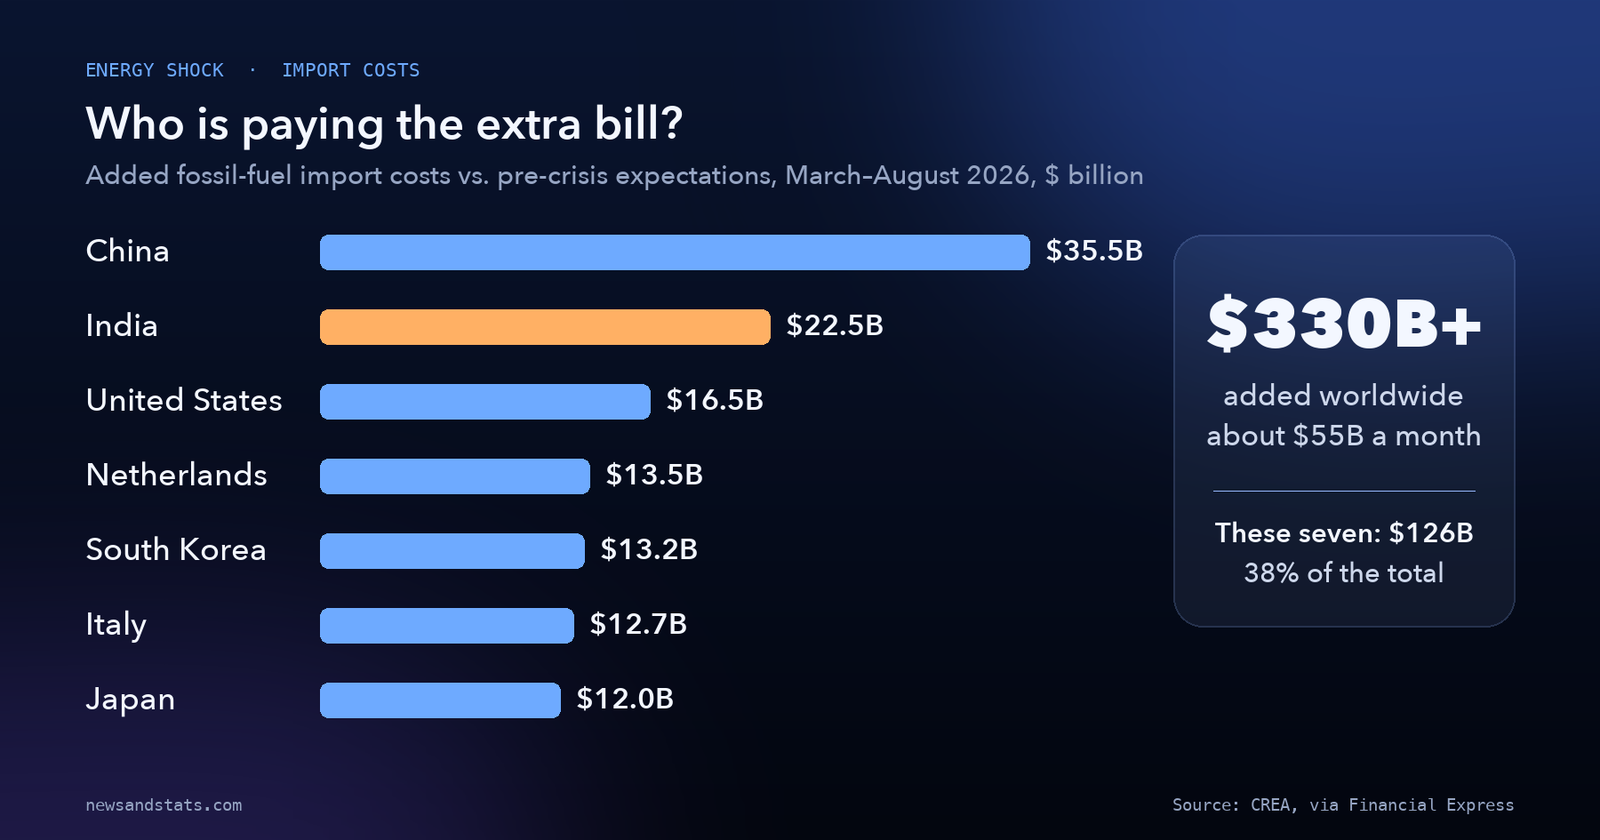
The Centre for Research on Energy and Clean Air (CREA) estimates that higher prices added more than $330 billion to the world’s fossil-fuel import costs between March and August, about $55 billion a month. Its breakdown shows where the money went:
| Fuel | Extra cost | How far prices rose above pre-crisis expectations |
|---|---|---|
| Crude oil | $164B | about 35% |
| Diesel and gasoil | $74B | 59% |
| Gasoline | $36B | 43% |
| Jet fuel | $20B | 59% |
| LNG | $38B | 60% (Atlantic), 75% (Pacific) |
Refined products rose by more than crude. That matters because diesel moves goods and powers farms and factories, so it feeds quickly into food and freight prices.
By country, China’s extra bill was the largest at $35.5 billion, followed by India ($22.5 billion), the United States ($16.5 billion), the Netherlands ($13.5 billion), South Korea ($13.2 billion), Italy ($12.7 billion) and Japan ($12 billion). Together those seven account for about $126 billion, or 38% of the total. The Netherlands’ high ranking likely reflects its role as a major European import and refining hub.
Dollar totals can mislead, because economies differ enormously in size. Using World Bank estimates of 2025 GDP, China’s $35.5 billion is about 0.18% of its $19.5 trillion economy. India’s $22.5 billion is about 0.57% of its $3.96 trillion economy. In relative terms, the six-month cost to India was roughly three times the burden on China. That is my own calculation from the two sources, and it compares six months of extra cost to a full year of output, so the real annual burden is larger if prices stay up.
Two things explain the gap. First, India imports more of its energy relative to its size: net energy imports were about 36% of energy use in 2024, against about 24% for China, according to the World Bank. Second, China has more room to switch to coal and to draw on stockpiles. The IEA notes that China accounted for 78% of the fall in non-OECD crude stocks in September.
Who has a buffer?
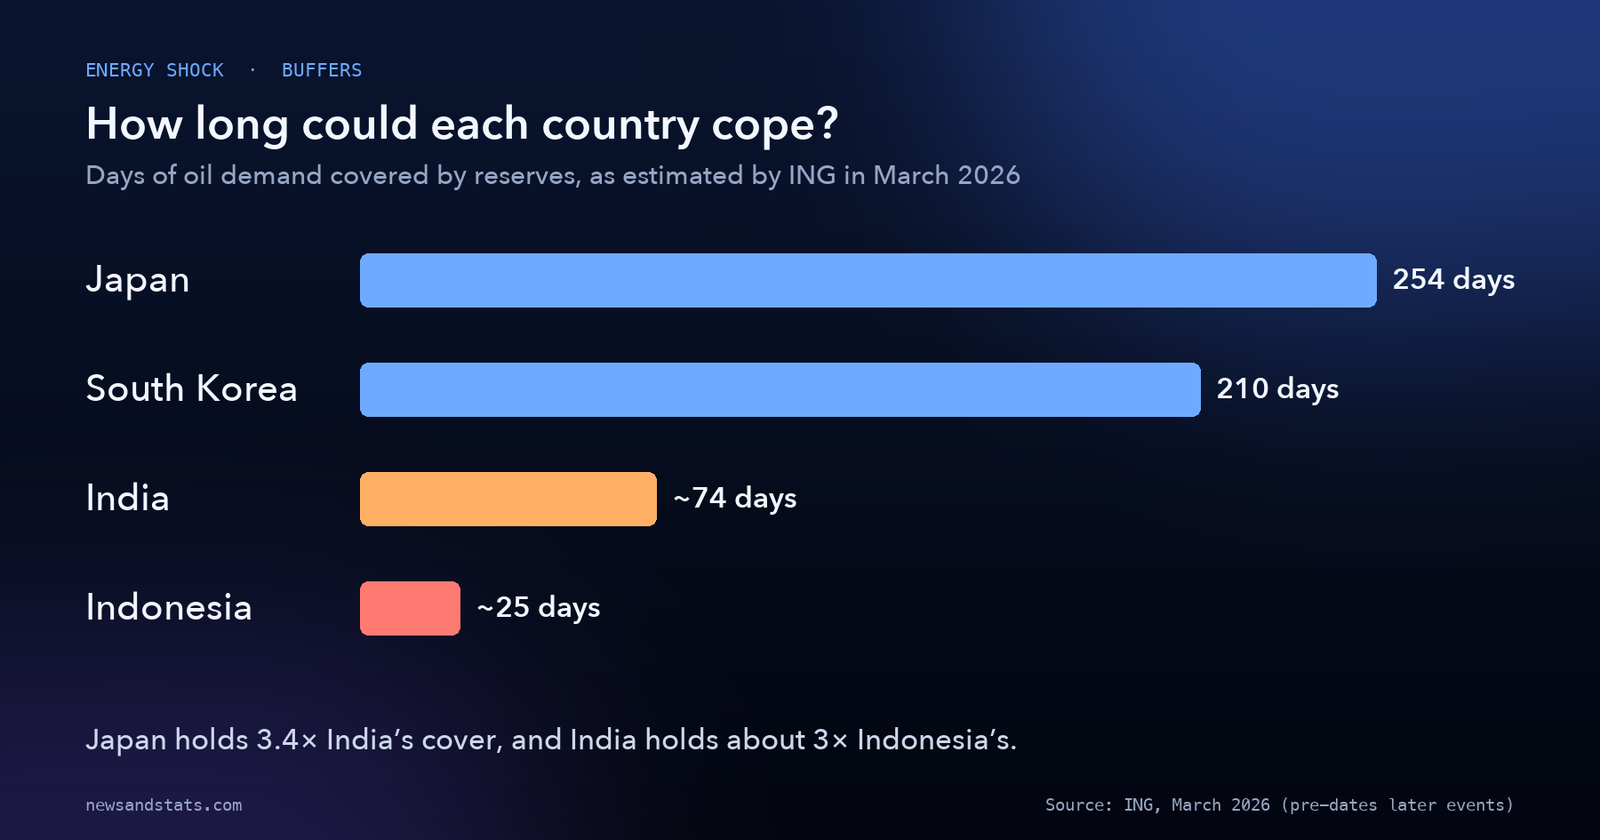
A price shock lands very differently depending on what a country has stored. ING’s March analysis of Asian economies put the starting positions in days of oil demand covered by reserves: Japan about 254, South Korea about 210, India about 74 and Indonesia about 25. The Philippines held close to two months of supply across refined products.
Other pressure points in the ING note:
- Thailand and South Korea have Asia’s largest oil and gas trade deficits, which makes them the most exposed to price spikes.
- India and the Philippines are the only major Asian economies with structural current-account deficits. ING forecast the Philippines’ deficit at about 4% of GDP in 2026, and estimated that a $15 rise in Brent could widen it by about 0.7% of GDP.
- Indonesia budgeted for $70 oil. ING cited officials’ “worst case” at $92. Brent now trades well above both.
- Pump prices in the Philippines had already risen 10% to 13% within weeks of the war starting.
Treat these as the starting line rather than the finish: the ING note dates from March, before most of the price rise and before the buffers had been drawn down. The IEA reports that global observed oil stocks are now about 509 million barrels below their end-February level. Inventories have been the shock absorber, and they are running down.
India: how an oil shock reaches the budget
India is a useful case study because the transmission is so visible. Its crude import bill rose about 60% year on year, to roughly $50 billion, in the April to June quarter, as the discounts that had cushioned its purchases disappeared, according to an analysis in WION.
The fiscal effect is where it gets expensive. An April paper from Ashoka University estimated that the shock could widen India’s fiscal deficit in 2026-27 from 4.30% to 4.49% of GDP in its main scenario, adding about 74,000 crore rupees. If the war lasts through December, it put the deficit at 4.99%. The main channels are fertilizer subsidies, cooking-gas (LPG) subsidies and revenue given up when the government cuts excise duty on petrol and diesel.
The conflict is still unresolved in late October, so the longer-war scenario deserves more weight now than it did in April.
Gas: the other half of the shock
Oil gets the headlines, but the LNG disruption has been just as geographically uneven. European gas jumped to about $16.7 per million BTU on 4 March, up 55% in under a week, after Qatar’s export plant shut. Asian LNG hit about $25.9 on 2 September, its highest since December 2022, as renewed hostilities hit Qatari cargo flows.
Goldman Sachs’s base case is for European gas around €70 per megawatt-hour, roughly $25 per million BTU, assuming Hormuz LNG flows gradually improve. Its risk case is €105 and $35 by year-end if Gulf LNG stays constrained through the winter. Goldman flagged about $30 as the level at which Indian industrial users would start cutting demand. China’s LNG imports have reportedly fallen about 25% from a year earlier.
The United States shows how much geography matters. US natural gas prices fell about 9% in the weeks after the war began, because limited export capacity insulates American buyers from the world market. Europe, with storage reported at only around 35% full in April, and Asia carry the exposure.
Food and fertilizer: the shock reaches the farm
Energy is an input to food, and the Gulf is a major source of fertilizer. Early in the crisis, the effective closure of the strait roughly doubled urea prices within weeks. The World Bank’s April outlook projected fertilizer prices up about 31% in 2026 and energy prices up 24%, the biggest energy jump in four years.
The UN’s food price index averaged 136.0 points in September, its highest since November 2022. The September rise was driven mainly by wheat and maize, and the FAO said uncertainty over Hormuz shipping continued to support prices through fuel, fertilizer and freight costs. One US benchmark urea price was around $440 a tonne in mid-September, about 12% above a year earlier. That suggests the first spike has faded there, even if it has not disappeared.
The longer-run risk is planting. The FAO has warned that farmers facing high fertilizer costs may plant less or switch to less intensive crops, which would cut supply well into 2027. Restarting a fertilizer plant after a shutdown usually takes five to eight weeks, and structural damage can take years to repair.
The poorest pay the most
The IMF’s October World Economic Outlook is blunt about who is hurt. It identifies low-income countries that import oil and sit outside the AI investment boom as the most vulnerable. IMF deputy research director Petya Koeva Brooks pointed out that their households spend a large share of income on energy and food, which makes the trade-offs harder. A given percentage rise in fuel and bread prices takes a much bigger bite when those two items make up most of the budget.
Many of these governments are also in or near debt distress, so they cannot easily borrow to cushion the blow. The IMF’s advice is that they may have to cut spending or restructure debt. For everyone else, it recommends narrow, temporary, targeted support for vulnerable households rather than broad fuel subsidies and price controls, which would strain public finances further. Emerging and developing economies are forecast to grow 3.7% in 2026, down from 4.5% in 2025, as reported from the October outlook. The fund projects global inflation of 4.7% this year.
Who is better off, and why the AI boom matters
IMF chief economist Pierre-Olivier Gourinchas has framed 2026 as two shocks at once: the war’s energy price rise is a negative supply shock, and the AI-driven surge in tech investment is a positive demand shock. Countries fare better if they export energy and are outside the conflict region, or if they are closely tied into the AI supply chain. Those that import energy and have little stake in the AI boom fare worse.
The IMF estimates that, without the workarounds economies have used (rerouting supply, drawing down inventories, switching fuels and using less), global growth would have been about 0.6 percentage points lower, around 2.5% instead of 3.1%. The warning is that those workarounds are reaching their limits.
What to watch
- Diplomacy versus escalation. Saudi Arabia’s defense minister has met Iranian leaders in Tehran, and Brent eased on hopes of de-escalation. At the same time, reports say the US president will soon choose between a deal and renewed military action, with strikes possible after the 3 November US midterms.
- Attacks on Saudi infrastructure. The Houthi strikes on airports, refineries and pipelines are a direct threat to supply outside Hormuz.
- Winter gas. Storage levels, the restart of Qatar’s Ras Laffan plant and Asian demand will set European and Asian prices.
- Inventories. Another monthly fall in global stocks would show the buffer thinning further.
- Fiscal stress. Subsidy bills and borrowing costs in importing countries, especially low-income ones, are where a price shock turns into a debt problem.
- Planting decisions. FAO updates will show whether fertilizer costs are reducing next season’s crops.
The bottom line
The 2026 energy shock is being paid for in three ways. Importers are paying in dollars, over $330 billion in six months, with India carrying a heavier burden relative to its economy than China. Everyone is paying in lower consumption, as oil demand falls for the first time in years. And the poorest countries are paying through food and fuel prices that eat most of a household budget, with little fiscal room to respond. The buffers that have held so far, inventories and rerouted supply, are the part that is running out.
Sources
- Trading Economics, Brent crude oil price page (26 October 2026)
- IEA, Oil Market Report, October 2026
- IMF, World Economic Outlook, October 2026, and blog by Silvana Tenreyro; press coverage of the IMF briefing in Bangkok
- CREA analysis of added fossil-fuel import costs, as reported by Financial Express and Free Press Journal (27 August 2026)
- ING, “Oil shock for Asia: identifying the first pressure points” (March 2026)
- World Bank, Commodity Markets Outlook (April 2026), and World Bank data on GDP and energy use
- Ashoka University, “Fiscal impact of the 2026 war in the Middle East on India” (April 2026); WION analysis of India’s crude import bill
- Kpler, S&P Global Platts and Goldman Sachs commentary on gas prices; FAO Food Price Index (September 2026)