International migration has become one of the most powerful financial equalizers in the world economy. According to the World Bank in its report Remittances Slowed in 2023, Expected to Grow Faster in 2024, officially recorded remittance flows to low- and middle-income countries (LMICs) reached an estimated $656 billion.
These cross-border transfers—sent home dollar by dollar by millions of overseas workers—represent a financial flow equivalent to the entire gross domestic product of Belgium. Unlike corporate foreign investment, which fluctuates with global equity cycles, remittances flow directly into household bank accounts, financing food security, healthcare, primary education, and housing across vulnerable communities. Yet behind this staggering capital transfer lies an enduring market inefficiency: high transfer fees siphon billions of dollars away from migrant families every year. Here are the eight numbers from the World Bank’s Migration and Development Brief that explain how global remittance flows operate, who benefits most, and why transfer costs remain persistently elevated.
1. $656 billion: The financial lifeline of the developing world
The headline volume of global remittances demonstrates their structural significance in international finance. In the World Bank’s latest assessment, officially recorded remittance flows to low- and middle-income countries reached $656 billion.
While the annual growth rate moderated to 0.7% following a period of rapid post-pandemic expansion, remittances remained an indispensable macroeconomic stabilizer. In more than 60 countries, remittances account for 3% or more of national GDP, insulating domestic banking systems from external shocks.
The analytical context of these diaspora flows is documented by the World Bank’s global initiative on Remittances & Migration under the Global Knowledge Partnership on Migration and Development (KNOMAD). Across dozens of emerging markets, remittance inflows represent the single largest source of foreign exchange earnings. As examined in our comparison of the economic gap between India and China, diaspora capital provides sovereign balance-of-payments support that allows emerging economies to finance domestic infrastructure build-outs while maintaining stable currency reserves.
2. Surpassing FDI and ODA: Remittances exceed investment and foreign aid combined
The most remarkable development in modern development finance is the structural displacement of traditional capital flows. The World Bank reports that in 2023 and 2024, remittance flows to low- and middle-income countries surpassed foreign direct investment (FDI) and official development assistance (ODA).
Foreign direct investment—capital deployed by multinational corporations to build factories, acquire local companies, or develop infrastructure—contracted as elevated global interest rates curtailed corporate risk appetites. Official development assistance, which encompasses bilateral and multilateral government foreign aid budgets, has stagnated under fiscal pressure across Western donor nations.
Remittances, by contrast, proved counter-cyclical and resilient. When recipient countries confront economic distress, currency devaluations, or natural disasters, overseas workers increase the frequency and volume of their transfers to support extended families. For economies managing fossil fuel import price shocks, steady remittance inflows bolster sovereign current accounts, helping governments avoid balance-of-payments crises.
3. $120 billion: India solidifies its position as the top recipient
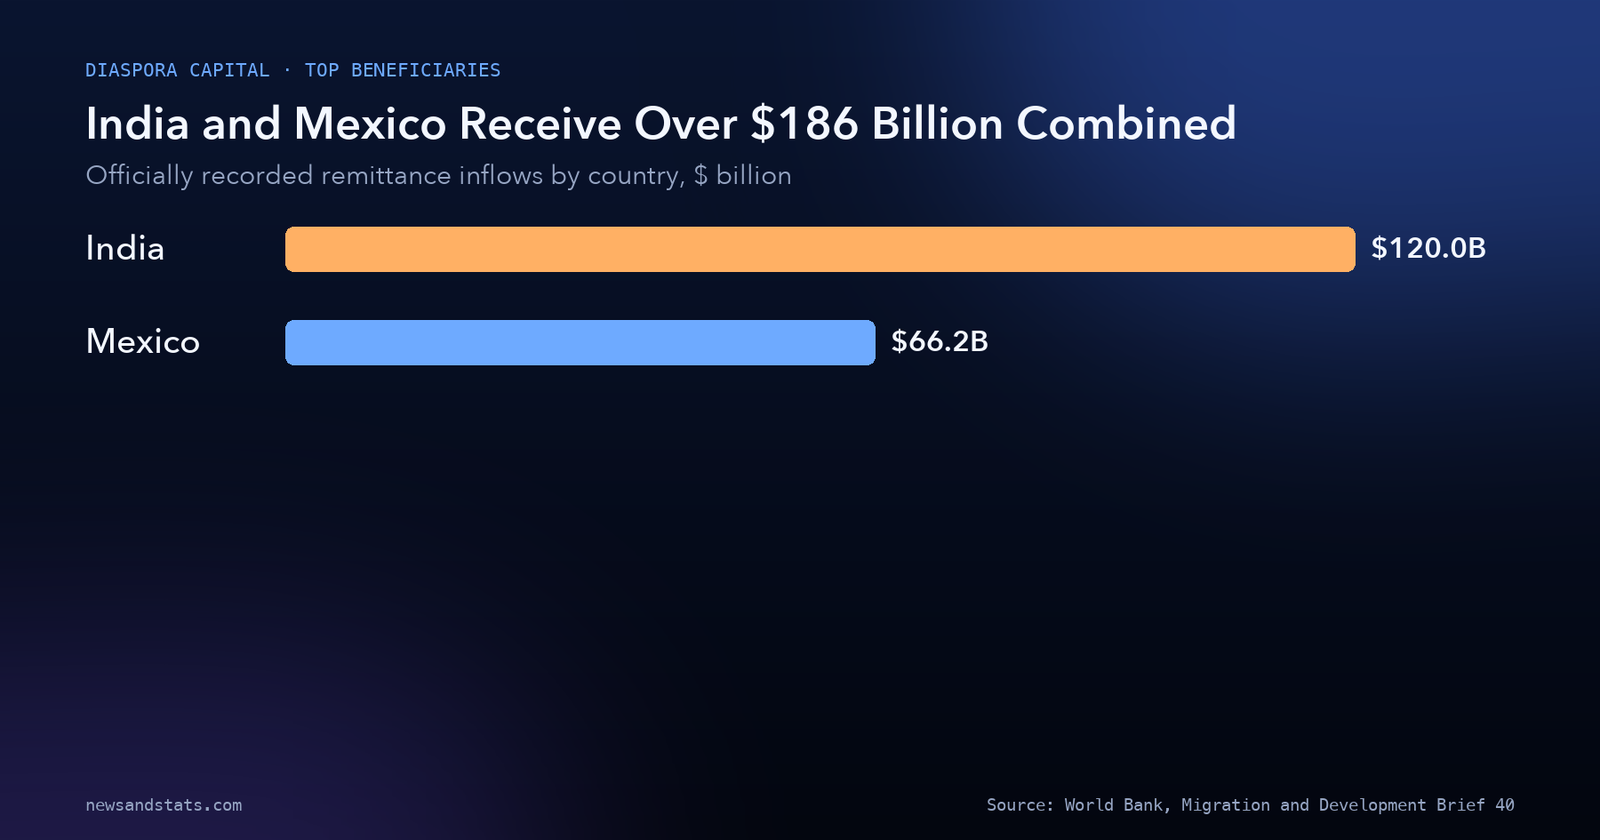
On a national level, remittance receipts are led by the world’s most populous nation. India received $120 billion in officially recorded remittances, marking a 7.5% increase year-on-year.
India’s remittance dominance reflects a structural shift in its diaspora employment profile. Historically, Indian remittance inflows were dominated by low-skilled and semi-skilled blue-collar workers in the Gulf Cooperation Council (GCC) nations. Over the past decade, however, remittance sources have shifted toward high-skilled technology, medical, and financial professionals residing in the United States, the United Kingdom, and the European Union.
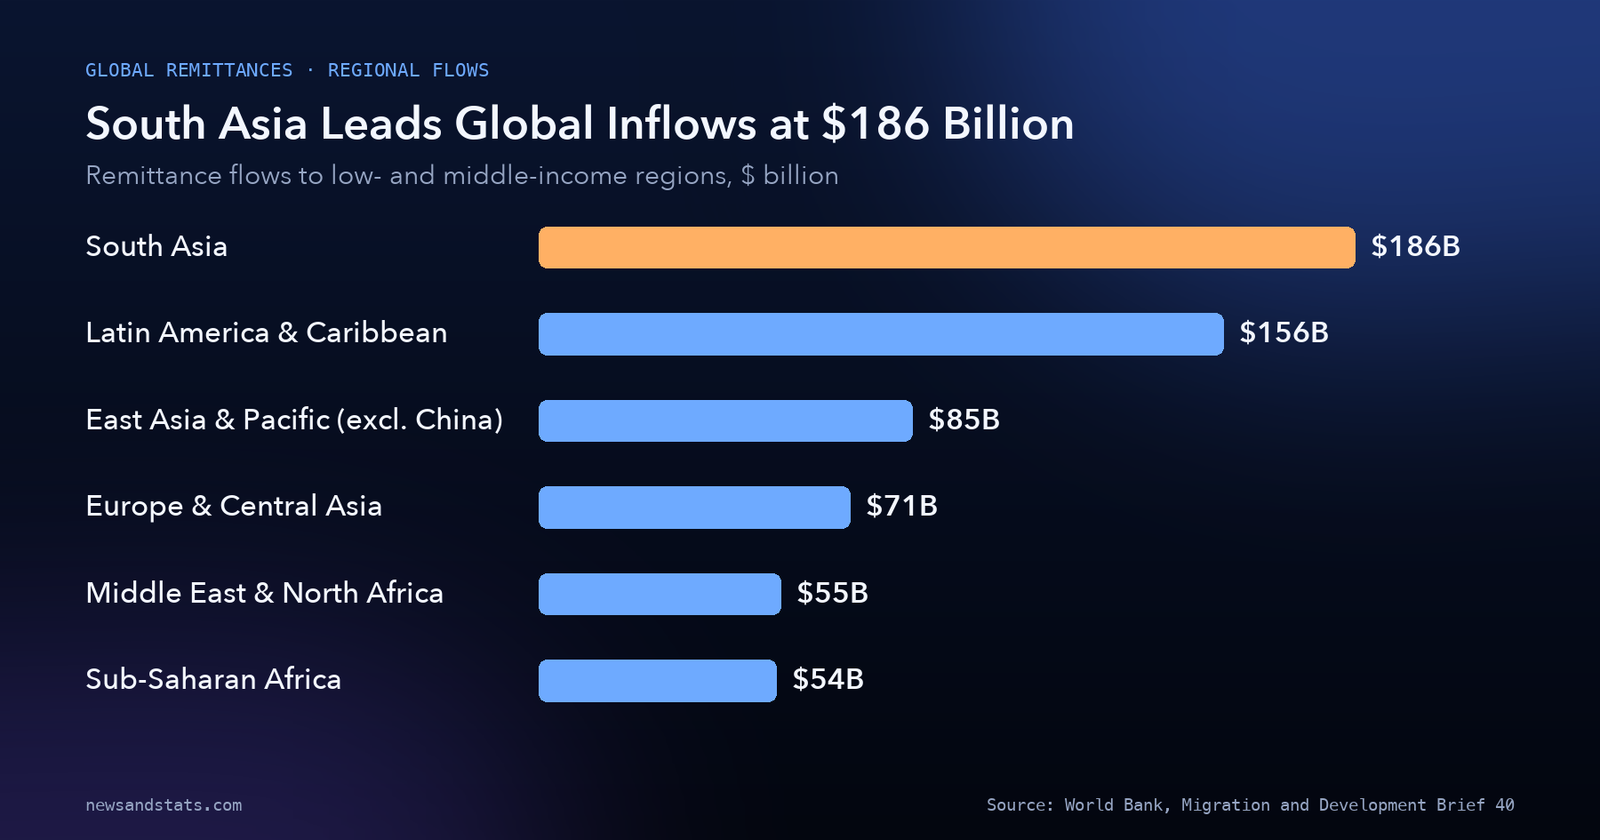
Our calculation: India’s $120 billion in inflows accounted for 64.5% of all remittances received across the entire South Asian region ($186 billion total). Resilient labor markets and wage growth in North America provided a steady foundation for transfer growth, offsetting softer economic activity across the Middle East.
Source: World Bank, Migration and Development Brief 40.
The influx of capital from skilled overseas professionals is closely intertwined with advanced manufacturing and semiconductor supply chains, as returning diaspora capital and tech-sector savings finance venture development and commercial real estate across Tier-1 and Tier-2 Indian cities.
4. $66.2 billion: Mexico powers Latin America’s remittance surge
Mexico retained its position as the second-largest remittance recipient in the world and the undisputed leader in Latin America, receiving $66.2 billion in officially recorded transfers, a 7.8% increase year-on-year.
Mexico’s remittance boom is tightly linked to the United States labor market. Sustained employment demand in US construction, hospitality, wholesale distribution, and agriculture enabled Mexican migrant workers to remit record sums. Inflows to Mexico accounted for 42.4% of all remittance receipts across Latin America and the Caribbean, which reached $156 billion in total.
Our calculation: combined, India ($120.0 billion) and Mexico ($66.2 billion) received $186.2 billion, representing 28.4%—more than one-quarter—of all remittances sent to developing nations worldwide.
However, remittance growth across Latin America exhibited extreme intra-regional divergence. While Nicaragua experienced a dramatic 44.5% surge in remittance receipts driven by increased outward migration, Argentina recorded a 13.4% decline as severe domestic inflation and currency controls disrupted formal banking channels.
5. 41% of GDP: The extreme dependency of small island states
While large nations absorb the greatest absolute dollar volumes, small island developing states and fragile economies exhibit the highest economic vulnerability to remittance fluctuations.
Tonga ranked as the most remittance-dependent nation in the world, with officially recorded remittances amounting to 41% of its entire gross domestic product. In the Pacific Islands, transfers from seasonal and permanent diaspora workers in New Zealand and Australia provide the primary source of household income.
Across East Asia and the Pacific (excluding China), remittance flows reached $85 billion, expanding by 4.8%. In economies like Samoa, Vanuatu, and Palau, remittances represent the financial bedrock that funds basic imports of food, medical supplies, and petroleum.
Source: World Bank, Migration and Development Brief 40.
In Sub-Saharan Africa, where regional inflows totaled $54 billion, countries like The Gambia, Lesotho, Comoros, and Liberia rely heavily on remittances to buffer against domestic drought, localized food insecurity, and debt-servicing burdens. This dependence highlights the intersection between financial flows and physical infrastructure; as examined in our coverage of power grid bottlenecks and infrastructure constraints, developing economies with high remittance ratios often channel diaspora capital into off-grid solar and decentralized utility systems to bypass fragile national grids.
6. 6.4%: Transfer fees double the United Nations target
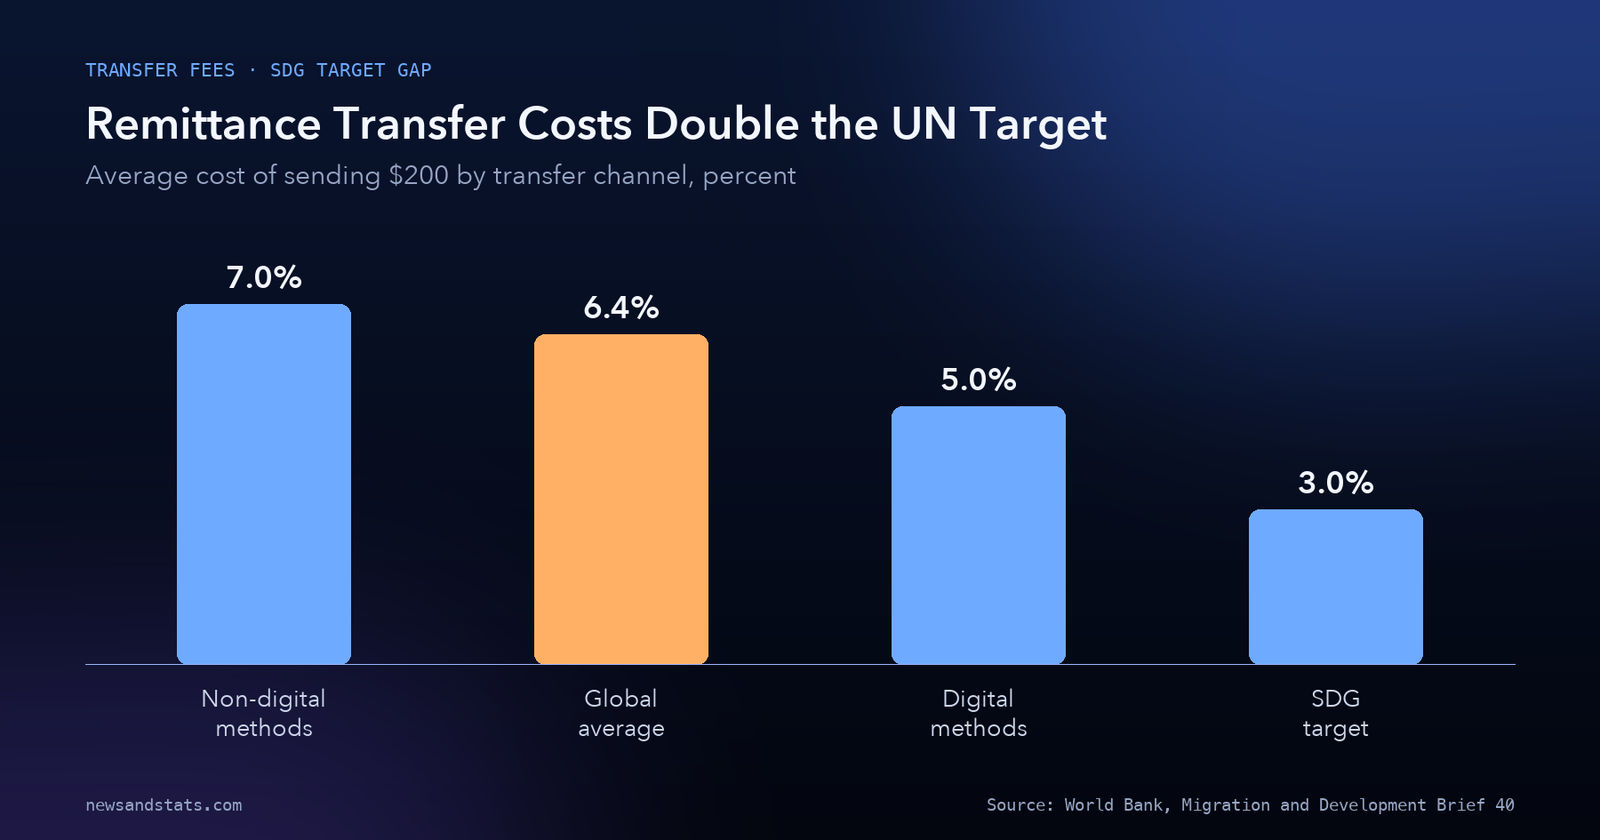
Despite technological innovation and the proliferation of mobile banking apps, transferring money across international borders remains exorbitantly expensive. In the fourth quarter of 2023, the global average cost of sending a standard $200 remittance stood at 6.4% of the transfer amount, up slightly from 6.2% a year earlier.
Our calculation: a 6.4% fee on a $200 transfer costs migrant workers an average of $12.80 per transaction. On $656 billion in total transfers to developing nations, an average fee of 6.4% means approximately $42 billion is consumed annually by transaction costs, foreign exchange markups, and intermediary banking charges.
Source: World Bank, Migration and Development Brief 40.
Under United Nations Sustainable Development Goal (SDG) 10.c, international governments pledged to reduce the average transaction cost of migrant remittances to less than 3% by 2030. At 6.4%, the actual global average cost is more than double the SDG target.
The persistence of high fees is driven by legacy correspondent banking networks, exclusive partnership contracts between retail postal systems and money transfer operators, and stringent anti-money laundering (AML) compliance mandates that have caused commercial banks to de-risk and close transfer accounts. For central banks managing balance-of-payments stability, as analyzed in our review of central bank official reserve management, reducing friction in formal payment rails is essential to prevent capital from diverting into unrecorded parallel markets.
7. 5% vs 7%: The digital remittance cost advantage
The World Bank’s data demonstrates that digital technology provides a direct pathway to reducing transfer costs. Globally, digital remittance channels averaged a fee of 5.0% for sending $200, compared with 7.0% for traditional non-digital cash-over-the-counter methods.
Our calculation: digital remittance services provide a 2.0 percentage point cost reduction, making them 28.6% cheaper on average than traditional agent-based cash services.
Non-digital remittances require maintaining physical storefronts, commercial agent commissions, physical cash armored transport, and manual paper compliance, all of which drive up retail overhead. Digital transfers—conducted via mobile wallets, bank-to-bank account transfers, and fintech payment apps—bypass cash handling and automate identity verification.
However, achieving the full digital dividend requires reciprocal infrastructure. While migrant workers in host nations increasingly hold smartphones and debit accounts, recipients in rural origin communities often lack digital payment integration, forcing families to incur secondary cash-out fees at local merchant kiosks.
8. 7.9%: Sub-Saharan Africa remains the costliest corridor
Geographic disparities in remittance pricing are acute. Sub-Saharan Africa remains the most expensive region in the world to send money to, with transfer fees averaging 7.9% for a $200 remittance.
Sending money to Africa costs 23.4% more than the global average of 6.4%, and is more than two and a half times the UN SDG target of 3.0%. In specific bilateral corridors—particularly inter-African corridors and transfers to small Pacific Island nations—fees reach extraordinary peaks. In the most expensive corridor in the East Asia and Pacific region, sending $200 costs an exorbitant 17.1% (or $34.20 per transfer).
By comparison, transfer costs to South Asia averaged 5.8%, costs to East Asia and Pacific averaged 5.8%, costs to the Middle East and North Africa averaged 5.9%, and costs to Latin America and the Caribbean averaged 5.9%.
In Europe and Central Asia, remittance flows fell 10.3% to $71 billion, primarily due to shrinking transfer volumes from Russia following international financial sanctions and currency volatility. Meanwhile, remittance flows to the Middle East and North Africa fell 15% to $55 billion, driven by a sharp contraction in formal transfers to Egypt, where a parallel foreign exchange market temporarily diverted flows into unofficial cash networks until official exchange rates were unified in March 2024.
How to read the World Bank remittance numbers
Interpreting international migration and remittance datasets requires understanding five essential statistical nuances:
- Officially recorded flows exclude informal transfers. The World Bank’s $656 billion figure captures transactions conducted through commercial banks, registered money transfer operators, and regulated digital platforms. It does not capture informal transfers, such as cash carried across borders by hand or informal hawala networks, which researchers estimate could add substantially to actual capital movements.
- Remittances are private transfers, not public revenues. Unlike foreign aid (ODA) or sovereign loans, remittances flow directly into private household budgets. Governments do not control their allocation, though they benefit indirectly through foreign currency reserves and domestic consumption taxes.
- The $200 benchmark is a standardized pricing index. Remittance prices are tracked using a standardized $200 transfer to enable comparison across thousands of bilateral country corridors. Percentage fees are typically regressive, meaning smaller transfer amounts carry significantly higher percentage costs.
- Exchange rate divergence distorts formal accounts. When recipient countries maintain an overvalued official exchange rate alongside an active black market (as occurred in Egypt and Nigeria), formal banking transfers collapse as migrants switch to informal channels, creating an artificial dip in official statistics.
- Diaspora skill profiles dictate economic stability. Remittances from high-skilled tech and medical workers in North America and Europe exhibit greater secular growth, whereas remittances from low-skilled construction workers in the Gulf are highly sensitive to crude oil prices and host-country government spending.
The global remittance landscape at a glance
The following table summarizes the primary metrics established in the World Bank’s Migration and Development Brief 40 across regional flows, top recipient nations, transfer fee benchmarks, and global migration demographics.
| Metric | Measured value | Reporting period | Key economic or demographic driver | Source |
|---|---|---|---|---|
| Officially recorded LMIC remittances | $656 billion | Calendar 2023 | Moderated to 0.7% growth; equals Belgium GDP | World Bank Migration Brief |
| LMIC remittance growth forecast 2024 | 2.3% projected growth | 2024 outlook | Uneven recovery across regional corridors | World Bank Migration Brief |
| South Asia regional remittance inflows | $186 billion | Calendar 2023 | Expanded 5.2%; driven by Indian diaspora | World Bank Migration Brief |
| India national remittance inflows | $120 billion | Calendar 2023 | Up 7.5%; world’s top recipient nation | World Bank Migration Brief |
| Latin America & Caribbean inflows | $156 billion | Calendar 2023 | Grew 7.7%; powered by US employment | World Bank Migration Brief |
| Mexico national remittance inflows | $66.2 billion | Calendar 2023 | Up 7.8%; top recipient in Latin America | World Bank Migration Brief |
| East Asia & Pacific inflows (excl. China) | $85 billion | Calendar 2023 | Grew 4.8%; vital for Pacific island nations | World Bank Migration Brief |
| Europe & Central Asia remittance inflows | $71 billion | Calendar 2023 | Fell 10.3%; reduced transfers from Russia | World Bank Migration Brief |
| Middle East & North Africa inflows | $55 billion | Calendar 2023 | Fell 15%; currency divergence in Egypt | World Bank Migration Brief |
| Sub-Saharan Africa remittance inflows | $54 billion | Calendar 2023 | Slight 0.3% decline; critical for fragile states | World Bank Migration Brief |
| Tonga national remittance share of GDP | 41% of GDP | Calendar 2023 | Highest remittance dependency in the world | World Bank Migration Brief |
| Global average cost to send $200 | 6.4% of transfer | Q4 2023 | Up from 6.2%; double the 3% SDG target | World Bank Migration Brief |
| Digital remittance transfer fee | 5.0% of transfer | Q4 2023 | 2 percentage points cheaper than cash | World Bank Migration Brief |
| Non-digital remittance transfer fee | 7.0% of transfer | Q4 2023 | Burdened by agent and physical cash overhead | World Bank Migration Brief |
| Sub-Saharan Africa average transfer fee | 7.9% of transfer | Q4 2023 | Costliest geographic region in the world | World Bank Migration Brief |
| Most expensive regional corridor fee | 17.1% of transfer | Q4 2023 | Peak cost in East Asia and Pacific corridor | World Bank Migration Brief |
| Global population of international migrants | 184 million people | WDR 2023 benchmark | Demographic imbalances and opportunity gaps | World Bank KNOMAD Brief |
Source: World Bank, Migration and Development Brief 40.
What to watch
- Whether officially recorded remittance flows to developing countries achieve the World Bank’s forecast of 2.3% growth in 2024.
- Progress toward the United Nations Sustainable Development Goal 10.c, observing whether digital competition can compress the 6.4% global average fee toward 3%.
- Inflow trajectories in Egypt following the March 2024 exchange rate unification, tracking how quickly remittances return to formal banking channels.
- United States labor market dynamics, assessing whether softening construction or services employment dampens remittance growth to Mexico and Central America.
- Recommendations from the International Working Group to Improve Data on Remittance Flows (RemitStat) on capturing informal cross-border cash transfers.
- The expansion of central bank digital payment linkages (such as India’s UPI cross-border integration with Singapore and the UAE) in lowering transaction costs.
The bottom line
Global remittances represent the primary financial bridge between advanced economies and the developing world: officially recorded flows reached $656 billion, surpassing foreign direct investment and foreign aid combined to provide household-level stability across more than 60 nations. India and Mexico anchor this capital network, absorbing $120 billion and $66.2 billion respectively. Yet with transfer fees averaging 6.4%—and reaching 7.9% in Sub-Saharan Africa—financial friction consumes over $40 billion annually from migrant workers. Accelerating the transition to digital transfer rails, which average 5.0%, is the single most actionable lever to unlock development capital for emerging economies. For broader macroeconomic analysis framing these flows, explore our review of the macroeconomic environment from the IMF, and visit our World in Numbers section for continuing coverage of global development finance.
Related reading
- India vs China: the economic gap in 10 numbers: demographics, manufacturing output, and economic growth compared.
- Who pays for the 2026 energy shock? The numbers, country by country: fiscal vulnerability and energy import exposure across developing economies.
- The world economy in 8 numbers: what the IMF’s October 2026 outlook says: global GDP growth, inflation, and sovereign fiscal risks.