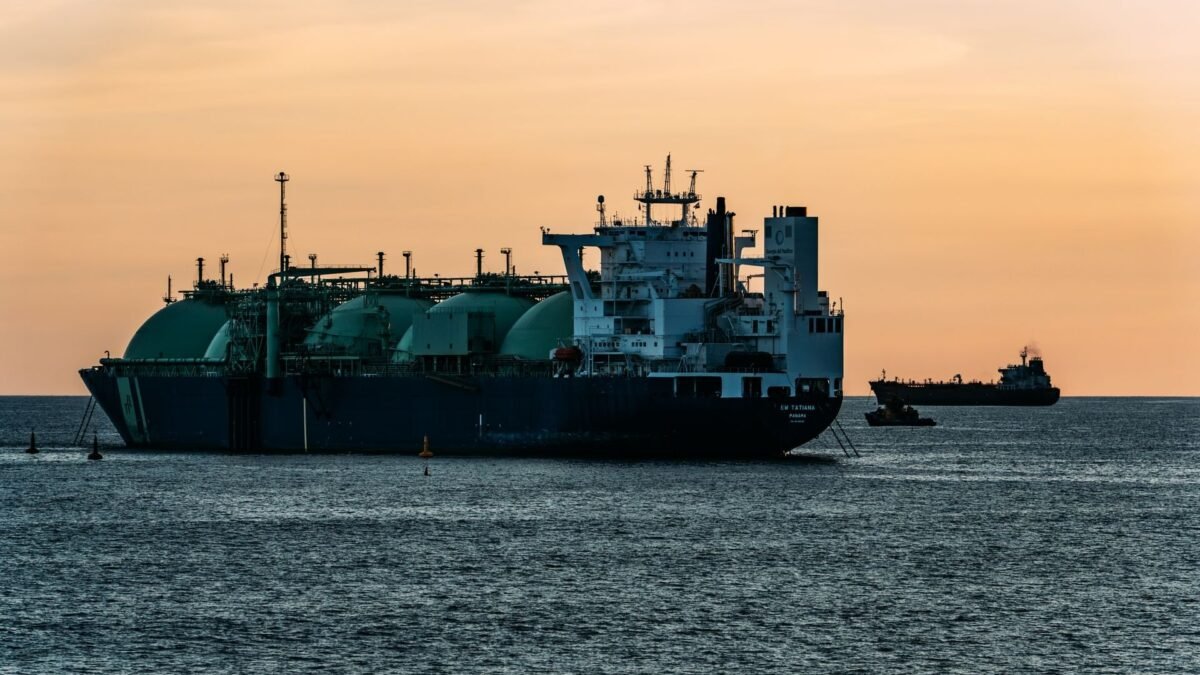
The International Energy Agency (IEA) counts more than 430 billion cubic meters a year (bcm/yr) of new liquefied natural gas (LNG) export capacity that has reached a final investment decision since 2019, and more than 330 bcm/yr that is under construction and set to come online by 2030. The IEA says the easing effect of that supply wave on gas markets is now set to be delayed. The reason is the 2026 Middle East conflict: the Strait of Hormuz had accounted for almost 20% of global LNG supply before the disruption, and attacks on Qatar’s Ras Laffan facility in March delayed Qatar’s North Field East expansion.
This post separates three things that are easy to blur: capacity approved, capacity under construction, and supply actually delivered. All figures come from the IEA’s capacity tracker, the IEA’s gas market report and the US Energy Information Administration (EIA). Where we make our own calculation, we say so.
1. More than 430 bcm/yr: the size of the buildout
The IEA’s Global LNG Capacity Tracker, whose status is stated as of 1 October 2026, reports that more than 430 bcm/yr of LNG export capacity reached a final investment decision (FID) between 2019 and October 2026, an average of over 55 bcm/yr each year. The tracker records the year of each project’s FID or approval and measures each project by its nameplate liquefaction capacity in bcm/yr.
The approvals came in bursts. In 2019, close to 100 bcm/yr reached FID, more than 85% of it in the United States. The IEA describes 2025 as a near-record year, matching the 2019 peak. In 2026, from January to October, four FIDs totaling nearly 46 bcm/yr were taken: CP2 LNG Phase 2, Commonwealth LNG, Delfin LNG and LNG Canada Phase 2.
The tracker lists capacity in two units. For North Field East, it gives 43.5 bcm/yr and 32.0 million tonnes a year (mtpa). Our calculation: 43.5 divided by 32.0 is about 1.36, so one mtpa corresponds to about 1.36 bcm/yr. Golden Pass LNG’s 21.2 bcm/yr and 15.6 mtpa give the same ratio.
2. Who is building: the United States and Qatar
Two suppliers account for most of the approvals. The IEA’s tracker puts the United States at nearly 55% of the capacity that reached FID since 2019, calling it the dominant driver. Qatar comes second at around 15%, which the tracker describes as a distant second. The remaining roughly 30% is spread across more than a dozen suppliers in several regions.
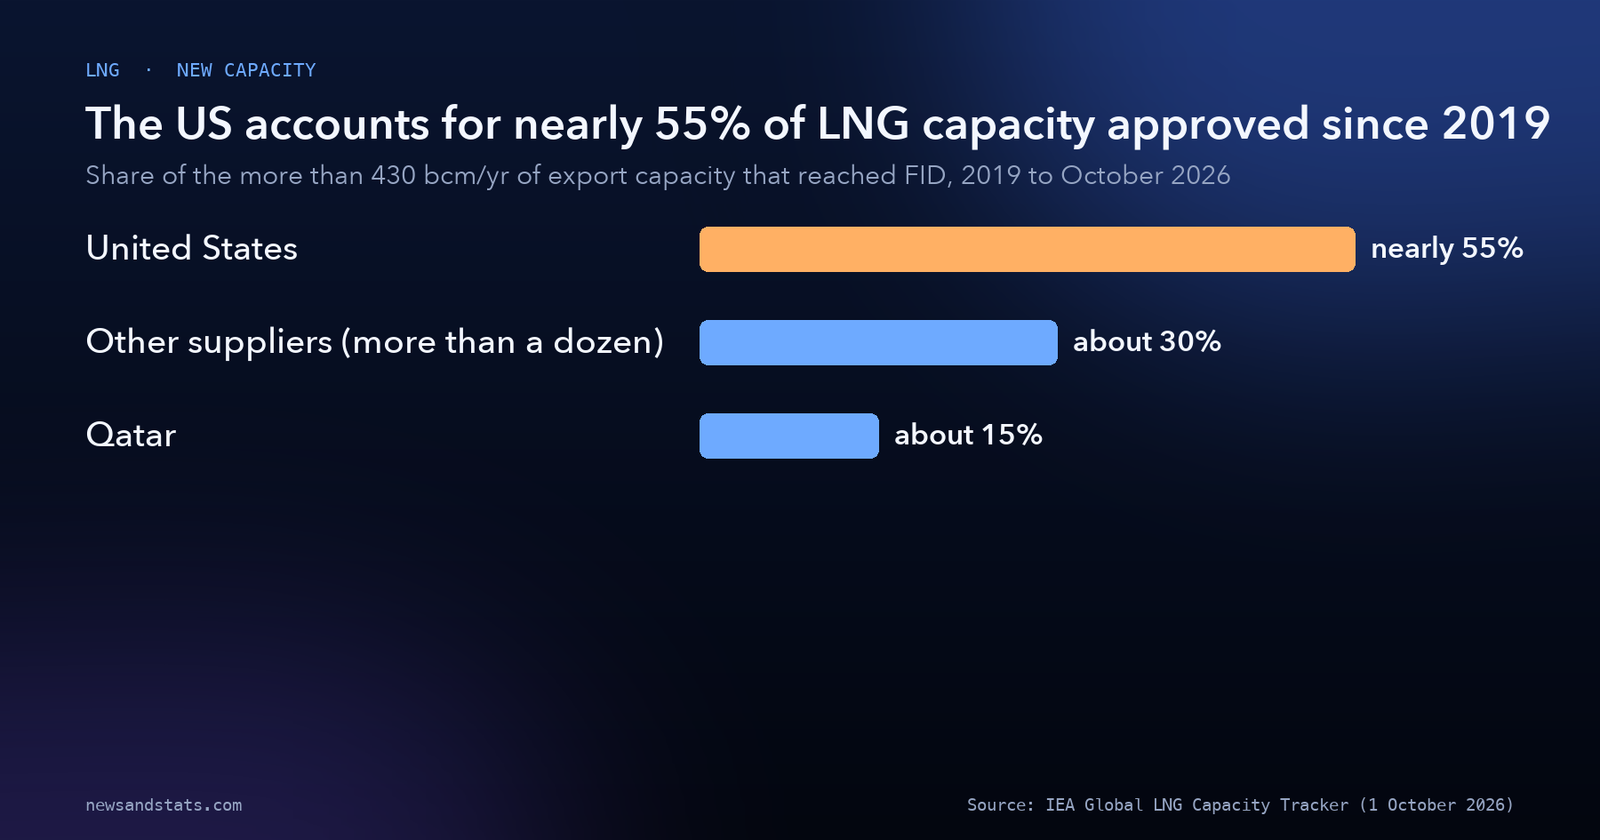
Source: IEA, Global LNG Capacity Tracker (status 1 October 2026).
3. More than 330 bcm/yr under construction, peaking in 2028
Approval is not delivery. The tracker says more than 330 bcm/yr of capacity is set to come online between 2025 and 2030. That figure covers projects under construction as of 2025 and excludes Arctic LNG 2 and North Field West. The IEA’s chart of annual additions rises from about 30 bcm/yr in 2025 to a peak of about 90 bcm/yr in 2028, then declines in 2029 and 2030.
The tracker’s project table gives expected first-LNG years. A selection for 2026 to 2028:
| Expected first LNG | Project (country) | Capacity (bcm/yr) | Capacity (mtpa) |
|---|---|---|---|
| 2026 | Golden Pass LNG (US) | 21.2 | 15.6 |
| 2026 | Pluto LNG, Train 2 (Australia) | 6.8 | 5.0 |
| 2026 | ECA LNG, Phase 1 (Mexico) | 4.4 | 3.3 |
| 2027 | Rio Grande LNG, Trains 1 to 3 (US) | 23.9 | 17.6 |
| 2027 | CP2 LNG, Phase 1 (US) | 19.6 | 14.4 |
| 2027 | Port Arthur LNG, Phase 1 (US) | 18.4 | 13.5 |
| 2027 | NLNG, Train 7 (Nigeria) | 10.3 | 7.6 |
| 2028 | North Field South (Qatar) | 21.8 | 16.0 |
| 2028 | Ruwais LNG (UAE) | 13.0 | 9.6 |
| 2028 | Corpus Christi Midscale Trains 8 and 9 (US) | 6.8 | 5.0 |
Source: IEA, Global LNG Capacity Tracker, project table, status 1 October 2026. A selection of projects, not the full list.
The expected years are the tracker’s status as of 1 October 2026. Two of the projects in this selection, North Field South and Ruwais LNG, are in the Gulf region.
4. Qatar: the 43.5 bcm/yr expansion that slipped
The tracker lists Qatar’s North Field East expansion at 43.5 bcm/yr, under construction but delayed, with an FID in 2021. It says construction has been disrupted following military attacks on the Ras Laffan facility in March 2026. The first of the project’s four trains, previously due at the end of 2026, is now delayed until at least the first half of 2027. QatarEnergy said in March 2026 that the start-up could slip by more than a year, depending on how long the conflict lasts.
Two other Qatari projects sit in different positions. North Field South, at 21.8 bcm/yr, is listed for 2028 and is under construction. North Field West, at 21.7 bcm/yr, was approved in 2024 but is not under construction and has no announced FID, which is why the IEA excludes it from the 330 bcm/yr total.
Our calculation: North Field East’s 43.5 bcm/yr is no more than about 13% of the 330 bcm/yr under construction (43.5 divided by 330 is 13.2%, and 330 is a floor, so the share is somewhat lower). The delay matters, but it does not by itself remove the wave. Our reading: the larger 2026 effect, as the next section shows, is on supply that was already flowing.
5. Almost 20%: what the Gulf outage removed
The IEA’s Gas Market Report Q3-2026 quantifies the loss. It says the Strait of Hormuz had accounted for almost 20% of global LNG supply before the disruption. It forecasts that Qatar and UAE LNG supply will fall about 45% in 2026, or 54 bcm. From March to June, LNG loadings from Qatar and the UAE were 35 bcm lower than a year earlier. The IEA estimates cumulative LNG supply losses for 2026 to 2030 at 140 bcm, equal to 15% of the new LNG supply added globally over that period.
Other suppliers made up much of the gap. Non-Gulf LNG output grew almost 18% (about 27 bcm) from March to June, offsetting around three-quarters of the Gulf decline. For 2026 as a whole, new projects in North America, Africa and Australia are expected to add close to 50 bcm of supply, and legacy projects more than 10 bcm.
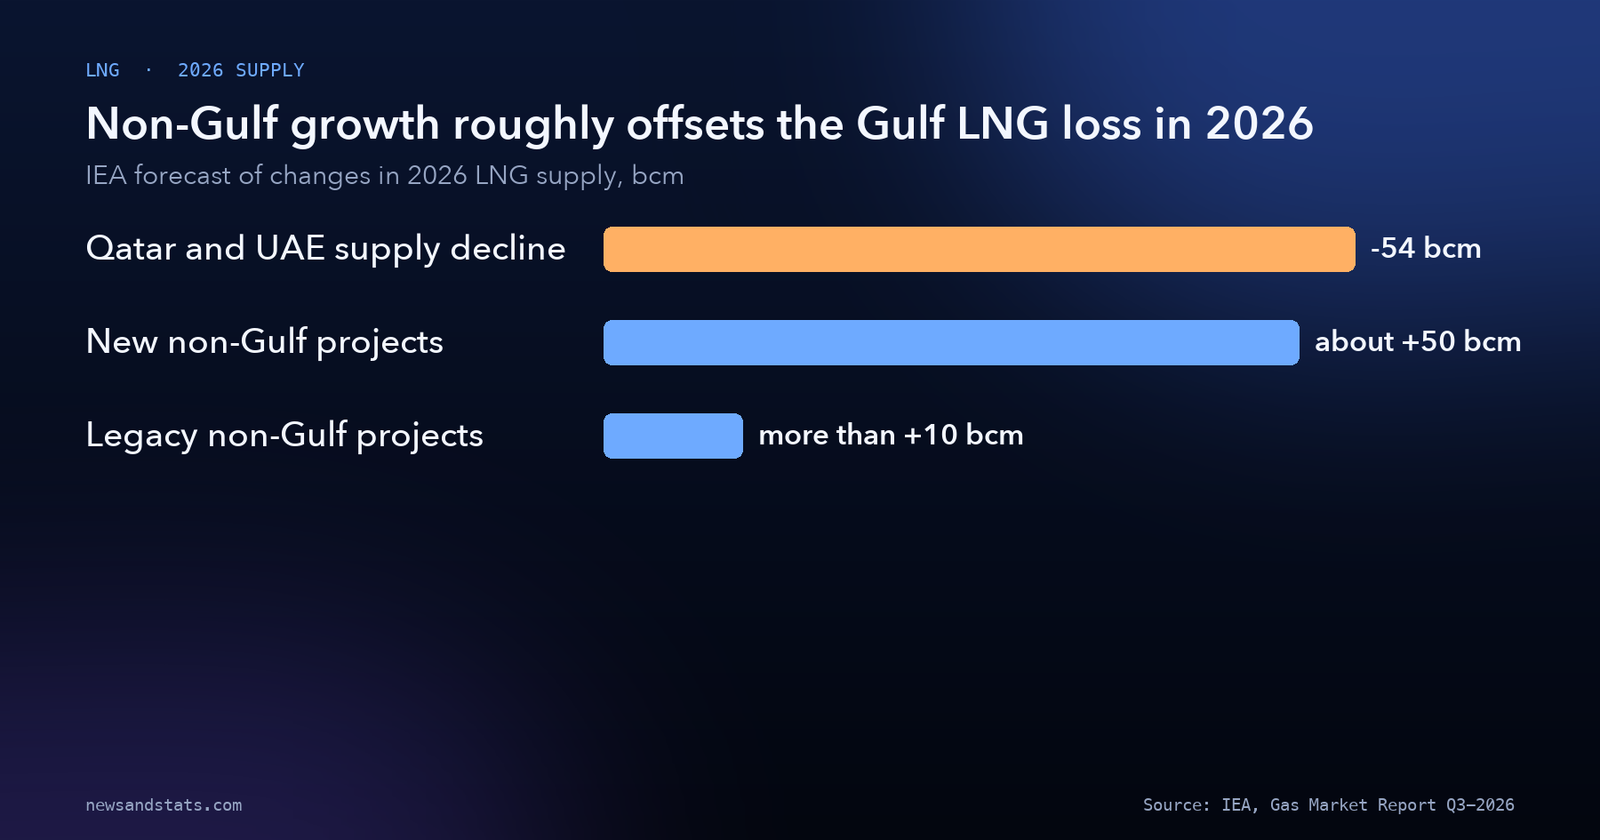
Source: IEA, Gas Market Report Q3-2026.
Our calculations: the March-to-June non-Gulf gain of 27 bcm against the Gulf loss of 35 bcm is about 77%, consistent with the IEA’s “around three-quarters”. For the full year, close to 50 plus more than 10 is roughly 60 bcm of non-Gulf additions against a 54 bcm Gulf decline.
That arithmetic explains the IEA’s headline forecast: global LNG supply stays broadly flat in 2026. Global LNG production fell 4% (8 bcm) from a year earlier from March to June. The agency warns that delays in restoring Gulf exports could tip the market into its first annual decline in supply since 2012.
On the flows themselves, the IEA’s July report says LNG flows through the Strait of Hormuz have risen since an interim peace agreement in June, but “they remain well below pre-conflict levels.” It adds that the timeline for a full resumption of traffic is subject to significant uncertainty. We covered the wider costs for importers in our post on the energy shock.
6. Prices: off the March highs, still above 2025
The IEA reports that spot prices in Asia and Europe reached their highest monthly averages since January 2023 in March. In the second quarter of 2026, the European benchmark TTF averaged near $16 per MMBtu, up 32% on a year earlier, its highest second-quarter average since 2022. Asia’s benchmark JKM averaged $17.5, up 45%. From March to June, JKM carried an average premium of $2.1 over TTF.
Prices then eased. Between 15 and 26 June, after the interim US-Iran agreement, TTF fell 6% and JKM fell 12%. The IEA’s summary is that prices in Asia and Europe have moderated from their March highs but remain well above 2025 levels.
The EIA expects US gas prices to be little changed. Its October 2026 Short-Term Energy Outlook puts the Henry Hub spot price at $3.53 per MMBtu on average in 2025 and forecasts $3.48 in 2026, then $3.16 in 2027, a 9% decrease from 2026.
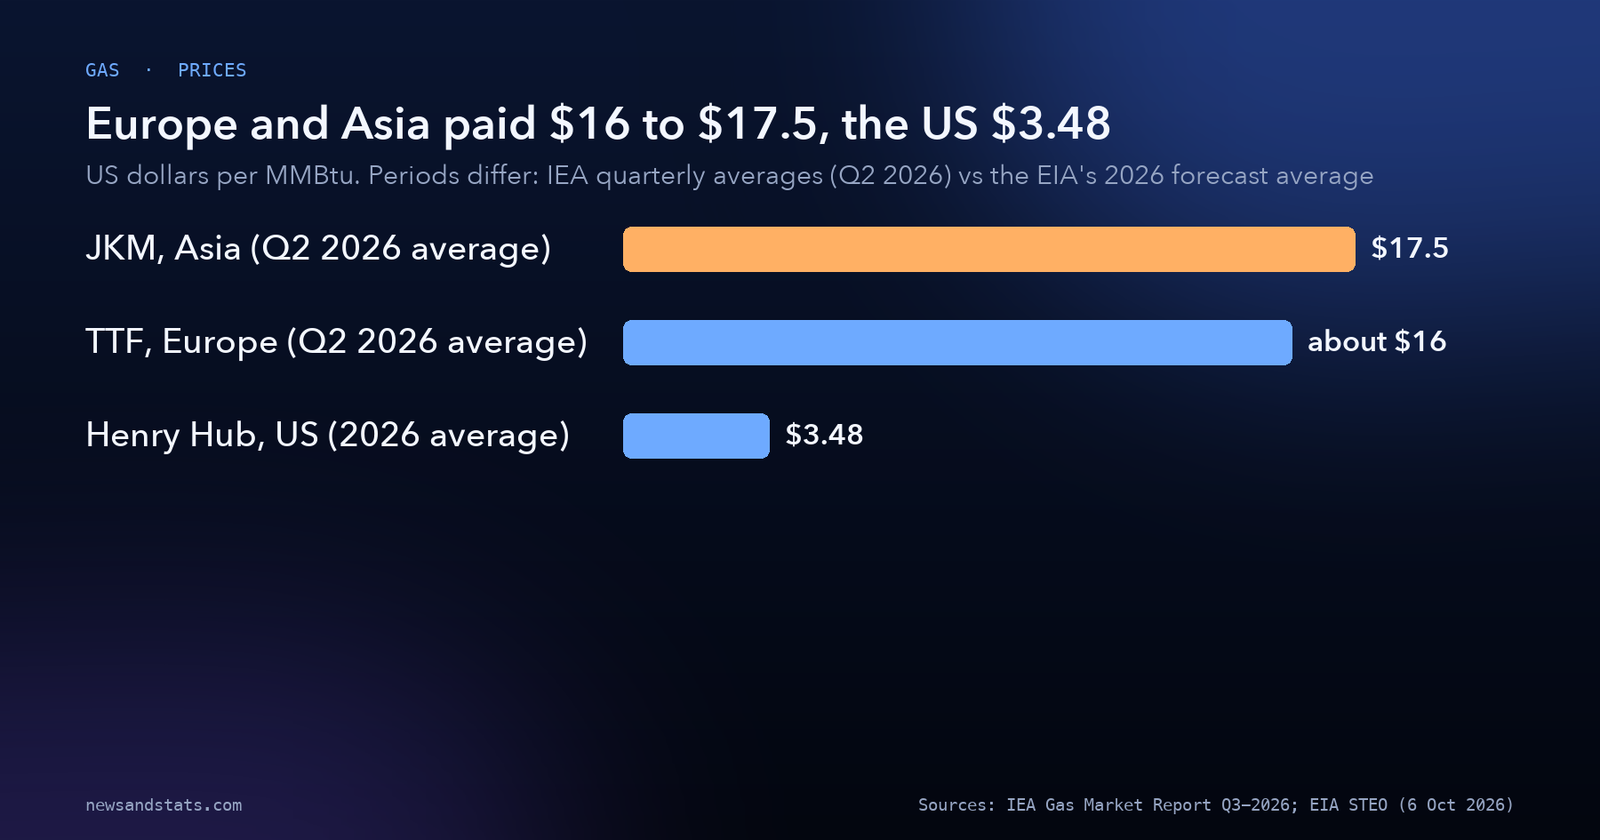
Sources: IEA, Gas Market Report Q3-2026; US EIA, Short-Term Energy Outlook (6 October 2026).
The chart compares different periods: the IEA’s Q2 2026 averages for Europe and Asia and the EIA’s full-year 2026 forecast for the United States. It shows the order of magnitude of the gap, not a precise like-for-like spread. Our own calculation from the EIA’s figures: the 2026 forecast of $3.48 is 1.4% below the 2025 average of $3.53.
7. Demand fell too
The IEA expects global gas demand to fall about 0.5% (about 20 bcm) in 2026, the third annual decline this decade. By region, it projects the Middle East down about 4%, Asia down about 0.5% and Europe down more than 2%. Central and South America is up 3% and Eurasia nearly 3%.
In the first half of 2026, Asian demand fell an estimated 0.5% (almost 5 bcm), and China’s demand fell about 4% year on year from March to June. OECD Europe consumed about 0.5% (less than 1 bcm) less in the first half. We do not offer a cause for these changes. For one large importer’s exposure to energy prices, see our comparison of India vs China.
8. The United States keeps adding
The EIA expects US LNG exports to keep rising: 15.1 billion cubic feet per day (bcf/d) in 2025, 17.6 bcf/d projected for 2026 and 18.6 bcf/d projected for 2027. Our calculations: that is a rise of about 16.6% from 2025 to 2026 and about 5.7% from 2026 to 2027.
The IEA notes two US export authorizations in 2026: Plaquemines was authorized to raise exports by 13% (4.6 bcm/yr), and Elba Island by 22% (0.8 bcm) to countries without a free trade agreement. It also notes three US projects that reached FID since March: CP2 Phase 2, which would bring CP2’s peak capacity to 40 bcm/yr from the second half of 2030; Delfin’s first floating unit, adding 6 bcm/yr in 2030; and Commonwealth, adding 13 bcm/yr in 2030. As the IEA says, projects starting in 2030 do not add capacity in 2026 or 2027.
9. Delayed, not cancelled: what the IEA says about 2027
The IEA’s reading is that the easing effects of the supply wave are set to be delayed, and that the supply losses are concentrated in 2026 and 2027. Markets, it says, could remain tighter than previously expected over the next two years. It gives no quantified forecast for 2027 supply or prices.
Our reading of the tracker and the gas report together: the wave itself is still in the schedule. The tracker’s annual additions still peak at about 90 bcm/yr in 2028, and its project table lists four US projects and Nigeria’s NLNG Train 7 among the 2026 and 2027 start-ups. What changed is timing: Qatar’s North Field East expansion slipped, and the IEA estimates cumulative supply losses of 140 bcm over 2026 to 2030.
10. How to read these numbers
Five distinctions help.
- Approved, under construction and delivered are different things. More than 430 bcm/yr reached FID, more than 330 bcm/yr is under construction and set to come online, and none of that is the volume actually exported.
- Nameplate is not output. The tracker reports nameplate capacity, not exports. How much a project actually exports depends on when it starts up and how it runs, which the tracker does not report.
- Units vary. The IEA uses bcm/yr and mtpa, the EIA uses bcf/d, and prices are in dollars per MMBtu. We convert only where a source gives both units.
- Prices come from different benchmarks and periods. TTF, JKM and Henry Hub are different markets, and our chart compares quarterly averages with a full-year forecast.
- Forecasts are forecasts. The IEA’s 2026 figures and the EIA’s 2026 and 2027 numbers are projections made in July and October, not outcomes.
What to watch
- Whether North Field East’s first train starts by the first half of 2027, the IEA’s revised date, or slips further as QatarEnergy warned it could.
- LNG flows through the Strait of Hormuz, which the IEA said in July remained well below pre-conflict levels.
- Whether Gulf export recovery is delayed enough to produce the first annual fall in global LNG supply since 2012, the risk the IEA flags.
- The EIA’s next Short-Term Energy Outlook, due on 10 November 2026, for its updated US LNG export and Henry Hub forecasts.
- The first start-ups on the tracker’s schedule: Golden Pass LNG in 2026, then Rio Grande, CP2 Phase 1 and Port Arthur Phase 1 in 2027.
- Whether TTF and JKM, which the IEA says remain well above 2025 levels, keep easing.
The bottom line
The LNG supply wave is real: more than 430 bcm/yr approved since 2019, more than 330 bcm/yr under construction, and additions peaking at about 90 bcm/yr in 2028. But the IEA says the Gulf outage has delayed its relief. Hormuz had carried almost 20% of global LNG supply, Qatar and UAE supply falls about 45% in 2026, and Qatar’s North Field East expansion is pushed back. The IEA expects other suppliers to roughly offset the loss for 2026, which is why it forecasts global supply flat, and as of its July report prices had eased from their March highs but remained well above 2025 levels. For the wider economic picture, see our post on the IMF’s October outlook, and for more on how industries work, our Industries section.
Related reading
- Who pays for the 2026 energy shock? The numbers, country by country: the costs of the same disruption for importing countries.
- The world economy in 8 numbers: what the IMF’s October 2026 outlook says: the global growth and inflation backdrop.
- India vs China: the economic gap in 10 numbers: two large energy importers compared.