
The headline U.S. unemployment rate held steady at 4.1% in October 2026, yet that single national figure conceals a 3.4-percentage-point divide across state labor markets. According to the U.S. Bureau of Labor Statistics State Employment and Unemployment release published on 20 November 2026, joblessness ranged from 2.0% in South Dakota to 5.4% in the District of Columbia. Meanwhile, over-the-year nonfarm payroll expansion remained concentrated in just 12 states, leaving 38 states and the District of Columbia statistically unchanged. For readers tracking how the broader global economic outlook translates into local hiring, the October 2026 US state employment data show a labor market defined by regional stability at the top and sharp divergence at the margins.
1. The 3.4-Point Unemployment Spread Across US State Employment
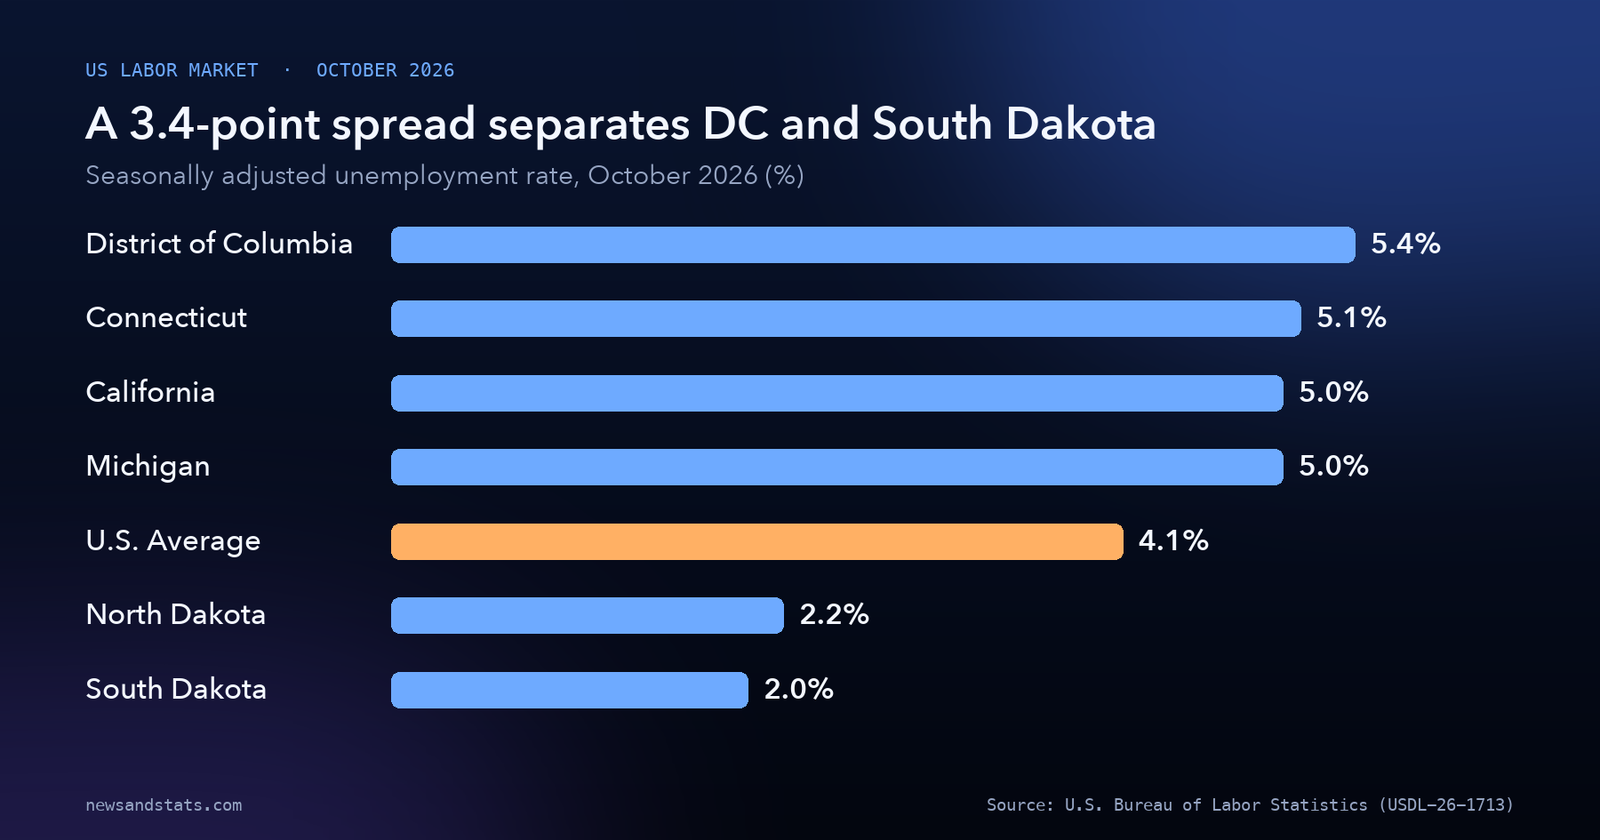
National averages flatten stark geographic differences. In October 2026, the U.S. seasonally adjusted unemployment rate stood at 4.1%, unchanged in practical terms over the month. Beneath that 4.1% benchmark, 19 states recorded unemployment rates significantly lower than the national rate, 3 states and the District of Columbia recorded rates significantly higher, and 28 states posted rates not appreciably different from the U.S. average.
The lowest unemployment rates clustered in the Upper Midwest and northern New England. South Dakota led the nation at 2.0%, followed by North Dakota at 2.2%, New Hampshire at 2.5%, and Vermont at 2.6%. Hawaii and Nebraska tied at 2.8%, while Montana and Wyoming each registered 3.1%. At the opposite end of the distribution, the District of Columbia recorded the highest rate at 5.4%, ahead of Connecticut at 5.1% and a tie between California and Michigan at 5.0%.
My calculation puts the spread between the highest and lowest jurisdictions at 3.4 percentage points (5.4% minus 2.0%). That gap reflects differing industrial structures, population dynamics, and sensitivity to macro pressures such as the 2026 energy import shock. Even within regions, states diverge: while New Hampshire and Vermont maintained rates at 2.6% or lower, neighboring Connecticut stood at 5.1%.
Source: U.S. Bureau of Labor Statistics, State Employment and Unemployment — October 2026, Table A and Summary.
2. Monthly Unemployment Stability: 46 States Held Steady in October
From September to October 2026, state unemployment rates showed minimal month-to-month volatility. Across the country, 46 states experienced no statistically significant over-the-month change in their seasonally adjusted unemployment rates. Only four states and the District of Columbia recorded measurable shifts during the month.
Colorado posted the sole statistically significant increase, rising by 0.3 percentage points from 4.1% in September 2026 to 4.4% in October 2026. Four jurisdictions moved in the opposite direction. The District of Columbia declined by 0.2 percentage points from 5.6% to 5.4%, yet it still remained the highest-unemployment jurisdiction in the country. Florida edged down by 0.1 percentage points from 4.4% to 4.3%, New Hampshire fell by 0.1 percentage points from 2.6% to 2.5%, and Pennsylvania dropped by 0.1 percentage points from 3.6% to 3.5%.
| Jurisdiction | Oct 2026 rate | Sept 2026 rate | Monthly change | Category |
|---|---|---|---|---|
| District of Columbia | 5.4% | 5.6% | -0.2 pp | Highest rate / monthly decline |
| Connecticut | 5.1% | — | — | Second-highest rate |
| California | 5.0% | — | — | Tied third-highest rate |
| Michigan | 5.0% | — | — | Tied third-highest rate |
| Colorado | 4.4% | 4.1% | +0.3 pp | Sole monthly increase |
| Florida | 4.3% | 4.4% | -0.1 pp | Monthly decline |
| U.S. Average | 4.1% | — | — | National benchmark |
| Pennsylvania | 3.5% | 3.6% | -0.1 pp | Monthly decline |
| New Hampshire | 2.5% | 2.6% | -0.1 pp | Low rate / monthly decline |
| North Dakota | 2.2% | — | — | Second-lowest rate |
| South Dakota | 2.0% | — | — | Lowest rate |
Source: U.S. Bureau of Labor Statistics, State Employment and Unemployment — October 2026, Tables A and B.
3. Monthly Payroll Hiring Narrowed to Four States
While unemployment rates measure the share of the labor force seeking work, nonfarm payroll counts measure net employer hiring on establishment payrolls. In October 2026, monthly payroll expansion was unusually narrow. Across all 50 states and the District of Columbia, only four states recorded statistically significant over-the-month payroll gains between September and October 2026, while 46 states and the District of Columbia were statistically unchanged.
California led the monthly expansion, adding 47,100 nonfarm payroll jobs (+0.3%), lifting total state payrolls from 18,164,100 in September to 18,211,200 in October. Three Midwestern states accounted for the remaining significant monthly gains: Indiana added 15,900 jobs (+0.5%, rising from 3,275,500 to 3,291,400), Kansas added 7,100 jobs (+0.5%, from 1,470,700 to 1,477,800), and Iowa added 7,000 jobs (+0.4%, from 1,584,200 to 1,591,200).
My calculation shows that these four states added a combined 77,100 jobs over the month, with California alone generating 61.1% of that four-state total (47,100 divided by 77,100). Notice the contrast inside California’s own data: the state simultaneously posted the largest monthly payroll gain in the country while holding a 5.0% unemployment rate, tied with Michigan for the third-highest rate nationally. Large, diversified state economies tied to global trade resilience often absorb both steady hiring and elevated labor-force churn at the same time.
4. Annual Job Growth Concentrated in 12 States
Over the full 12 months from October 2025 to October 2026, U.S. payroll expansion remained heavily concentrated in the Sun Belt and select industrial corridors. Only 12 states recorded statistically significant over-the-year nonfarm payroll increases, while 38 states and the District of Columbia showed no statistically significant net change.
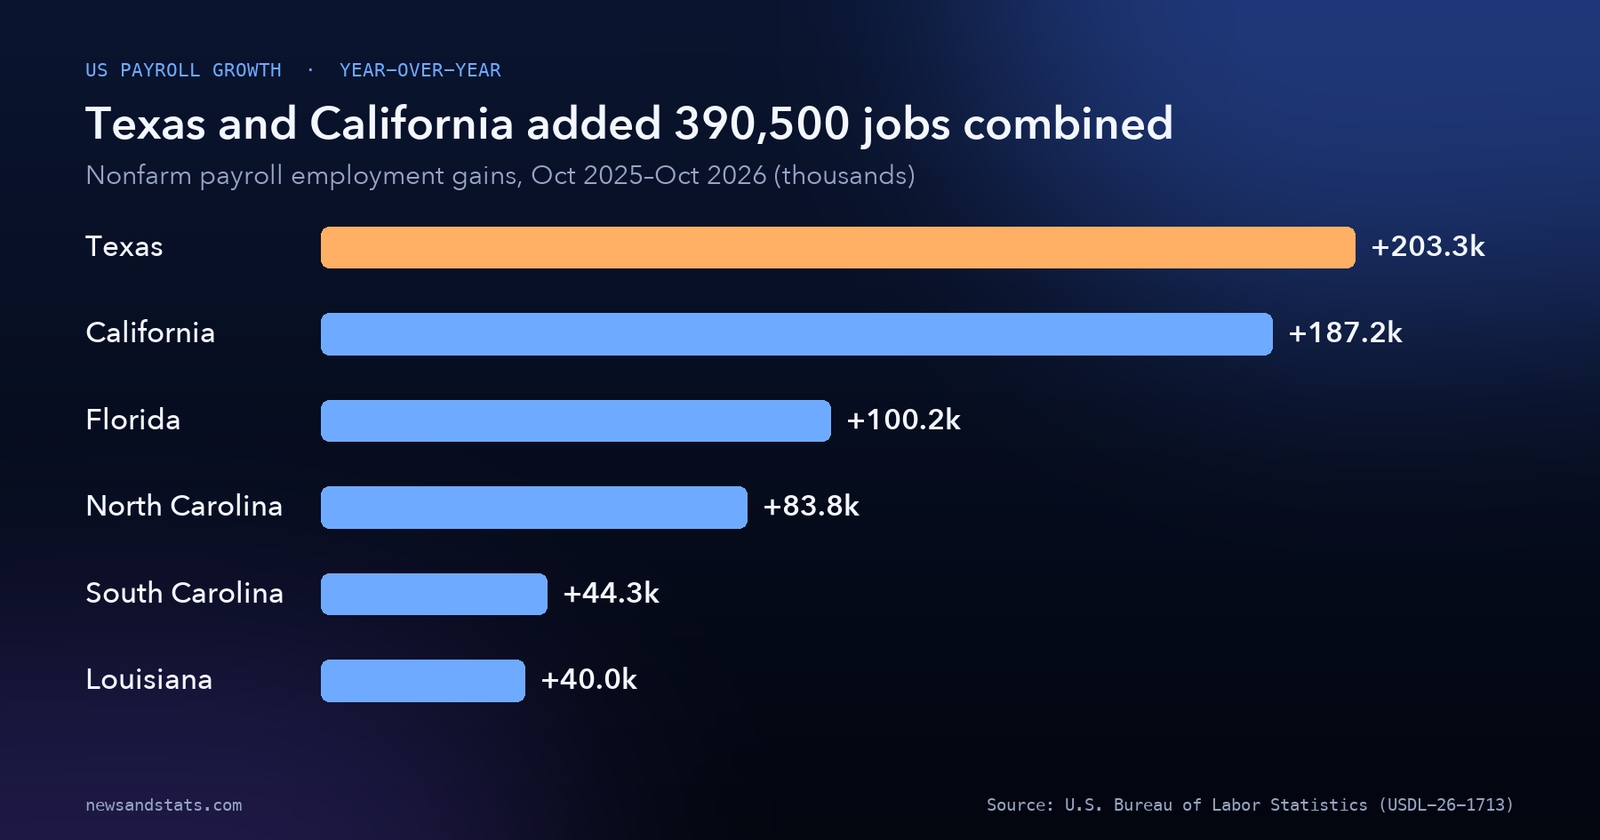
Texas and California dominated raw job creation. Texas added 203,300 jobs (+1.4%), rising from 14,297,200 in October 2025 to 14,500,500 in October 2026. California followed with 187,200 jobs (+1.0%), growing from 18,024,000 to 18,211,200. My calculation shows that Texas and California together added 390,500 jobs, representing 45.4% of the 859,900 combined payroll gains across all 12 expanding states. Adding third-place Florida (+100,200 jobs, or +1.0%) brings the top three states to 490,700 jobs, or 57.1% of the 12-state total.
For observers weighing entry-level hiring studies alongside a broader long-term job disruption forecast, these state-level numbers highlight that net national job creation in late 2026 rested on a relatively narrow group of high-growth states rather than broad-based hiring across all 50 states.
Source: U.S. Bureau of Labor Statistics, State Employment and Unemployment — October 2026, Table D.
The table below lists all 12 states that posted statistically significant over-the-year nonfarm payroll increases between October 2025 and October 2026, ranked by net jobs added.
| State | Oct 2025 payrolls | Oct 2026 payrolls | Net change | Percent change |
|---|---|---|---|---|
| Texas | 14,297,200 | 14,500,500 | +203,300 | +1.4% |
| California | 18,024,000 | 18,211,200 | +187,200 | +1.0% |
| Florida | 9,943,000 | 10,043,200 | +100,200 | +1.0% |
| North Carolina | 5,057,200 | 5,141,000 | +83,800 | +1.7% |
| South Carolina | 2,395,300 | 2,439,600 | +44,300 | +1.8% |
| Louisiana | 1,991,200 | 2,031,200 | +40,000 | +2.0% |
| Minnesota | 3,029,600 | 3,067,700 | +38,100 | +1.3% |
| Indiana | 3,254,000 | 3,291,400 | +37,400 | +1.1% |
| Missouri | 2,982,400 | 3,015,900 | +33,500 | +1.1% |
| Tennessee | 3,355,900 | 3,389,200 | +33,300 | +1.0% |
| Utah | 1,767,900 | 1,799,100 | +31,200 | +1.8% |
| Alabama | 2,195,300 | 2,222,900 | +27,600 | +1.3% |
Source: U.S. Bureau of Labor Statistics, State Employment and Unemployment — October 2026, Table D.
5. Percentage Growth Leaders: Louisiana, South Carolina, and Utah
Raw job totals naturally favor the largest states by population, so percentage growth rates offer a clearer view of relative labor market momentum. Measured by over-the-year percentage expansion between October 2025 and October 2026, smaller and mid-sized states outpaced the largest job engines.
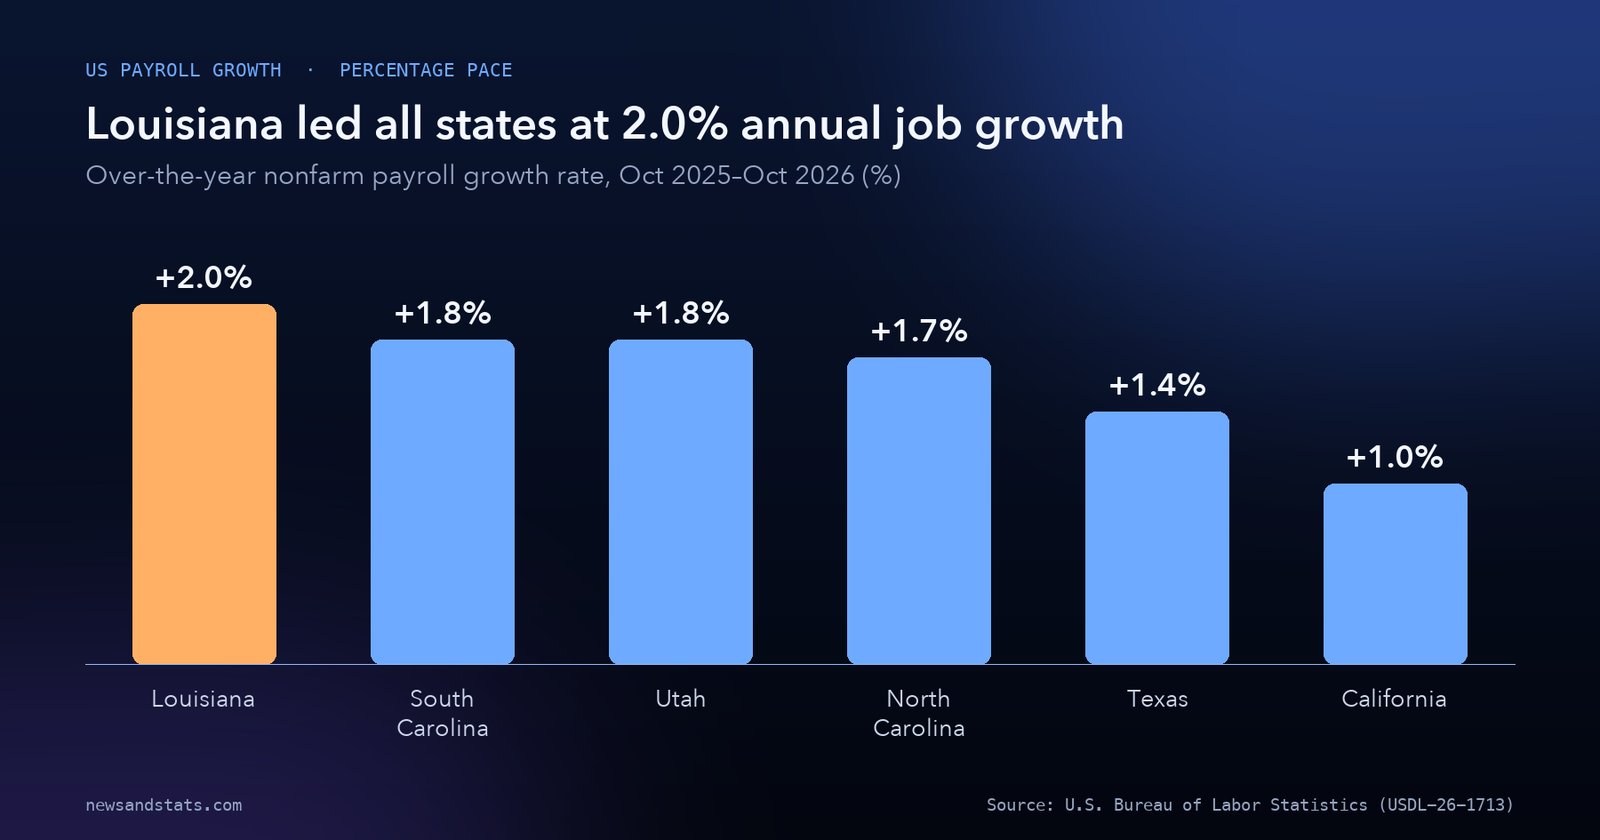
Louisiana led the entire country at +2.0%, adding 40,000 jobs to reach 2,031,200 total nonfarm payrolls. South Carolina and Utah tied for second place at +1.8% each: South Carolina added 44,300 jobs to reach 2,439,600, while Utah added 31,200 jobs to reach 1,799,100. North Carolina ranked fourth at +1.7% (+83,800 jobs, reaching 5,141,000), followed by Texas at +1.4% (+203,300 jobs). Minnesota and Alabama each grew by +1.3%, Indiana and Missouri expanded by +1.1%, and California, Florida, and Tennessee each posted +1.0% annual growth.
Industrial construction, logistics corridors, and energy-intensive investments such as rising data center power demand have reinforced job expansion across Southern and Mountain West states. Even though California added more than four times as many net jobs as Louisiana, Louisiana’s 2.0% pace ran at double California’s 1.0% expansion rate.
Source: U.S. Bureau of Labor Statistics, State Employment and Unemployment — October 2026, Table D.
6. How US State Employment Data Get Misread
Three technical details in the U.S. Bureau of Labor Statistics release prevent common misreadings of the October 2026 numbers.
First, the October 2026 report contains no over-the-year unemployment rate comparisons for states. The Bureau of Labor Statistics explicitly noted that October 2025 household survey data were not collected due to a lapse in appropriations. Because the household survey supplies the denominator and numerator for state unemployment rates, no October 2025-to-October 2026 state unemployment rate change analysis exists in this release. Analysts comparing October 2026 state joblessness against a year earlier must wait for November 2026 data rather than extrapolating from missing October 2025 observations.
Second, a state can simultaneously post strong payroll gains and an elevated unemployment rate because the two figures come from different surveys. California added 47,100 nonfarm payroll jobs in October 2026 and 187,200 jobs over the year, yet its unemployment rate stood at 5.0%, tied with Michigan for the third-highest nationally. Nonfarm payrolls count jobs reported by employers in the establishment survey, whereas the unemployment rate measures residents actively seeking work in the household survey. Rapid labor-force entry or job switching raises unemployment even while employers expand headcount.
Third, “statistically unchanged” does not mean zero movement. The Bureau of Labor Statistics flags a state change as significant only when it exceeds the survey’s margin of error at the 90% confidence level. Smaller states with wider sampling margins need larger percentage swings to register as statistically significant, which explains why 46 states showed no statistically significant monthly unemployment shift and 38 states plus the District of Columbia showed no statistically significant annual payroll shift.
7. Regional Divergence: Tight Labor Supply vs. Hiring Scale
Comparing the two halves of the October 2026 BLS report reveals two distinct regional labor dynamics. Plains and northern New England states operate with tight labor supply: South Dakota (2.0%), North Dakota (2.2%), New Hampshire (2.5%), Vermont (2.6%), and Nebraska (2.8%) maintain unemployment rates well below the 4.1% national average, yet none of those five states ranked among the 12 states with statistically significant annual nonfarm payroll expansion. Low unemployment in those markets reflects limited slack rather than rapid net headcount growth.
By contrast, the 12 states generating statistically significant annual payroll gains sit primarily in the South and West, led by Texas (+203,300), California (+187,200), Florida (+100,200), and North Carolina (+83,800). Even within the Midwest, annual payroll expansion concentrated in three states: Minnesota (+38,100), Indiana (+37,400), and Missouri (+33,500). Together, those geographic patterns confirm that U.S. labor demand in October 2026 remained unevenly distributed across states.
What to watch
- November 2026 state unemployment release: The next BLS LAUS report restores full over-the-year state unemployment rate comparisons after the October 2025 household survey gap.
- Colorado’s unemployment trajectory: Colorado posted the only statistically significant monthly unemployment increase (+0.3 percentage points to 4.4%) in October 2026; November data will show whether that upward move persists.
- California’s 5.0% threshold: California added 47,100 monthly payroll jobs and 187,200 annual jobs while holding a 5.0% unemployment rate; watch whether strong hiring pulls joblessness back below 5.0%.
- Midwestern monthly momentum: Indiana (+15,900), Kansas (+7,100), and Iowa (+7,000) accounted for three of the four states with significant monthly payroll gains in October 2026.
- Sun Belt hiring concentration: Texas, California, and Florida supplied 57.1% of the 12-state annual payroll gain; watch whether additional states cross the statistical significance threshold in coming months.
The bottom line
The U.S. unemployment rate stood at 4.1% in October 2026, but state labor markets spanned a 3.4-percentage-point range from 2.0% in South Dakota to 5.4% in the District of Columbia. Monthly hiring narrowed to just four states adding 77,100 combined jobs, while annual payroll growth concentrated in 12 states adding 859,900 jobs. Texas and California alone generated 45.4% of that 12-state annual total, while Louisiana led the nation in percentage growth at +2.0%. With October 2025 household survey data absent due to an appropriations lapse, over-the-year state unemployment comparisons remain paused until next month’s release.
Related reading
- The world economy in 8 numbers: what the IMF’s October 2026 outlook says: How global growth and inflation projections frame late-2026 labor markets.
- Who pays for the 2026 energy shock? The numbers, country by country: How energy import bills ripple into domestic prices and industrial hiring.
- Is AI hurting entry-level jobs? Two studies, two answers: How early-career hiring trends compare across recent labor market research.