Global trade policy moved at record speed in the first half of 2026, pulling border rules in two opposite directions at once. According to the World Trade Organization (WTO) trade monitoring 2026 report released on 17 November 2026, the cumulative stockpile of import-related restrictive and non-facilitating measures introduced since 2009 and still in force as of 30 June 2026 reached $5.4 trillion, or 21.3% of world imports—the highest level since WTO monitoring began in 2009.
Yet the same six-month window in World in Numbers also delivered an unprecedented wave of emergency trade opening. Between January and June 2026, WTO members and observers introduced 466 new trade-facilitating measures—already beating the 391 recorded across all of 2025—while export-facilitating measures jumped more than fivefold to a record $570 billion as governments scrambled to keep goods moving past disruptions in the Strait of Hormuz.
1. Policy velocity: six months of 2026 beat all of 2025
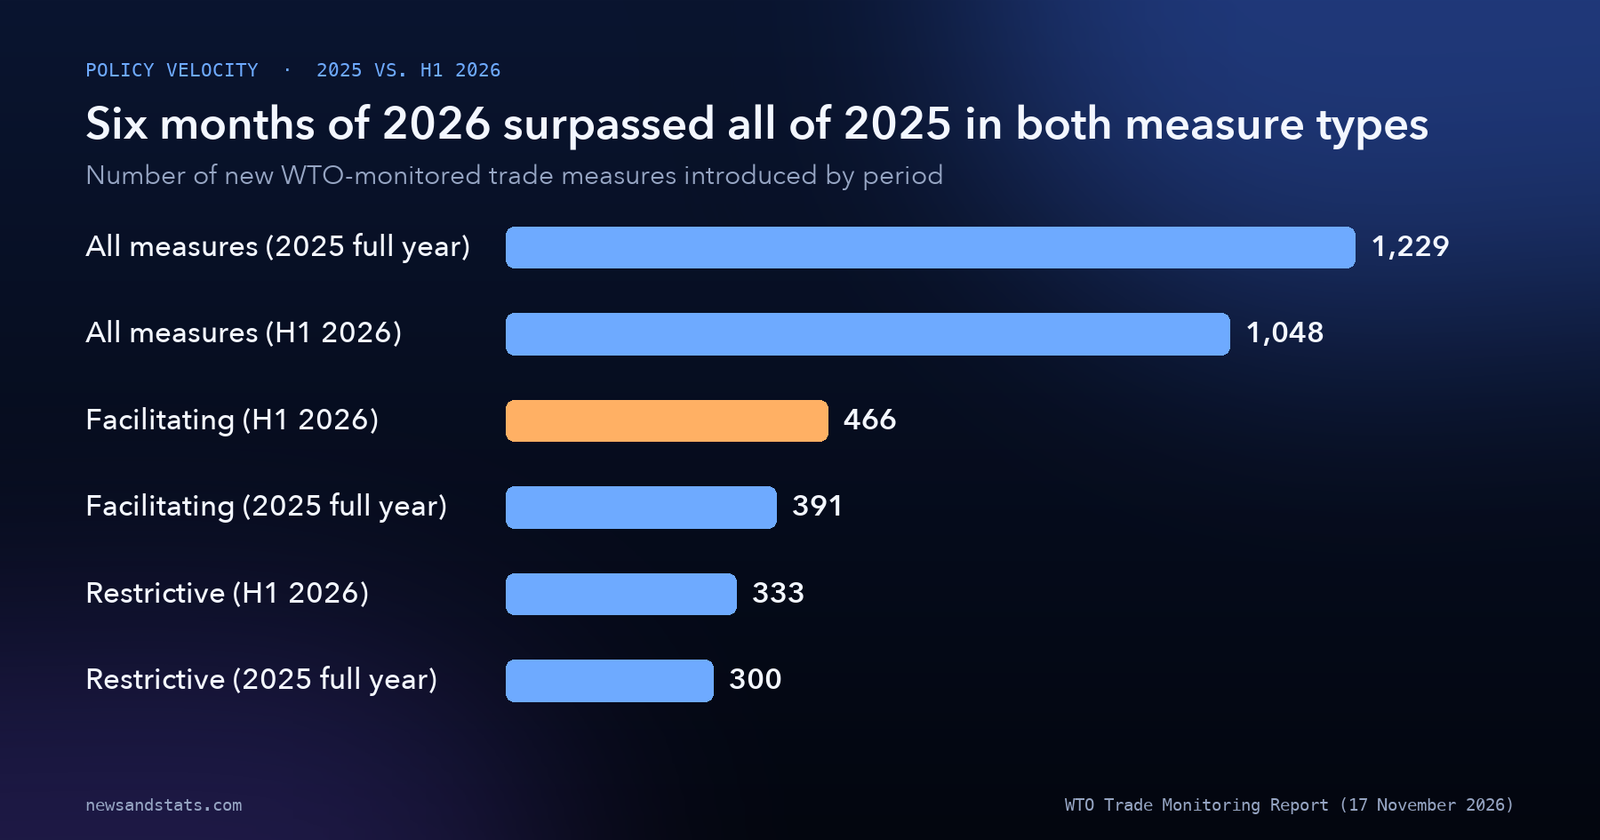
The WTO Director-General’s annual Overview of Developments in the International Trading Environment tracks trade and trade-related policies up to 30 June 2026, comparing full-year 2025 against the first six months of 2026. In all of 2025, WTO members and observers introduced 1,229 new trade and trade-related measures, an average of 102.4 measures per month (my calculation). In the first half of 2026 alone, members recorded 1,048 measures—averaging 174.7 measures per month, a 70.6% acceleration in monthly policy velocity (my calculation).
Both sides of the policy ledger surpassed their full-year 2025 counts before mid-year. New trade-facilitating measures rose to 466 in H1 2026, exceeding full-year 2025’s 391 by 19.2% (my calculation). Over the same six months, new restrictive and other non-facilitating measures reached 333, exceeding full-year 2025’s 300 by 11.0% (my calculation). Building on our earlier trade outlook coverage, the November 2026 monitoring data shows that policy activism broadened well beyond the largest economies, with the Trade Policy Activity (TPA) Index—updated jointly by WTO and IMF economists in July—confirming the same surge across the membership.
Source: WTO, Overview of Developments in the International Trading Environment, 17 November 2026.
2. The $2.794 trillion restrictive wave vs. the $1.87 trillion facilitation surge
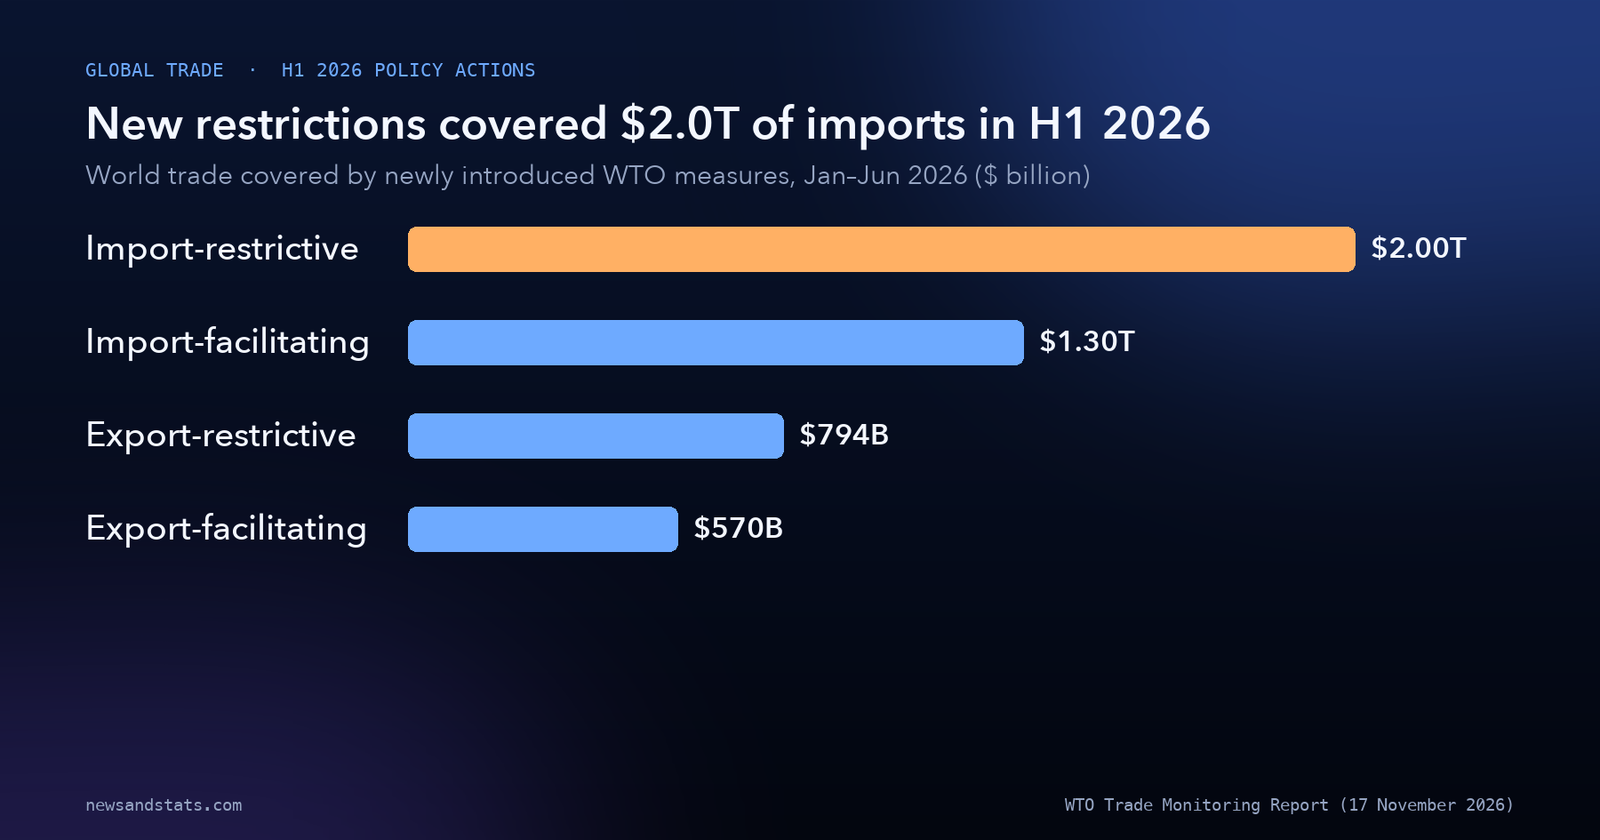
Measured by trade value, new barriers still outweighed new openings in H1 2026, even though facilitating measures outnumbered restrictive ones in raw count. New import-related restrictive and non-facilitating measures introduced between January and June 2026 covered $2.0 trillion, or 8.0% of world imports. New export-related restrictive measures covered $794 billion, or 3.2% of world exports—bringing combined H1 2026 new restrictions to $2.794 trillion (my calculation).
| WTO Trade Policy Metric | H1 2026 (Jan–Jun) | 2025 Full Year | Cumulative Stockpile (Since 2009, as of 30 Jun 2026) |
|---|---|---|---|
| Total new trade & trade-related measures | 1,048 measures | 1,229 measures | Tracked continuously since 2009 |
| Trade-facilitating measures (count) | 466 measures | 391 measures | Not cumulative stockpile |
| Import-facilitating trade coverage | $1.3 trillion (5.2% of imports) | Lower than H1 2026 pace | Temporary & permanent easing |
| Export-facilitating trade coverage | $570 billion (2.3% of exports) | Less than one-fifth of H1 2026 | Record level; Hormuz-linked |
| Restrictive & non-facilitating measures (count) | 333 measures | 300 measures | 2009–2026 in-force stockpile |
| Import-restrictive trade coverage | $2.0 trillion (8.0% of imports) | Included in stockpile | $5.4 trillion (21.3% of world imports) |
| Export-restrictive trade coverage | $794 billion (3.2% of exports) | Included in stockpile | $1.5 trillion (6.3% of world exports) |
| Trade remedy investigations initiated | 218 (36.3/month) | 391 (32.6/month) | 31 terminated in H1 2026 |
| Services trade measures introduced | 52 measures | 130 measures | Mostly facilitating or regulatory |
Source: WTO, Overview of Developments in the International Trading Environment, 17 November 2026.
On the opening side, new import-facilitating measures in H1 2026 covered an estimated $1.3 trillion (5.2% of world imports), while export-facilitating measures reached $570 billion (2.3% of world exports), totaling $1.87 trillion in combined facilitation coverage (my calculation). That $570 billion export-facilitation figure is more than five times the 2025 level—a surge the WTO attributes largely to temporary measures enacted in response to shipping disruptions through the Strait of Hormuz, where the IEA’s World Energy Outlook 2026 recorded cumulative Gulf losses of 2.8 billion barrels of oil and 60 billion cubic meters of gas through October 2026. Those emergency trade adjustments align with the rerouting and freight pressures examined in our 2026 energy shock and global maritime trade reporting.
Source: WTO, Overview of Developments in the International Trading Environment, 17 November 2026.
WTO Director-General Ngozi Okonjo-Iweala highlighted a sharp sectoral divide beneath those aggregate numbers: in most sectors examined, new import-facilitating measures covered a larger share of imports than new restrictive measures. The two clear exceptions were electric vehicles and photovoltaic cells, where intense competition for global market share drove concentrated tariff and non-facilitating interventions. Those targeted clean-tech barriers run directly against the broader clean-energy trade cooperation needed to scale renewable supply chains.
3. The cumulative stockpile: $6.9 trillion of trade under active restrictions
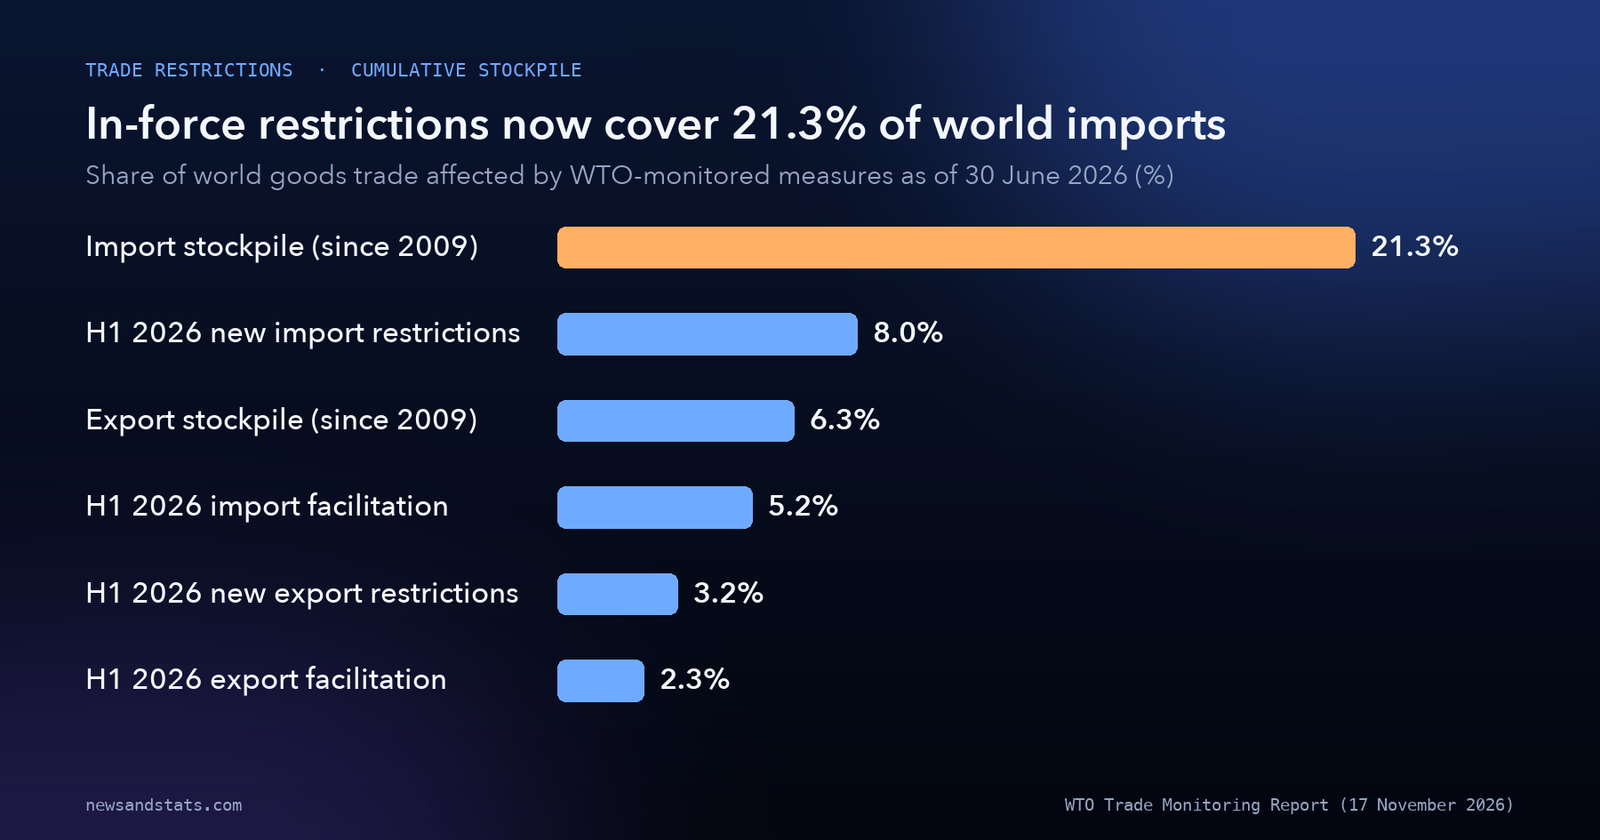
Because tariffs, quotas, and export controls often stay on the books long after their announcement year, the WTO tracks the cumulative stockpile of restrictive and non-facilitating measures introduced since 2009 that remain in force. As of 30 June 2026, the import-related restrictive stockpile covered $5.4 trillion of goods trade, equivalent to 21.3% of world imports. The export-related restrictive stockpile reached $1.5 trillion, covering 6.3% of world exports.
Source: WTO, Overview of Developments in the International Trading Environment, 17 November 2026.
Combined, the in-force import and export restriction stockpiles total $6.9 trillion across global goods flows (my calculation). Both the $5.4 trillion import figure and the $1.5 trillion export figure stand at the highest levels recorded since WTO trade monitoring began in 2009. For global manufacturers and importers, that means more than one-fifth of every dollar of merchandise crossing borders now faces at least one post-2009 restrictive or non-facilitating policy still on the books.
4. Trade remedies, services rules, and industrial subsidies
Trade remedy actions—primarily anti-dumping investigations—accelerated in cadence during the first half of 2026, even though they cover a smaller share of total trade than broad tariff measures. In 2025, WTO members initiated 391 trade remedy investigations, an average of 32.6 initiations per month. In H1 2026, members initiated 218 new investigations, lifting the monthly pace to 36.3 per month—an 11.3% faster monthly rate (my calculation). Over the same six months, only 31 trade remedy actions were terminated, a termination-to-initiation ratio of 14.2% (my calculation).
Services trade policy moved in a more constructive direction. WTO members and observers introduced 130 new measures affecting trade in services in 2025 and a further 52 measures in the first six months of 2026, with most aimed at facilitating trade or strengthening regulatory frameworks across multiple supply modes. At the same time, industrial and agricultural economic support remained at historically high levels, increasingly tied to competitiveness, supply security, and climate goals—echoing the strategic industrial policy trends analyzed in our geoeconomics of development coverage. Published continuously since 2009 under WTO rules to assist the Trade Policy Review Body in evaluating multilateral trading developments, the Director-General’s monitoring report underscores that domestic subsidy programs now operate alongside border tariffs as standard tools of national economic policy, even when individual subsidies do not appear directly in the $5.4 trillion import-restriction stockpile.
5. Growth vs. friction: 3.9% goods growth and 3.3% services growth
Despite the $5.4 trillion import-restriction stockpile, physical trade expanded faster than anticipated in the first half of 2026. Citing its 8 October 2026 Global Trade Outlook and Statistics update, the WTO notes that surging demand for AI-enabling goods lifted world merchandise trade value by around 15% year on year in H1 2026. As a result, the WTO raised its full-year 2026 merchandise trade volume growth forecast by 2.0 percentage points, from 1.9% in March to 3.9% (my calculation).
Commercial services moved in the opposite direction on volume. While commercial services trade value rose around 14% year on year in H1 2026, the WTO lowered its full-year 2026 services volume growth forecast by 1.5 percentage points, from 4.8% in March to 3.3% (my calculation), reflecting Middle East conflict disruptions to transport and travel services.
6. How WTO trade monitoring numbers get misread
Headline counts of trade restrictions and facilitation measures are frequently misinterpreted when readers treat them as symmetric or assume every measure carries equal economic weight. First, raw measure counts do not equal trade-value impact. In H1 2026, facilitating measures outnumbered restrictive measures by 466 to 333—a 39.9% higher count (my calculation)—yet restrictive measures covered $2.794 trillion in combined import and export flows compared with $1.87 trillion for facilitating measures, a 49.4% larger trade-value footprint (my calculation).
Second, flow metrics differ fundamentally from stockpile metrics. The $2.0 trillion import-restriction figure for H1 2026 measures only newly introduced policies in those six months, whereas the $5.4 trillion stockpile measures the cumulative value of import-restricting policies introduced since 2009 that remained active on 30 June 2026. Adding the two together would double-count active 2026 measures that are already inside the cumulative stockpile.
Third, trade facilitation surges in a supply crisis do not automatically signal permanent liberalization. Much of the $570 billion jump in H1 2026 export-facilitating measures—more than five times the 2025 level—consisted of temporary emergency actions tied to Strait of Hormuz transit disruptions, which can expire once shipping lanes stabilize. Finally, merchandise volume growth of 3.9% alongside a 15% rise in merchandise trade value reflects price and composition effects, including concentrated spending on high-value AI-enabling hardware rather than broad-based tariff relief.
What to watch
- Persistence of H1 2026 facilitation measures: Whether the 466 trade-facilitating measures—especially the record $570 billion in Hormuz-linked export facilitation—expire as temporary emergency steps or become permanent tariff reductions.
- EV and solar cell tariff escalation: Whether the targeted restrictions on electric vehicles and photovoltaic cells expand into adjacent clean-technology components in late 2026 and 2027.
- Anti-dumping backlog: With 218 new trade remedy investigations in H1 2026 (36.3 per month) against only 31 terminations, watch whether final duties convert pending inquiries into permanent import barriers.
- Services vs. merchandise divergence: Whether travel and maritime transport disruptions keep commercial services volume growth capped near 3.3% while AI-hardware shipments sustain merchandise growth near 3.9%.
The bottom line
The WTO trade monitoring 2026 report captures a global trading system running on two tracks at once. Cumulative in-force restrictions reached record highs of $5.4 trillion on imports (21.3%) and $1.5 trillion on exports (6.3%) as of 30 June 2026, led by targeted friction in electric vehicles, solar cells, and anti-dumping filings. At the same time, governments rolled out 466 trade-facilitating measures in just six months—pushing export facilitation above $570 billion—to cushion Hormuz supply shocks while AI-enabling goods lifted merchandise trade growth projections to 3.9%.
Related reading
- Global Trade Outlook 2026: AI Beats the War: How surging AI-enabling hardware demand lifted 2026 merchandise trade forecasts.
- Who pays for the 2026 energy shock? The numbers, country by country: How Strait of Hormuz disruptions translated into national energy import bills.
- Global Maritime Trade in 8 Numbers: How Chokepoint Rerouting Reshapes Shipping: Why shipping chokepoints alter freight costs and emergency trade policies.
- The Geoeconomics of Development in 8 Numbers: Why Global Growth Splits in Two: How industrial policy and strategic sectors are reshaping global investment flows.