
On November 19, 2026, the Food and Agriculture Organization of the United Nations (FAO) published its biannual Food Outlook report, projecting that the global food import bill will reach $2.267 trillion in 2026. That represents a 1.9% increase over 2025—an implied $42 billion rise from an estimated $2.225 trillion base—marking a sharp deceleration from the nearly 8% surge recorded in 2025.
Behind that headline moderation in World in Numbers, the burden of rising food import costs has shifted decisively away from wealthy nations toward emerging and developing economies. At the same time, conflict-driven export bottlenecks in the Black Sea, fertilizer supply disruptions in the Strait of Hormuz, and an intensifying El Niño event are creating stark divergences across staple crops, vegetable oils, dairy, and fisheries.
The $2.267 trillion food import bill: why growth shifted to developing economies
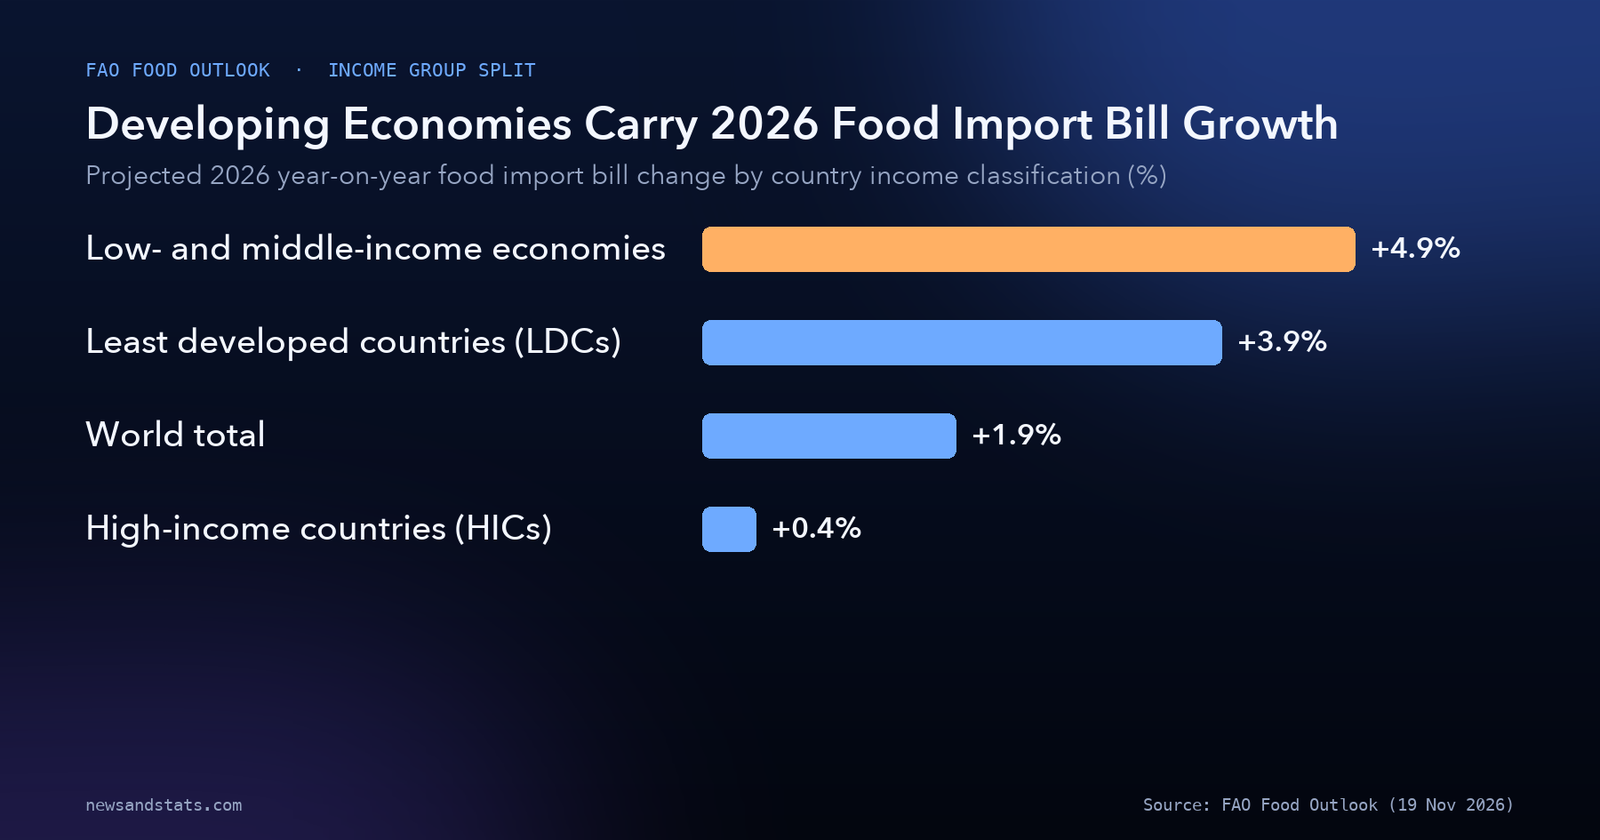
The most striking structural shift in the November 2026 FAO Food Outlook is who is paying more for imported food. In 2025, high-income countries (HICs) accounted for 79% of the global food import bill’s expansion. In 2026, HICs account for just 13% of global growth, with their overall food import bill edging up by only 0.4%.
By contrast, upper-middle-income countries account for roughly two-thirds of total global import bill growth in 2026. Across all low- and middle-income economies combined, the food import bill is projected to grow by 4.9% this year, while Least Developed Countries (LDCs) face a 3.9% increase—compounding fiscal pressures on low-income countries facing debt distress that rely on external hard currency to finance staple food purchases.
Source: FAO Food Outlook, November 2026.
This divergence reflects what countries buy. Wealthier importing nations benefitted most from falling international coffee and cocoa prices in 2026, whereas developing and lower-income importers devote a larger share of their external food spending to basic staples such as cereals, vegetable oils, and animal proteins—categories where import bills are climbing again.
Commodity-group split: beverages plunge 11.9% while oilseeds jump 9.9%
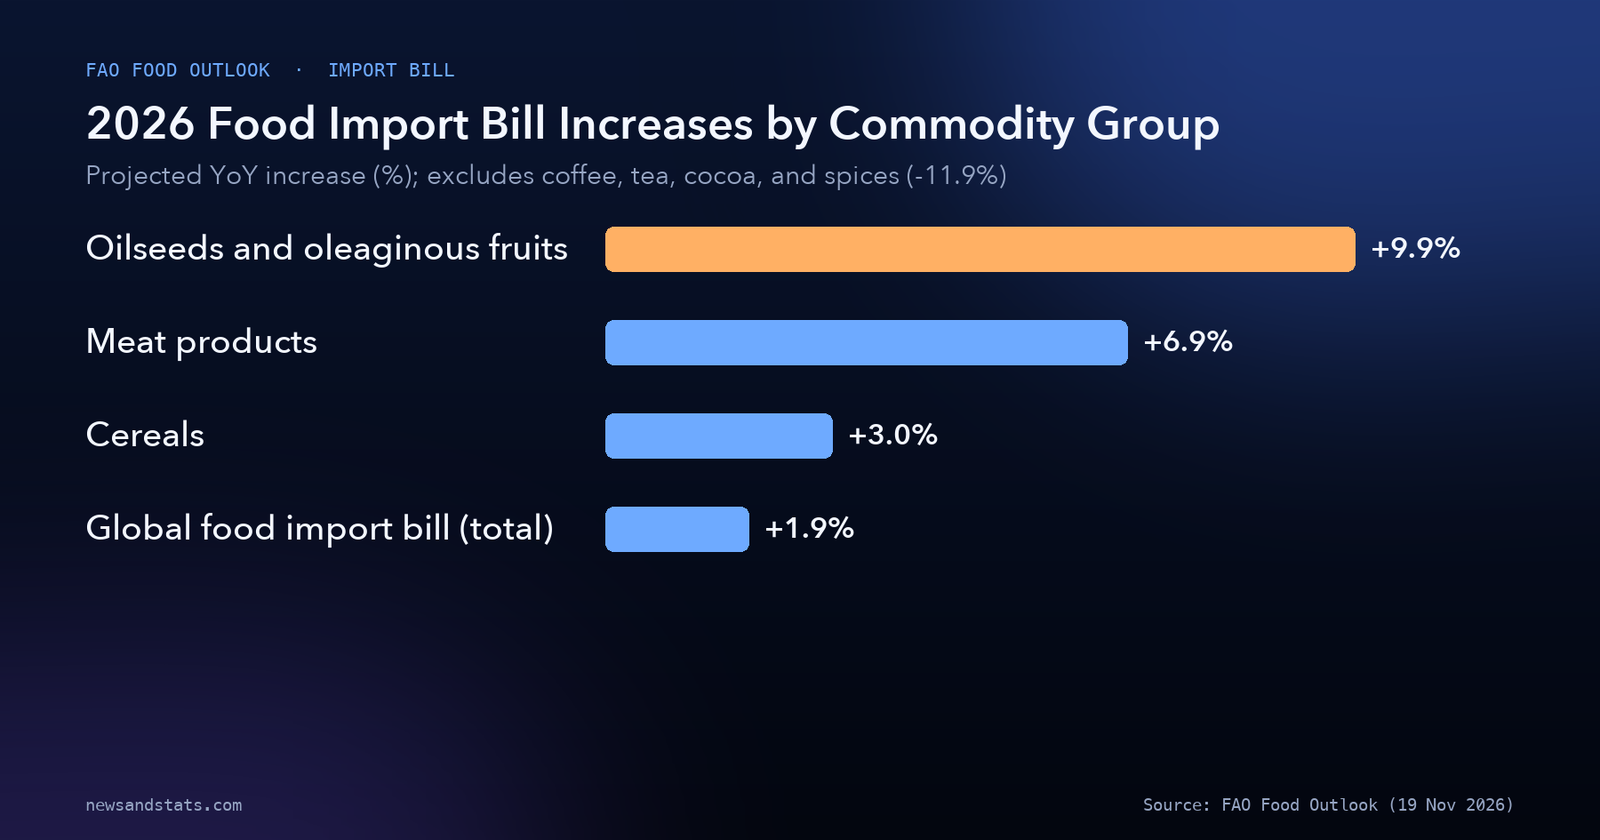
FAO’s commodity-level breakdown explains why the global total is up just 1.9% even as staple food costs accelerate. The import bill for coffee, tea, cocoa, spices, and related products is forecast to contract by 11.9% in 2026, acting as the primary brake on global food import inflation.
| Food import bill category or country group | 2026 projected change | Key market driver |
|---|---|---|
| Global food import bill (total) | +1.9% (to $2.267 trillion) | Deceleration from nearly +8% in 2025 |
| Coffee, tea, cocoa, spices, and related products | -11.9% | Lower international coffee and cocoa prices |
| Cereals | +3.0% | Renewed price and logistics pressures |
| Meat products | +6.9% | Firm import demand, led by poultry |
| Oilseeds and oleaginous fruits | +9.9% | Tight vegetable oil balances and biofuel demand |
| High-income countries (HICs) | +0.4% | Share of global growth fell from 79% to 13% |
| Low- and middle-income economies | +4.9% | Upper-middle-income group drives two-thirds of growth |
| Least developed countries (LDCs) | +3.9% | Elevated exposure to staple cereal and oil imports |
Source: FAO Food Outlook, November 2026.
Every other major food category tracked in the release is moving higher. The import bill for oilseeds and oleaginous fruits is forecast to climb 9.9% in 2026, followed by a 6.9% increase for meat products and a 3.0% rise for cereals. FAO expects the growing weight of low- and middle-income demand in global food import growth to broaden further over the longer term.
Source: FAO Food Outlook, November 2026.
Black Sea export collapse: from 7.8 million tonnes to under 0.5 million tonnes
While global wheat and maize harvests in 2026/27 remain above their respective five-year averages, physical export bottlenecks are distorting where those supplies sit. In a special feature on Black Sea trade, FAO reports that combined grain shipments from Ukraine’s Greater Odesa ports and the Russian Federation’s Sea of Azov and Black Sea ports fell below 0.5 million tonnes in September 2026—down from 7.8 million tonnes in September 2025, a collapse of more than 93.6%.
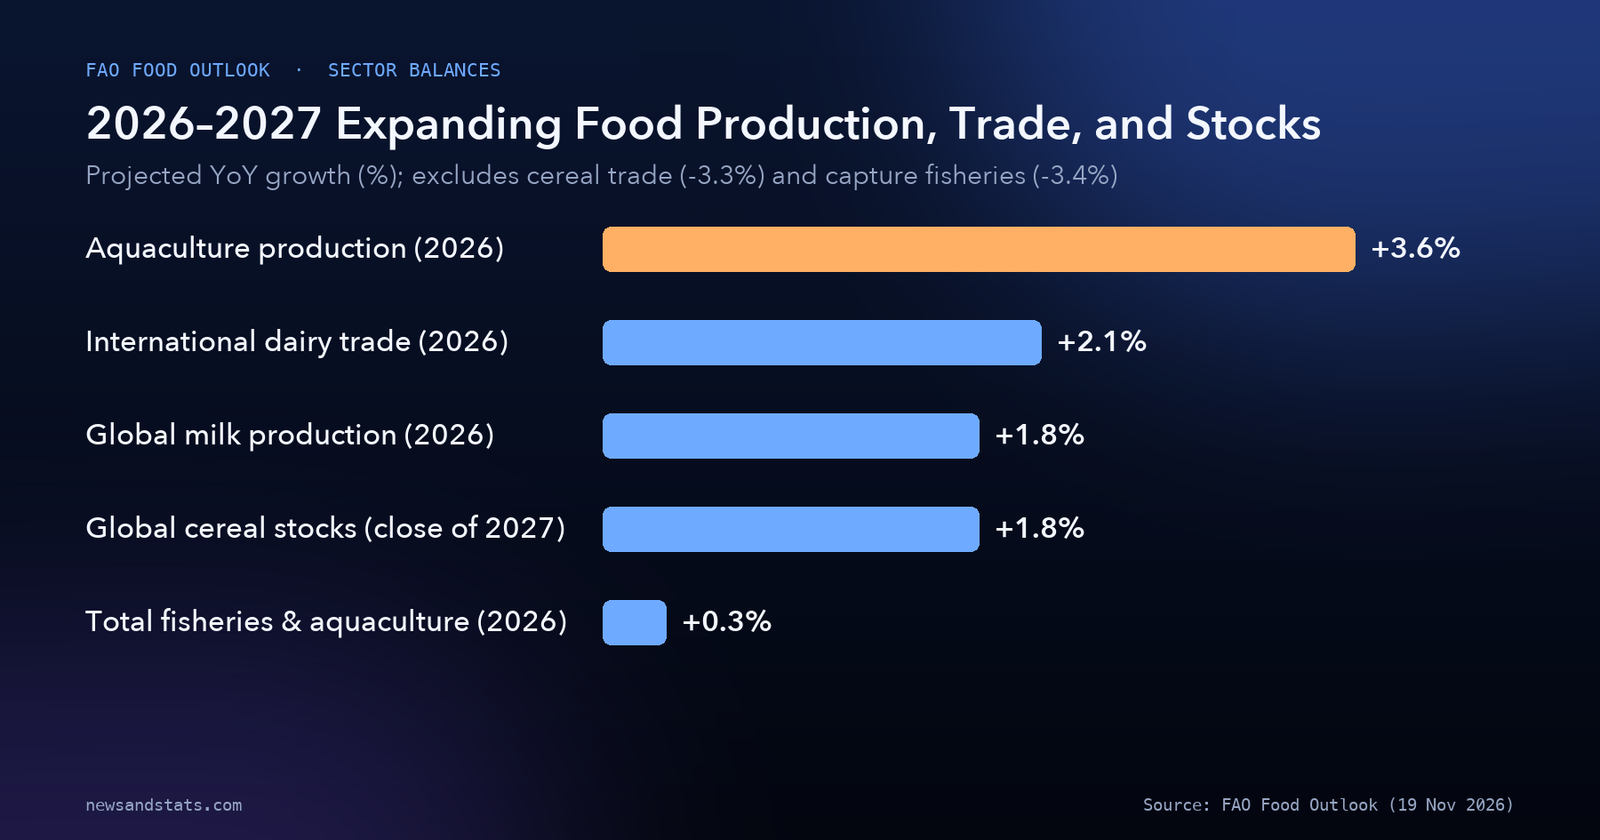
Because grain cannot exit Black Sea terminals at normal volume, global cereal stocks are forecast to rise by 1.8% by the close of the 2027 seasons, driven largely by wheat inventories piling up inside the Russian Federation and Ukraine. FAO warns that accumulating stranded inventories puts pressure on domestic storage capacity and creates grain quality and marketability risks. At the same time, world cereal trade in 2026/27 is forecast to contract by 3.3%, driven almost entirely by falling wheat shipments across all major exporters, while Argentina, Australia, and the European Union expand their shares of global wheat exports to fill part of the Black Sea gap—echoing broader trade rerouting documented in our global trade outlook.
Fertilizer shock and the Strait of Hormuz bottleneck
Agricultural input costs are also tightening producer margins. A dedicated special chapter in the November 2026 Food Outlook reports that global production of nitrogen fertilizers—including ammonia and urea—is expected to decline in 2026 due to energy supply, production, and trade disruptions linked to the closure of the Strait of Hormuz, a chokepoint central to the 2026 energy shock.
According to FAO’s fertilizer market analysis, Gulf region producers collectively account for approximately 34% of global urea trade, 23% of global ammonia trade, 18% of global MAP and DAP phosphate trade, and nearly half of global sulphur trade. Global fertilizer trade value had already climbed from $68 billion in 2024 to $81 billion in 2025 across 185 million gross product tonnes. In 2026, FAO’s fertilizer affordability index—measured relative to crop prices for maize in Brazil, wheat in the European Union, rice in Southeast Asia, and soybeans in the United States—deteriorated across all four benchmark crops, falling below its long-term baseline by mid-2026 and hitting its lowest levels between April and June. Elevated fertilizer prices relative to crop prices weaken farmers’ incentives to apply nutrients ahead of the next planting cycle.
Production and trade balances: rice, sugar, dairy, meat, and fisheries
Across individual food sectors, the November 2026 Food Outlook highlights a split between well-supplied northern hemisphere grains and tightening tropical, sweetener, and marine markets. World rice production is forecast to decline for the first time in four seasons due to falling producer margins and El Niño-related weather shocks, falling short of utilization even though large carry-in stocks keep global rice reserves at their second-highest level on record and rice trade is projected to expand in 2027.
World sugar production is likewise forecast to decline in 2026/27 and fall below global consumption, pushing international sugar prices higher in recent months. In oilcrops, global oilseed production is forecast to reach record levels in 2026/27, but strong vegetable oil demand from the biofuel sector—part of the industrial shifts tracked in our climate trade cooperation coverage—is drawing down global inventories of oils and fats.
Source: FAO Food Outlook, November 2026.
Animal protein and dairy markets show moderate expansion alongside rising input costs. Global meat production is forecast to grow moderately in 2026, led by poultry, while bovine and ovine meat outputs decline amid tight animal availability. Global milk production is forecast to expand by 1.8% in 2026, with international dairy trade rising 2.1% on stronger shipments of milk powders. Meanwhile, global fisheries and aquaculture output is set to edge up just 0.3% in 2026, masking a sharp internal divergence: capture fisheries production is forecast to drop 3.4% as El Niño cuts Peruvian anchoveta catches and high fuel costs squeeze fleets, whereas aquaculture production is forecast to grow 3.6% even as scarce anchoveta pushes up feed costs for shrimp and salmon.
Olive oil’s 3.7 million tonne rebound and livestock margin pressures
Three specialty market features in the November 2026 Food Outlook capture how rapidly supply shocks can reverse—and how input costs ripple through processing chains. First, world olive oil production is provisionally forecast to reach a record high of 3.7 million tonnes in 2026/27, supporting a 6% expansion in global consumption. In Spain, the world’s largest producer, output is forecast to rise 22.7% to 1.6 million tonnes—representing 43.2% of global production, up from an implied 1.30 million tonnes in the prior season. That supply recovery has pushed wholesale extra virgin olive oil prices in Spain down 18.3% year on year in September 2026, while prices in Bari, Italy dropped more than 50% year on year.
Second, FAO highlights the growing economic role of whey in dairy processing. Strong global demand for high-protein whey ingredients for human nutrition and livestock feed is adding value to cheese production, though those gains accrue primarily to processors with specialized whey-processing capacity. Third, rising feed costs—led by oilmeals since early 2026 alongside elevated energy prices—are compressing livestock producer margins, forcing operators to substitute feed ingredients and pursue efficiency gains within nutritional and economic limits.
What to watch
- Strait of Hormuz and spring 2027 fertilizer application: Monitor whether nitrogen production and Gulf export flows recover before northern hemisphere spring planting; prolonged fertilizer unaffordability will weigh on 2027 yields.
- Black Sea storage and export rerouting: Watch whether Greater Odesa and Azov-Black Sea shipments recover above the 0.5 million tonne September 2026 trough or whether stranded wheat inventories suffer quality degradation over winter.
- El Niño impacts on rice and Peruvian anchoveta: Track early 2027 harvest outcomes across Southeast Asian rice producers and South American fisheries, where capture output is already down 3.4%.
- Developing-economy food import financing: Watch external liquidity in low- and middle-income importers facing a 4.9% food import bill increase alongside elevated borrowing costs.
The bottom line
The November 2026 FAO Food Outlook shows a global food system that looks calm only in aggregate. A 1.9% rise in the global food import bill to $2.267 trillion—cushioned by an 11.9% drop in coffee and cocoa import costs—masks a 4.9% food bill jump for low- and middle-income economies, a 9.9% surge in oilseed import costs, a 93.6% collapse in September Black Sea grain shipments, and declining nitrogen fertilizer production. Comfortable headline grain stocks sit in the wrong places, leaving import-dependent developing nations exposed as El Niño and energy-linked input shocks carry into 2027.