International trade policy and global environmental diplomacy have historically operated along separate tracks. Trade negotiators concentrated on lowering borders and securing market access, while environmental delegates negotiated emissions ceilings and adaptation financing.
According to a major primary study published by the United Nations Conference on Trade and Development on 9 November 2026, those tracks have irrevocably converged. In its report, titled Global Trade Update (November 2026): Accelerating climate action requires trade cooperation, the intergovernmental trade body reveals that cross-border commerce has become the decisive transmission mechanism for the global energy transition.
The headline figures demonstrate immense commercial expansion: worldwide exports of manufactured goods linked to solar and wind energy value chains exceeded $1.8 trillion in 2025, outpacing traditional merchandise export growth across the global economy. Concurrently, developing nations generated $1.3 trillion in exports of biodiversity-based products and $1.2 trillion in sustainable ocean goods and services.
Yet this booming trade in decarbonization equipment faces a critical structural bottleneck. UNCTAD’s legal analysis of international treaties reveals an acute implementation gap: while more than half of all trade agreements signed since 2016 now include formal climate clauses, a mere 7% of climate provisions in recent pacts actively reduce tariff or non-tariff barriers on clean technology. Without concerted climate trade cooperation, the multilateral trade system risks blocking the very equipment required to prevent severe macroeconomic losses.
1. The $1.8 trillion clean technology market: trade as a climate engine
The central finding of UNCTAD’s November 2026 update is that international commerce in green technology is no longer an environmental niche; it is now one of the primary drivers of global industrial manufacturing.
Global exports of goods directly tied to solar and wind power supply chains surpassed $1.8 trillion in 2025. This total encompasses photovoltaic wafers, polysilicon cells, assembled solar panels, utility-scale wind turbine nacelles, composite rotor blades, specialized subsea power cables, and advanced power electronics.
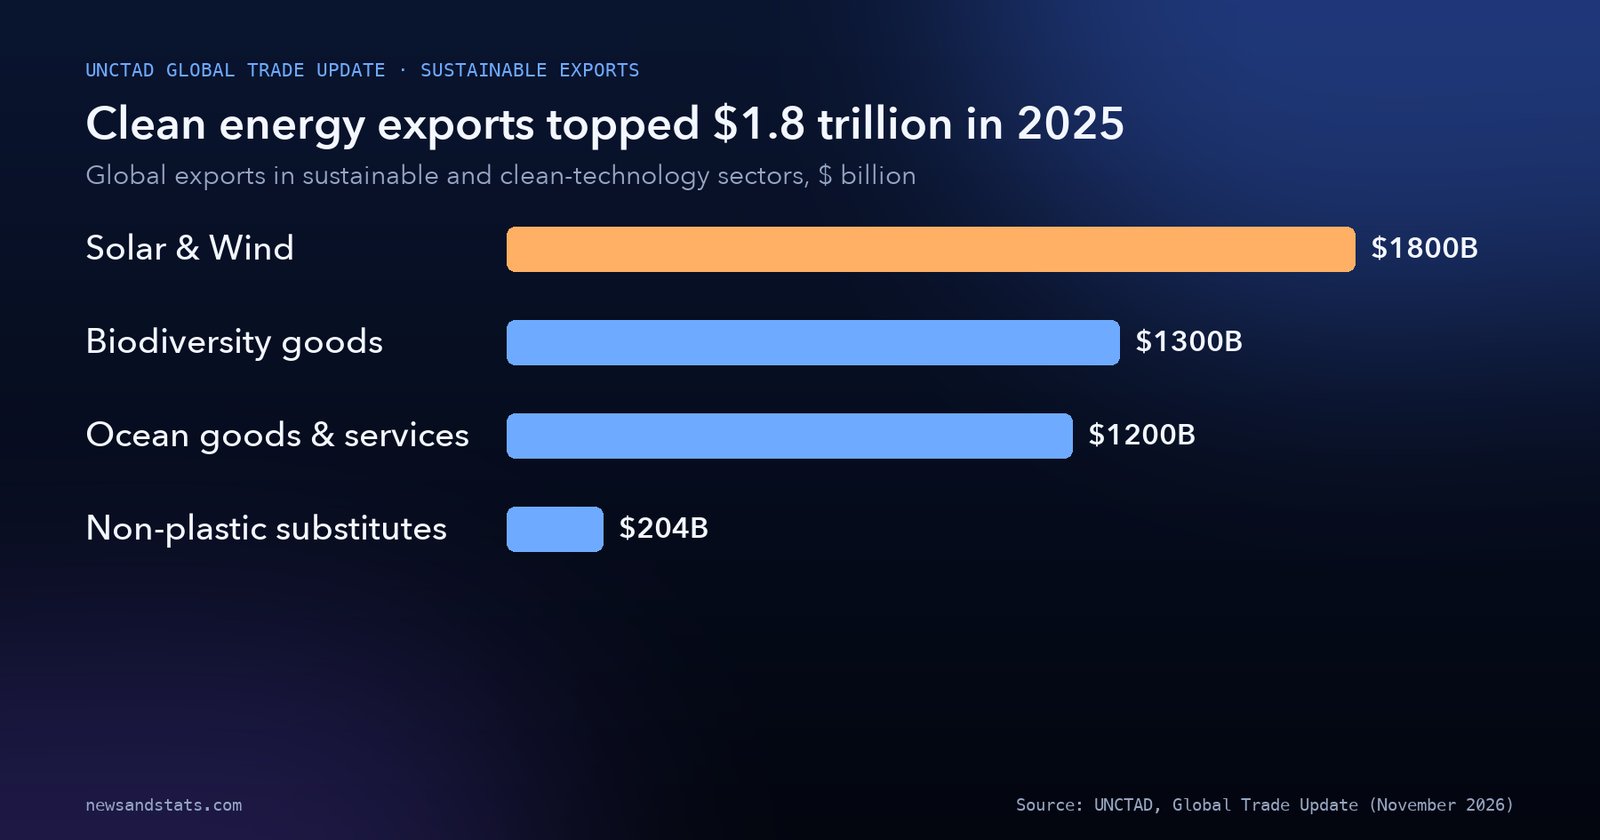
Source: UNCTAD, Global Trade Update (November 2026), Section: Climate technologies are central to adaptation and mitigation.
This $1.8 trillion export volume expanded at an annualized rate significantly above standard industrial goods, demonstrating that global capital investment is rotating decisively toward decarbonization hardware. However, because the production of clean energy equipment relies on specialized geographic value chains—such as mineral refining in East Asia, turbine fabrication in Europe, and assembly in the Americas—open trade corridors are essential to keep equipment affordable.
As documented in our earlier analysis of the global trade outlook and merchandise flows, high-technology manufacturing and energy-enabling equipment have consistently outperformed traditional consumer goods trade. When protectionist tariffs or restrictive import quotas are levied against renewable hardware, the delivered cost of clean power escalates, directly delaying national grid transition targets.
2. The cost of inaction: from 1.4°C warming to a 10% GDP hit
UNCTAD frames the urgency of clean technology trade by comparing equipment costs against the catastrophic economic toll of unmitigated global warming.
Drawing on international meteorological and climate accounting datasets, the report notes that between 2015 and 2025, the Earth recorded its 11 warmest years in modern history. In 2025, the global average surface temperature reached approximately 1.4°C above the pre-industrial average baseline (1850–1900). With global greenhouse gas trajectories continuing their upward trajectory, the world remains on track to breach the critical 1.5°C threshold established under the Paris Agreement.
The macroeconomic consequences of failing to halt this trajectory are staggering:
- At 3°C of warming: The report cites empirical econometric modeling projecting baseline losses equivalent to 10% of global GDP.
- Equatorial vulnerability: In developing countries located closer to the equator, where agricultural systems and labor productivity face acute thermal stress, economic losses are projected to reach 17% of national GDP.
- The high-emissions endpoint: Under an unmitigated high-emissions climate trajectory, cumulative global economic losses are projected to reach 40% of global GDP by 2100.
Subtracting the baseline global loss of 10% from the equatorial developing country loss of 17% reveals a 7-percentage-point vulnerability penalty (my calculation) borne by nations that contributed least to historical emissions. The ratio of 40% long-term GDP destruction to the $1.8 trillion spent annually on renewable exports demonstrates that cross-border investments in climate technology represent a minor fraction of the economic damages they avert.
3. Sustainable sector diversification: $2.7 trillion in nature-based commerce
Beyond utility-scale solar and wind hardware, UNCTAD identifies an expanding commercial universe of sustainable, nature-based exports that provide vital economic diversification for developing nations.
In 2024 and 2025, developing economies generated more than $2.7 trillion in sustainable merchandise and services exports across three distinct industrial categories:
- Biodiversity-based products: Developing economies exported $1.3 trillion ($1,300 billion) in biodiversity-derived goods in 2024, spanning sustainably harvested botanical pharmaceuticals, certified specialty agriculture, natural cosmetics, and bio-resins.
- Sustainable ocean economy: In 2025, developing nations recorded $1.2 trillion ($1,200 billion) in ocean-based goods and services, including eco-certified aquaculture, low-impact coastal tourism, and marine biotechnology.
- Non-plastic substitutes: Global trade in natural, biodegradable alternatives to synthetic plastics—such as jute, sisal, hemp, bamboo, and agricultural crop residue packaging—reached an estimated $204 billion in 2024.
Summing the $1,300 billion in biodiversity goods and $1,200 billion in ocean commerce yields $2,500 billion, and adding the $204 billion in plastic substitutes produces a combined sustainable export total of $2,704 billion (my calculation).
As highlighted in our research on maritime transport and shipping chokepoints, developing countries face immense freight cost penalties when shipping raw agricultural commodities. Expanding processing capacity for bio-based substitutes and circular materials enables emerging markets to capture higher domestic value-add.
Furthermore, as demonstrated in our analysis of global electronic waste and urban mining, transitioning from virgin extraction to circular bio-materials directly mitigates toxic supply chain liabilities while establishing durable export revenue streams.
4. The 7% implementation bottleneck: trade agreements in name only
While the physical volume of clean energy commerce has expanded rapidly, international trade law has failed to keep pace. UNCTAD’s analysis reveals an acute divergence between environmental rhetoric and binding trade policy.
Prior to the adoption of the Paris Agreement, environmental language in commercial treaties was rare. Between 1990 and 2015, only 18% of concluded trade agreements incorporated any climate-related references. Following the 2015 Paris pact, environmental awareness accelerated, with climate provisions appearing in more than 50% of trade agreements signed between 2016 and 2021.
To evaluate whether this legal shift has produced tangible economic results, UNCTAD conducted a comprehensive textual audit of eight landmark trade agreements signed between 2023 and 2025 that explicitly reference the Paris Agreement. The researchers cataloged 179 distinct climate-related provisions across 13 regulatory categories.

Source: UNCTAD, Global Trade Update (November 2026), Section: Climate provisions are spreading across trade agreements.
The results expose a glaring implementation deficit:
- Aspirational language dominates: Approximately 22% of all provisions (40 individual clauses across all 8 agreements) consist of non-binding general declarations of environmental intent.
- Administrative dialogue: An additional 18% of provisions (34 clauses across 7 agreements) establish joint administrative committees and voluntary cooperation statements.
- Technical standards: Standard harmonization and information exchange represent 13% of provisions (23 clauses across 5 agreements).
- Investment integration: Linking climate, trade, and capital investment accounted for 10% of provisions (18 clauses across 6 agreements).
- Tariff and barrier reduction: A mere 7% of all cataloged provisions (13 clauses across 6 agreements) actively eliminate or reduce tariff and non-tariff barriers on climate technologies.
Subtracting the 7% of actionable tariff-cutting provisions from the 40% combined share of aspirational general statements and administrative dialogues (22% + 18%) reveals a 33-percentage-point policy gap (my calculation) between diplomatic rhetoric and commercial liberalization.
| Regulatory category of climate provision | Number of agreements with provision | Total identified provisions | Share of total provisions | Primary legal and economic focus |
|---|---|---|---|---|
| General provisions and environmental intent | 8 of 8 agreements | 40 provisions | 22% of total | Preamble recognition of climate change and Paris goals |
| Cooperation statements and administrative setups | 7 of 8 agreements | 34 provisions | 18% of total | Intergovernmental dialogue and joint working committees |
| Standard harmonization and info exchange | 5 of 8 agreements | 23 provisions | 13% of total | Alignment of energy efficiency and emissions metrics |
| Climate-trade-investment integration | 6 of 8 agreements | 18 provisions | 10% of total | Green foreign direct investment and capital facilitation |
| Tariff and non-tariff barrier reduction | 6 of 8 agreements | 13 provisions | 7% of total | Active elimination of import duties on green hardware |
| Trade facilitation and customs clearance | 5 of 8 agreements | 10 provisions | 6% of total | Expedited port processing for environmental goods |
| Public participation and transparency | 5 of 8 agreements | 10 provisions | 6% of total | Civil society consultations and public reporting |
| Technology transfer and capacity building | 4 of 8 agreements | 9 provisions | 5% of total | Technical assistance and intellectual property licensing |
| Environmental law safeguards | 5 of 8 agreements | 8 provisions | 4% of total | Non-derogation clauses preventing environmental rollbacks |
| Exceptions and sovereign policy space | 4 of 8 agreements | 6 provisions | 3% of total | Legal carve-outs protecting domestic green subsidies |
| Dispute settlement and legal remedies | 4 of 8 agreements | 6 provisions | 3% of total | Binding arbitration mechanisms for environmental breaches |
| SME green support programs | 1 of 8 agreements | 1 provision | 1% of total | Technical export assistance for small green businesses |
| Fossil fuel subsidy reform | 1 of 8 agreements | 1 provision | 1% of total | Disciplines on domestic fossil extraction subsidies |
| Total analyzed climate provisions | 8 trade agreements | 179 provisions | 100% of total | Comprehensive UNCTAD 2023–2025 treaty mapping |
Source: UNCTAD, Global Trade Update (November 2026), Table: Recent trade agreements cover a wide range of climate issues.
This legal disconnect mirrors the challenges documented in our analysis of clean energy innovation and the patent race: while advanced economies file tens of thousands of green patents and subsidize domestic champions, high tariffs and non-tariff customs friction prevent emerging markets from importing that technology affordably.
Only one single provision across all eight audited modern trade agreements addressed fossil fuel subsidy reform, and only one addressed small-business green trade participation. By prioritizing non-binding language over tariff elimination, current trade architecture protects legacy industrial interests at the expense of accelerated deployment.
5. Developing economy technology priorities: adaptation versus mitigation
To determine exactly which environmental technologies are most urgently required across emerging markets, UNCTAD evaluated 41 official Technology Needs Assessments (TNAs) submitted by developing countries since 2015 under the United Nations Framework Convention on Climate Change (UNFCCC).
The analysis reveals a profound structural dichotomy: while international negotiations focus predominantly on mitigation hardware (emissions reduction), developing countries express equal or greater demand for climate adaptation equipment.

Source: UNCTAD, Global Trade Update (November 2026), based on UNEP Copenhagen Climate Centre TNA Dataset.
Emissions mitigation priorities: solar and hydro dominate
Across the 41 national technology assessments:
- Solar energy: Identified as a paramount national priority by 26 developing countries, reflecting the universal viability of distributed photovoltaic arrays.
- Hydropower: Prioritized by 19 nations, representing the essential baseload power source for emerging industrial grids.
- Bioenergy: Selected by 16 countries, focusing on agricultural residue gasification and clean cooking fuels.
- Clean vehicle and fuel technologies: Prioritized by 12 nations, emphasizing commercial fleet electrification and low-carbon transport.
- Energy-efficient appliances: Targeted by 10 countries to mitigate surging residential electricity demand.
- Land transport infrastructure: Identified by 9 nations.
- Forest management for mitigation: Prioritized by 9 nations.
- Conventional power plant efficiency: Targeted by 7 countries.
- Solid waste management: Selected by 6 nations.
- Green building technologies: Prioritized by 4 nations.
As shown in our examination of solar electricity generation growth, solar PV has become the single most economical power source in developing regions. However, when emerging nations face 15% to 25% import tariffs on imported inverters and racking systems, project financing costs escalate dramatically.
Adaptation priorities: securing water and food systems
While clean power captures global headlines, climate adaptation represents an existential economic priority across the Global South. More than half of the 41 evaluated technology assessments prioritized agricultural resilience and hydrological infrastructure:
- Water augmentation: Increasing the capture and storage of surface run-off was identified as a primary requirement by 21 developing nations.
- Increasing crop resilience: Developing drought-resistant and salinity-tolerant seeds was prioritized by 21 countries.
- Farming systems and crop management: Selected by 16 nations.
- Modern irrigation systems: Prioritized by 15 countries, focusing on drip and precision water delivery.
- Water efficiency and demand management: Identified by 14 nations.
- General water management: Targeted by 12 countries.
- Water supply infrastructure and storage: Selected by 11 nations.
- Integrated coastal zone management: Prioritized by 10 countries facing sea-level rise and storm surges.
- Early warning systems and meteorological forecasting: Targeted by 9 nations.
- Silviculture and mixed agroforestry farming: Selected by 9 countries.
Water augmentation and crop resilience tied for the top adaptation priority, each cited by 21 of the 41 surveyed developing nations, representing 51.2% of all assessed countries (my calculation). The technologies required for these systems—such as industrial reverse-osmosis membranes, solar-powered agricultural pumps, precision soil moisture sensors, and coastal flood barriers—are predominantly manufactured in advanced economies. When trade friction impedes the flow of these tools, vulnerable communities absorb direct agricultural output collapses.
6. How trade barriers distort the energy transition
The friction in global green commerce is not merely a matter of statutory tariffs; it encompasses a complex web of technical, regulatory, and financial barriers:
- Tariff escalation on value-added components: While raw mineral ores often face low or zero import duties, processed components—such as lithium-ion battery cells, specialized alloy wind towers, and power transformers—frequently attract significant import tariffs in developing economies seeking to protect uncompetitive local assembly.
- Divergent technical standards: When neighboring countries adopt incompatible grid-tie standards, electrical certification protocols, or efficiency testing methodologies, manufacturers must design custom production runs, destroying economies of scale. UNCTAD notes that 23 provisions across modern trade pacts address standard harmonization, yet regional coordination remains fragmented.
- Local content requirements and subsidies: Massive industrial subsidy packages in major economies frequently condition fiscal support on domestic sourcing. While intended to foster domestic employment, these rules distort global supply chains and disadvantage producers in developing economies that lack fiscal space to match state subsidies.
- Customs bureaucracy and border friction: Only 10 of the 179 analyzed climate provisions addressed trade facilitation and customs clearance. Perishable biological substitutes and critical replacement components for utility grids often sit stranded in customs inspection yards for weeks, inflating inventory holding costs.
To illustrate the economic stakes: if trade barriers inflate the delivered capital cost of solar and water equipment by just 15%, the levelized cost of energy across emerging markets rises sufficiently to keep fossil generators competitive, locking in decades of carbon emissions.
What to watch
- COP31 trade and climate declarations: Monitor whether upcoming ministerial negotiations in Antalya, Turkey formally integrate binding tariff-elimination schedules for the top 50 climate adaptation technologies.
- Expansion of the Environmental Goods Agreement (EGA): Track whether stalled multilateral negotiations at the WTO revive to establish plurilateral duty-free treatment for solar, wind, and water treatment hardware.
- Developing country green export value capture: Watch whether African and Latin American mineral exporters succeed in capturing domestic value in green supply chains, moving beyond raw ore extraction toward local refining and cell manufacturing.
- Harmonization of carbon border adjustment standards: Follow whether major importers align carbon accounting and reporting rules to prevent trade fragmentation and punitive duties against emerging market exporters.
- Deployment of the IEA-UNCTAD emergency clean tech trade facility: Observe whether international development finance institutions establish subsidized trade finance guarantees to support developing nations purchasing $1.8 trillion in renewable hardware.
The bottom line
Global trade has become the indispensable transmission mechanism for the clean energy transition. With cross-border exports of solar and wind equipment surpassing $1.8 trillion and sustainable bio-based exports generating an additional $2.7 trillion, the physical apparatus of global decarbonization is expanding rapidly. Yet an acute legal bottleneck persists: while more than half of modern trade treaties contain environmental rhetoric, only 7% of climate provisions actively dismantle tariff barriers. In an era where 3°C of warming threatens a 10% global GDP collapse and a 17% economic decline across equatorial nations, accelerating binding climate trade cooperation is no longer an idealistic policy choice; it is a fundamental macroeconomic imperative. For detailed structural analysis of international economic indicators, visit our World in Numbers coverage.
Related reading
- Global Trade Outlook 2026: AI Beats the War: multilateral merchandise volumes, services expansion, and shipping route resilience.
- Global Maritime Trade in 8 Numbers: How Chokepoint Rerouting Reshapes Shipping: container freight rates, tanker detours, and ton-mile growth.
- Global Electronic Waste in 8 Numbers: The 62-Million-Tonne Mountain and $62 Billion Lost: circular economy opportunities, urban mining, and critical mineral recovery.
- Clean Energy Innovation in 8 Numbers: The Patent Race, Battery Dominance, and the $55 Billion Squeeze: patent clustering, battery venture capital, and technology transfer hurdles.
- Solar Electricity Generation in 8 Numbers: How Solar PV Met One-Quarter of World Energy Growth: utility-scale photovoltaic capacity, module manufacturing, and grid integration.