The digital economy is expanding at breakneck speed, but its physical exhaust is overwhelming municipal waste management systems worldwide. According to the United Nations Institute for Training and Research (UNITAR) and the International Telecommunication Union (ITU) in their flagship joint report A record 62 million tonnes (Mt) of e-waste was produced in 2022, global electronic waste reached an all-time record of 62 million tonnes.
Discarded electrical and electronic equipment (EEE)—spanning everything from smartphones, laptops, and servers to heat pumps and solar panels—is accumulating five times faster than documented recycling capabilities. While technology manufacturers face acute mineral shortages across the rare earth supply chain, billions of dollars in precious metals and critical raw materials are discarded into municipal landfills or burned in informal scrapyards. Here are the eight numbers from the UN Global E-waste Monitor that reveal the true scale of the world’s fastest-growing waste stream.
1. 62 million tonnes: An all-time record for global discarded hardware
The headline figure of the electronic waste crisis is total physical volume. In the UN’s baseline assessment, the world generated a record 62 million tonnes of e-waste in 2022, averaging 7.8 kilograms for every human on earth.
To visualize 62 million tonnes: it equals the weight of 107,000 of the world’s largest passenger aircraft, enough to form an unbroken queue of planes stretching from New York to Athens or from Hong Kong to Anchorage. It would fill millions of commercial haulage trucks bumper to bumper.
This mountain of discarded hardware has expanded dramatically over the past decade. In 2010, worldwide e-waste generation stood at 34 million tonnes. Our calculation: global e-waste surged by 82.4% between 2010 and 2022, expanding from 34 million tonnes to 62 million tonnes.

Source: UNITAR & ITU, Global E-waste Monitor 2024.
The expansion is propelled by higher consumption, shorter product lifecycles, limited repair options, and the pervasive electrification of everyday consumer items. Small household devices—ranging from vacuum cleaners and microwaves to e-cigarettes—accounted for 20.4 million tonnes (33% of total e-waste), while small IT and telecommunications equipment accounted for 4.6 million tonnes.
2. 82 million tonnes: The mountain grows by 32% by 2030
The trajectory of electronic waste indicates further acceleration. The UN projects that global e-waste generation is rising by 2.6 million tonnes annually, putting the world on track to generate 82 million tonnes of e-waste by 2030.
Our calculation: generating 82 million tonnes in 2030 represents a 32.3% expansion over 2022 levels, adding 20 million additional tonnes of annual waste to global processing infrastructure within eight years.
As UN agencies detail in The world generated 62 million tonnes of electronic waste in just one year and recycled way too little, the surge is outstripping policy adoption. While 81 countries possessed e-waste legislation in 2023 (up from 78 in 2019), only 46 countries have enforced formal collection rate targets, and only 36 have set binding recycling rate targets. In countries without legislation, formal collection rates remain close to zero.
3. 22.3%: Documented formal recycling falls behind
Despite growing consumer awareness, the global recycling rate remains dismal. Less than one-quarter—exactly 22.3% (14 million tonnes)—of all e-waste generated in 2022 was documented as formally collected and recycled in an environmentally sound manner.
Our calculation: 77.7% of the world’s electronic waste—totaling 48 million tonnes—ended up in municipal landfills, was incinerated, or was exported to developing nations for informal, hazardous processing.
Even more troubling is the forward-looking trend. Because global e-waste generation is expanding five times faster than documented recycling infrastructure, the UN projects that the global formal collection and recycling rate will decline from 22.3% in 2022 to 20% by 2030 under business as usual.
This stagnation occurs despite the sophistication of advanced manufacturing and semiconductor supply chains. While foundries deploy atomic-scale lithography to manufacture microprocessors, post-consumer recycling remains dependent on manual collection networks, fragmented logistics, and export loopholes.
4. $91 billion: The mineral treasure inside discarded hardware
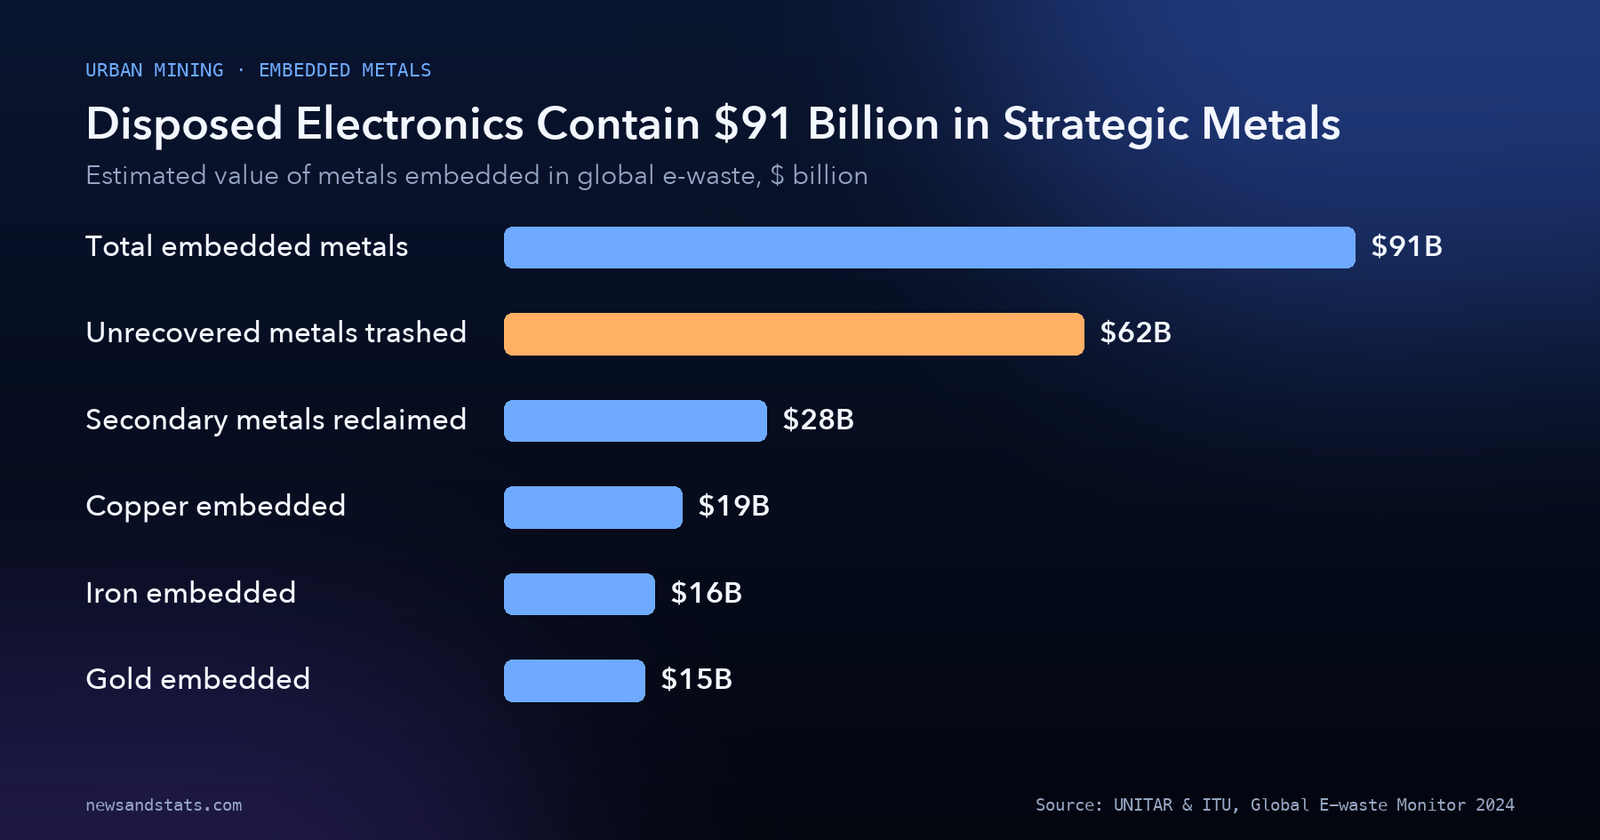
Electronic waste is not merely garbage; it is one of the richest metal deposits on earth. The UN Global E-waste Monitor calculates that 2022 e-waste contained an estimated $91 billion worth of embedded metals.
This metallic wealth includes:
- $19 billion in copper, essential for electrical wiring, motors, and grid transformers.
- $15 billion in pure gold, utilized in corrosion-resistant circuit board contact pins.
- $16 billion in iron and structural steel.
Source: UNITAR & ITU, Global E-waste Monitor 2024.
In total, 2022 e-waste contained 31 million tonnes of embedded metals, 17 million tonnes of plastics, and 14 million tonnes of other substances, including glass, minerals, and composite materials.

Source: UNITAR & ITU, Global E-waste Monitor 2024.
Our calculation: metals accounted for exactly 50.0% of total e-waste mass in 2022 (31 million tonnes out of 62 million tonnes). Discarded printed circuit boards can contain gold concentrations dozens of times richer than naturally occurring gold ore, making electronic scrap exceptionally rich for specialized hydrometallurgical refiners.
5. $62 billion trashed: The economic cost of linear disposal
Because formal collection rates are so low, the vast majority of this embedded mineral value is squandered. The UN reports that in 2022 alone, $62 billion worth of recoverable natural resources was discarded in landfills and open dumps without being reclaimed.
By contrast, documented formal recycling and “urban mining” reclaimed secondary raw materials worth $28 billion (mostly structural iron and copper).
Our calculation: the global economy discarded 2.2 times more mineral value ($62 billion) than it recovered ($28 billion).
The UN emphasizes that closing this gap offers immense economic returns. If global collection and recycling rates were raised to 60% by 2030, the net economic benefits—encompassing reclaimed secondary metals, avoided virgin mining expenditures, and reduced human health hazards—would exceed $38 billion annually.
This economic waste directly impacts energy systems. As analyzed in our examination of surging solar electricity generation, scaling renewable electrification requires massive volumes of refined copper and silver, making urban recycling a critical buffer against primary ore shortages.
6. Just 1%: The near-total failure to recycle rare earths
While structural metals like copper and iron achieve modest recycling rates, the circular economy for critical technology minerals has stalled. The UN report reveals that just 1% of global rare earth element demand is met through e-waste recycling.
Rare earth elements—such as neodymium, dysprosium, and praseodymium—are essential components in permanent magnets for electric vehicle drivetrains, wind turbine generators, hard disk drives, and defense avionics. Because rare earth elements are used in microscopic quantities dispersed across millions of consumer devices, separating and refining them from electronic shredder scrap requires complex, chemical-intensive extraction processes that are commercially uncompetitive against primary subsidized mining.
As global power systems face power grid bottlenecks and transmission constraints, failing to establish domestic secondary recycling loops leaves Western manufacturing entirely dependent on foreign primary mineral monopolies.
7. 2.4 million tonnes: The looming wave of decommissioned solar panels
The global transition to zero-carbon energy is creating its own massive downstream waste challenges. The UN reports that the mass of retired photovoltaic (PV) solar panels is expected to surge to 2.4 million tonnes by 2030.
This 2.4 million tonnes represents a fourfold expansion over the 600,000 tonnes of solar panel scrap generated in 2022.
Our calculation: solar panel waste will expand by 300% (a 1.8 million tonne increase) between 2022 and 2030.
Early-generation utility solar installations constructed between 2005 and 2015 are reaching their 20- to 25-year operational end-of-life, while repowering projects replace functional panels with high-efficiency modules. Photovoltaic modules consist primarily of glass, aluminum frames, and silicon cells, but also contain recoverable silver, copper, and hazardous lead. Establishing specialized solar recycling infrastructure is essential to prevent clean energy hardware from becoming an environmental liability.
As detailed in our comparison of the economic gap between India and China, China manufactures the overwhelming majority of global solar panels, positioning Chinese industrial centers to pioneer high-throughput recycling technologies as regional solar farms reach decommissioning maturity.
8. 93 million tonnes CO2: The environmental dividend of formal recycling
Properly managed electronic recycling provides immediate climate benefits. Documented formal e-waste management avoided an estimated 93 million tonnes of carbon dioxide equivalent (CO2e) emissions in 2022.
This 93 million tonne mitigation dividend breaks down into two distinct mechanisms:
- 52 million tonnes of CO2e avoided by displacing virgin metals mining with reclaimed secondary materials.
- 41 million tonnes of CO2e avoided by safely recapturing potent greenhouse gas refrigerants from discarded air conditioners and refrigerators.
Furthermore, documented recycling avoided 900 million tonnes of primary ore extraction, sparing natural ecosystems from heavy open-pit excavation and tailings contamination.
Conversely, informal e-waste handling continues to release toxic pollutants. The UN notes that substantial volumes of mercury and plastic containing hazardous brominated flame retardants are released into the environment annually due to non-compliant e-waste disposal, exposing informal workers to chronic neurological and developmental hazards.
How to read the Global E-waste Monitor numbers
Interpreting international e-waste statistics requires understanding five critical waste-stream distinctions:
- E-waste generated differs from e-waste collected. Generated mass (62 million tonnes) models the volume of electrical items that reached end-of-life. Documented collected mass (14 million tonnes) captures only hardware processed through licensed, environmentally compliant recycling channels.
- Per capita metrics reveal geographic disparities. While global e-waste averaged 7.8 kg per person, European consumers generated 17.6 kg per person, while African consumers generated an average of 2.5 kg per person.
- Embedded value is not net profit. An estimated $91 billion in embedded metals represents gross raw material value. Reclaiming that wealth requires collection logistics, automated shredding, chemical refining, and toxic residue management, which consume significant operational expenditure.
- Informal recycling is hazardous processing, not formal recovery. In developing nations, informal “backyard recyclers” use acid baths and open-air burning to extract high-value gold and copper, releasing heavy metal pollution while recovering less than 50% of available metals and discarding rare earths entirely.
- Legislation requires enforcement targets. Passing extended producer responsibility (EPR) laws does not guarantee circularity. Only countries with specific, audited collection quotas achieve substantially higher formal recycling rates.
The global e-waste crisis at a glance
The following table summarizes the primary metrics established in the UN Global E-waste Monitor 2024 across waste generation, recycling rates, material value, and environmental dividends.
| Metric | Measured value | Reporting benchmark | Key environmental or industrial driver | Source |
|---|---|---|---|---|
| Global e-waste generation | 62 million tonnes | Calendar 2022 | Record high; averaged 7.8 kg per capita worldwide | UN Global E-waste Monitor 2024 |
| Global e-waste generation 2030 | 82 million tonnes | 2030 projection | On track to expand 32% (rising 2.6 Mt annually) | UN Global E-waste Monitor 2024 |
| Documented recycling volume | 14 million tonnes | Calendar 2022 | Represents only 22.3% of total generated waste | UN Global E-waste Monitor 2024 |
| Projected recycling rate 2030 | 20% formal recycling | Business-as-usual | Generation outpaces collection infrastructure | UN Global E-waste Monitor 2024 |
| 60% recycling economic benefit | $38 billion net benefit | 2030 target scenario | Reclaimed metals and reduced public health costs | UN Global E-waste Monitor 2024 |
| Total embedded metals value | $91 billion | Calendar 2022 | Embedded mineral wealth across electronic scrap | UN Global E-waste Monitor 2024 |
| Unrecovered metals trashed | $62 billion | Calendar 2022 | Lost in landfills and open dumps annually | UN Global E-waste Monitor 2024 |
| Secondary metals reclaimed | $28 billion | Calendar 2022 | Reclaimed via formal urban mining refiners | UN Global E-waste Monitor 2024 |
| Embedded copper value | $19 billion | Calendar 2022 | Essential conductor for energy transition | UN Global E-waste Monitor 2024 |
| Embedded iron value | $16 billion | Calendar 2022 | Primary structural constituent by weight | UN Global E-waste Monitor 2024 |
| Embedded gold value | $15 billion | Calendar 2022 | Found in high concentrations on circuit boards | UN Global E-waste Monitor 2024 |
| Total embedded metals mass | 31 million tonnes | Calendar 2022 | Represents exactly 50% of total e-waste weight | UN Global E-waste Monitor 2024 |
| Rare earths e-waste recycling rate | 1% of global demand | Calendar 2022 | Near-total failure to recycle critical magnet elements | UN Global E-waste Monitor 2024 |
| Retired solar panels 2030 | 2.4 million tonnes | 2030 projection | Fourfold surge from 600,000 tonnes in 2022 | UN Global E-waste Monitor 2024 |
| Greenhouse emissions avoided | 93 million tonnes CO2e | Calendar 2022 | Avoided metals mining (52 Mt) and refrigerants (41 Mt) | UN Global E-waste Monitor 2024 |
| Avoided primary ore extraction | 900 million tonnes | Calendar 2022 | Material recovery spares natural ecosystems | UN Global E-waste Monitor 2024 |
| Nations with e-waste laws | 81 countries | 2023 status | 67 have extended producer responsibility laws | UN Global E-waste Monitor 2024 |
Sources: UNITAR & ITU, Global E-waste Monitor 2024 and ITU Hub.
What to watch
- The implementation of European Union Right to Repair directives and Ecodesign for Sustainable Products Regulations, monitoring whether standardized repairability scores slow e-waste generation.
- The commercial development of automated robotic disassemblers and hydrometallurgical recycling facilities dedicated to reclaiming rare earth magnets.
- Legislative updates in emerging economies, assessing whether more developing nations adopt binding collection targets beyond the 46 countries currently enforcing quotas.
- The expansion of dedicated solar panel recycling regulations in the United States and China ahead of the projected 2.4-million-tonne decommissioning wave in 2030.
- International crackdowns on illegal transboundary e-waste dumping under the Basel Convention’s electronic waste amendments.
- Progress toward the UN’s 60% recycling target, observing whether international investments can capture the $38 billion circular economy opportunity.
The bottom line
The global electronic waste crisis represents an extraordinary failure of linear resource consumption: the world produced a record 62 million tonnes of e-waste in 2022, but officially recycled only 22.3%, allowing $62 billion worth of recoverable natural resources to be trashed in landfills. With e-waste generation on track to surge 32% to 82 million tonnes by 2030 and rare earth recycling languishing at just 1%, technology supply chains are consuming primary minerals at an unsustainable pace while discarding vast urban mines. Bridging this gap through enforceable collection targets and advanced recycling infrastructure could unlock $38 billion in net economic benefits while avoiding nearly 100 million tonnes of greenhouse gas emissions annually. For the broader macroeconomic context shaping global industrial flows, explore our review of the macroeconomic environment from the IMF, and visit our World in Numbers section for continuing coverage of global development benchmarks.
Related reading
- Solar Electricity Generation in 8 Numbers: How Solar PV Met One-Quarter of World Energy Growth: renewable installations, capacity additions, and energy transition milestones.
- Five Million Robots in Factories: The Global Automation Surge in 8 Numbers: advanced manufacturing automation, industrial equipment, and factory production.
- India vs China: the economic gap in 10 numbers: manufacturing capacity, national infrastructure investment, and economic growth compared.