
The era of ultra-low interest rates and quantitative easing has officially given way to a high-volume, high-cost debt environment. Rather than shrinking public obligations as post-pandemic economies normalized, governments across the world’s most advanced nations are borrowing at volumes never witnessed outside global emergencies. According to the Organisation for Economic Co-operation and Development (OECD) in its landmark release With pressures rising in global debt markets, maintaining resilience will require sound public finances, strong institutions and policies that support growth and innovation and its flagship study Sovereign borrowing outlook: Global Debt Report 2026, global bond markets have reached an unprecedented scale of $109 trillion.
Across the 38 industrialized democracies of the OECD, central governments accumulated an all-time record of $61 trillion in marketable bond debt in 2025, up from $55 trillion just twelve months prior. Gross borrowing jumped to $17 trillion in 2025 and is projected to rise to $18 trillion in 2026. Yet the most pressing fiscal vulnerability is not new deficits; it is the sheer volume of maturing obligations. Nearly 80% of all sovereign borrowing—totaling $13.5 trillion in 2025—is consumed entirely by rolling over legacy debt issued during the low-yield decade. Here are the eight numbers that explain the structural shifts across advanced sovereign debt markets, the rising cost of public borrowing, and the mechanics of the $13.5 trillion refinancing wall.
1. $61 trillion: Outstanding OECD sovereign debt hits an all-time high
The headline benchmark of advanced economy leverage is total outstanding central government marketable debt. In 2025, OECD sovereign debt reached $61 trillion, marking the largest nominal annual increase since the height of the COVID-19 pandemic in 2020.
Between 2020 and 2025, the debt stock expanded from $49 trillion to $61 trillion. Our calculation: central government marketable debt across OECD nations expanded by 24.5% over five years, adding $12 trillion in net obligations to international capital markets.

Source: OECD, Global Debt Report 2026.
Currency fluctuations contributed meaningfully to the nominal surge. Approximately one-third of the $6 trillion increase from 2024 to 2025 stemmed from US dollar depreciation against the euro (12%) and the British pound (7%). Holding exchange rates constant, the 2025 debt stock stood at $59 trillion—still an undisputed historical record.
As a share of output, the OECD aggregate debt-to-GDP ratio held steady at 83% in 2025 due to nominal economic growth, but is projected to rise to 85% in 2026, coming within four percentage points of the pandemic peak. While our earlier analysis documented sovereign debt distress across vulnerable economies, the OECD findings confirm that balance sheet pressures are now equally concentrated among the world’s wealthiest nations.
2. $17 trillion: Annual gross borrowing sets a new annual benchmark
To sustain these obligations, sovereign debt management offices (DMOs) mobilized unprecedented primary issuance. Gross borrowing by central governments in OECD countries reached a record $17 trillion in 2025, up 7% from nearly $16 trillion in 2024.
Gross borrowing requirements are on track to climb further, reaching approximately $18 trillion in 2026. This translates to an aggregate borrowing volume equivalent to 23% of OECD GDP in 2025, rising to 24% of GDP in 2026.
However, aggregate borrowing figures are heavily skewed by the largest global issuers. For the median OECD country, gross borrowing stood at 9% of GDP in 2025, well below the 23% area-wide aggregate, and is projected to decline to 8% in 2026. In smaller nations such as Estonia, Greece, and Ireland, sovereign debt managers reported that declining borrowing needs represented their primary operational challenge.
Meanwhile, net borrowing—the additional funding required to finance active fiscal budget deficits—stood at $3.5 trillion in 2025 and is projected to climb to nearly $4 trillion in 2026. Net borrowing has consistently hovered at 5% of GDP every year since 2023, sitting two percentage points above pre-pandemic averages, consistent with broader macroeconomic growth and inflation forecasts from the IMF.
3. $13.5 trillion: The refinancing wall absorbs 80% of borrowing
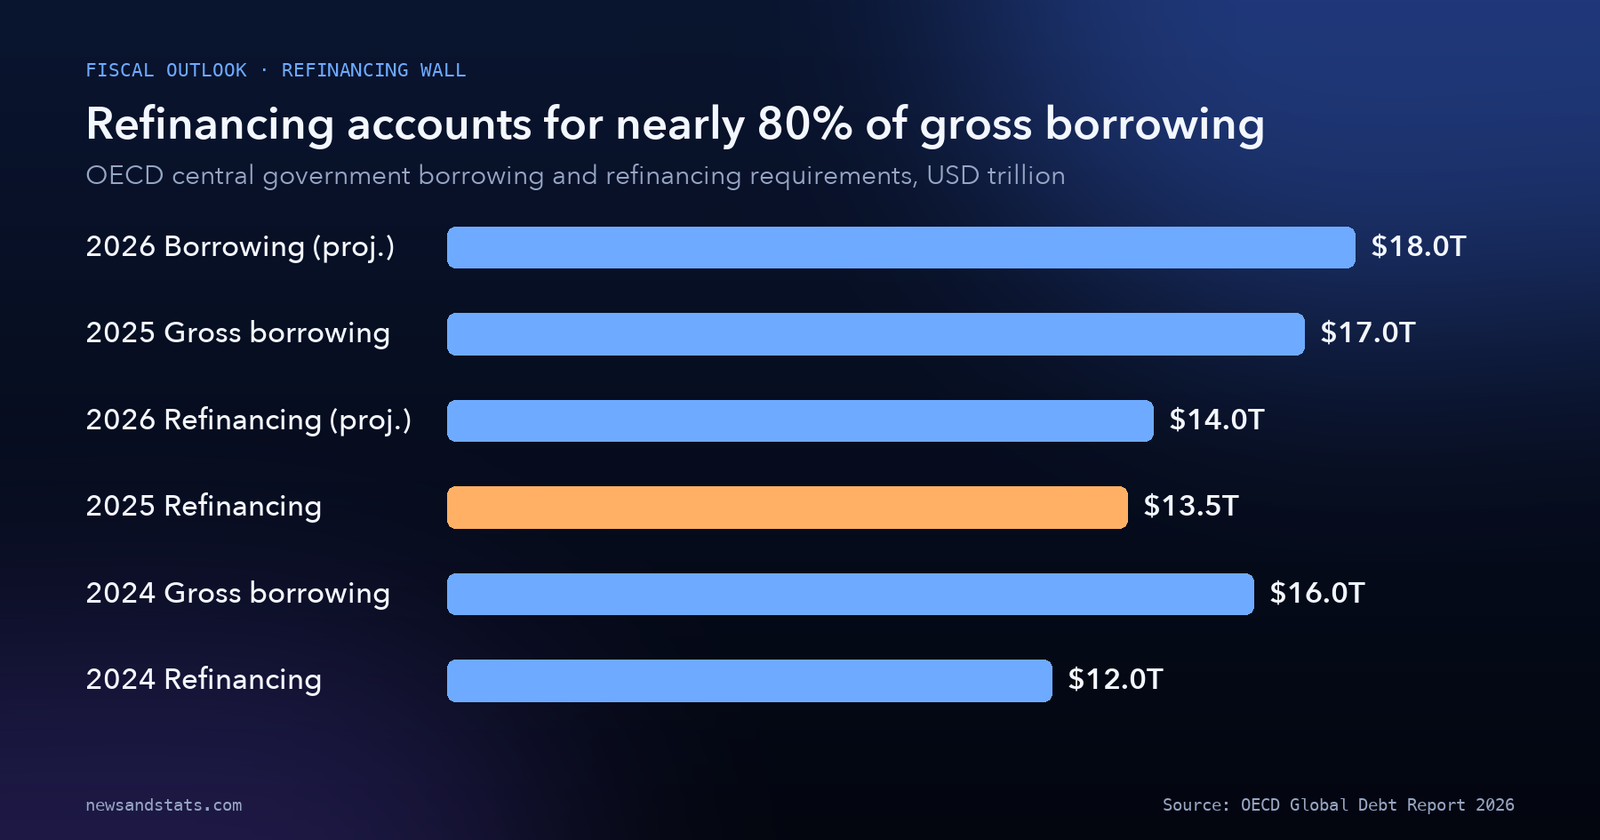
The most critical finding in the OECD’s 2026 outlook is that modern sovereign borrowing is primarily an exercise in rolling over existing debt rather than funding new public services. In 2025, refinancing requirements hit an all-time record of $13.5 trillion, accounting for nearly 80% of total gross borrowing.
Refinancing requirements increased from around $12 trillion in 2024 to $13.5 trillion in 2025, and the OECD projects they will expand further to $14 trillion in 2026. At $13.5 trillion, annual refinancing absorbed 19% of total OECD gross domestic product, nearing the record levels reached immediately following the pandemic shock in 2021.
Source: OECD, Global Debt Report 2026.
Our calculation: out of the $17 trillion borrowed in 2025, only $3.5 trillion represented net new liquidity entering government coffers, while $13.5 trillion was immediately recycled back to bondholders to settle maturing paper.
This rollover pressure exposes treasuries to acute duration risk. Bonds issued during the pandemic with zero or near-zero coupons are maturing today and must be reissued at prevailing secondary market yields that are roughly two percentage points higher, permanently ratcheting up future interest obligations.
4. 70%: The United States dominates the OECD refinancing schedule
Rollover liabilities are extraordinarily concentrated among a few heavyweight sovereign issuers. The OECD report reveals that the United States and Japan together account for close to 80% of all refinancing requirements across the entire 38-country OECD area.
However, the balance between these two giants has shifted dramatically over the past five years:
- The United States accounted for 70% of total OECD refinancing requirements in 2025, up from 57% in 2020.
- Japan accounted for 7% of OECD refinancing requirements in 2025, down from 16% in 2020.
Our calculation: the United States alone was responsible for approximately $9.45 trillion of the $13.5 trillion in OECD debt that matured and was refinanced in 2025.
The American dominance of refinancing schedules reflects heavy reliance on short-term Treasury bills and two-year notes to finance large post-pandemic federal deficits. In corporate markets, an analogous concentration is emerging: the OECD documents that nine technology “hyperscalers” raised $122 billion in corporate bonds in 2025—accounting for nearly half of all tech bond issuance globally—as corporate borrowing mirrors public debt expansion to fund capital investments across hyperscaler infrastructure.
5. 3.3% of GDP: Interest burdens outpace inflation relief
For years following the inflation surge of 2021 and 2022, governments benefited from the “inflation dividend”: elevated nominal GDP growth mechanically lowered debt-to-GDP ratios even as debt stocks grew. In 2026, that dynamic has completely reversed.
In 2025, aggregate OECD government interest expenditures stood at 3.3% of GDP, hovering just beneath the ten-year peak of 3.4%. For the average individual OECD issuer, interest spending stood near 2% of GDP.
Crucially, the OECD’s debt decomposition model indicates that 2026 marks a decisive tipping point:
- Rising interest payments are projected to add 2.5 percentage points to the aggregate OECD debt-to-GDP ratio in 2026.
- Fading inflation is projected to reduce the ratio by only 2.4 percentage points.
Our calculation: for the first time in five years, the net contribution of interest costs and inflation will turn positive (+0.1 percentage points), actively driving public debt ratios upward rather than melting them away.
This mechanical squeeze removes fiscal flexibility across finance ministries. As analyzed in our review of the fiscal burdens of energy subsidies, governments that locked in massive floating liabilities face structural budgetary constraints that restrict funding for public infrastructure, defense commitments, and social safety nets.
6. 47%: Treasury bills match fixed-rate bonds in borrowing volume
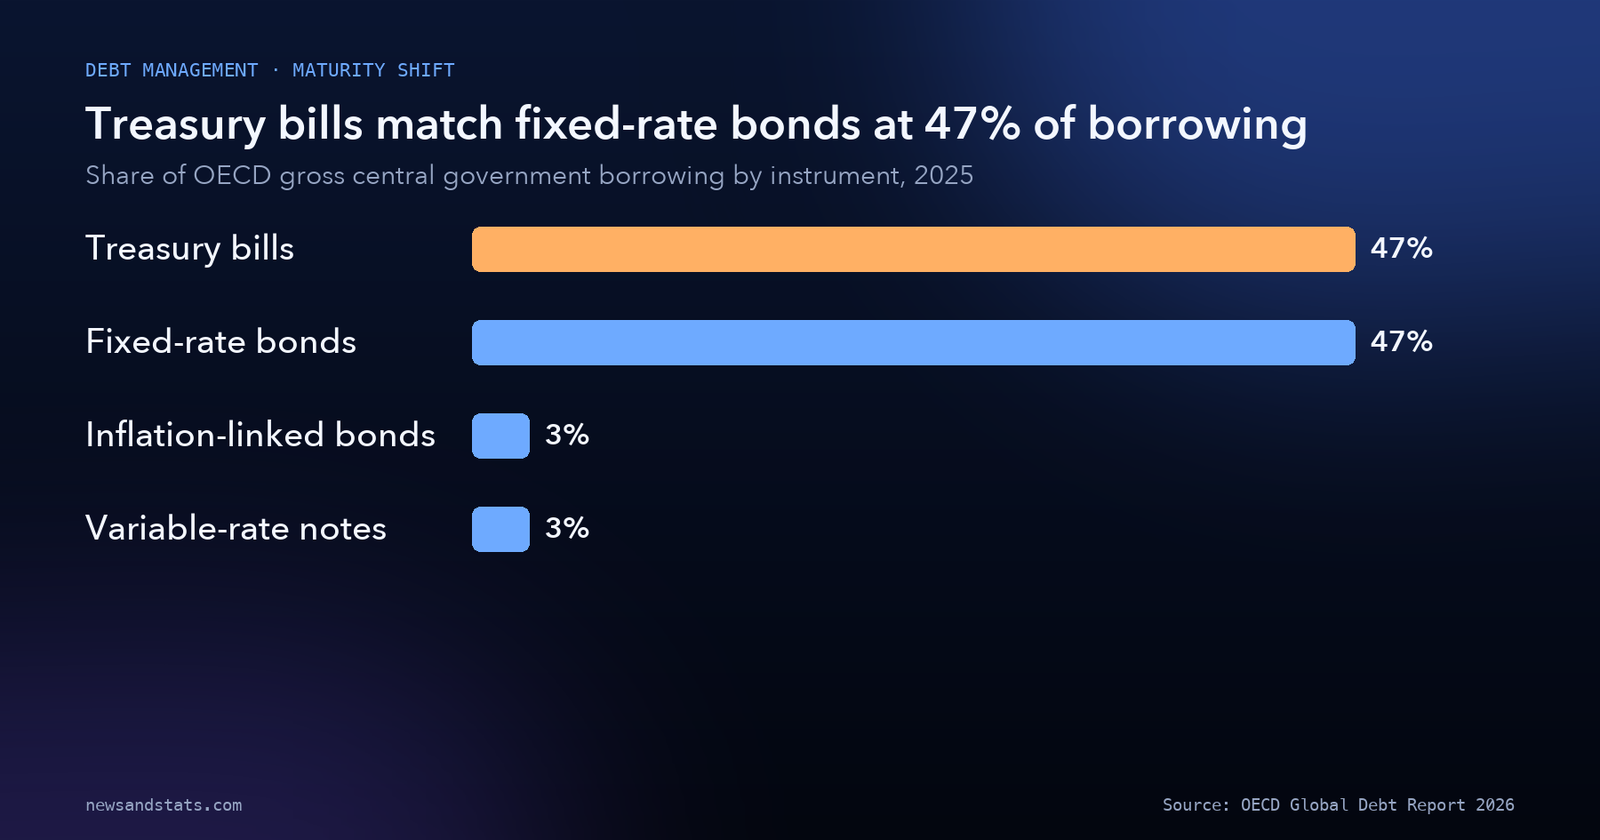
In response to elevated long-term borrowing costs, debt management offices have executed a major strategic pivot: shortening the maturity of new issuance. In 2025, Treasury bills (debt maturing in one year or less) accounted for 47% of total OECD gross borrowing, exactly matching the 47% share captured by long-term fixed-rate bonds.
Source: OECD, Global Debt Report 2026.
This marks the consolidation of a post-pandemic shift. Prior to 2020, fixed-rate bonds dominated sovereign financing, while T-bills served as temporary cash management tools. Today, T-bills represent 15% of the total outstanding OECD debt stock—five percentage points higher than the 2015-2019 pre-pandemic average.
The maturity retreat is most pronounced at the long end of the yield curve:
- The volume ratio of fixed-rate bonds with maturities of 30 years or more compared to 1-to-5-year bonds dropped to 6% in 2025, the lowest level since at least 2008.
- 16 of 26 regular OECD T-bill issuers maintained higher T-bill issuance shares in 2025 than their pre-pandemic averages.
- The average term-to-maturity (ATM) across the OECD debt stock fell or remained flat in a majority of member states, standing at an average of 8 years in 2025 (ranging from 4.25 years in Türkiye to 13.7 years in South Korea).
By issuing shorter-dated paper, treasuries avoid locking in 4% to 5% yields for three decades. However, this tactic shortens portfolio duration, accelerating the pace at which debt must be rolled over and compounding future refinancing vulnerability.
7. $14 trillion: Emerging market debt stock hits a post-2007 record
While advanced OECD members manage refinancing hurdles, emerging market and developing economies (EMDEs) are confronting record debt stocks. Central government marketable debt in EMDEs reached $14 trillion in 2025, following a gross borrowing surge that crossed $4 trillion in a single year.
This $14 trillion debt stock is equivalent to 30% of EMDE gross domestic product, representing the highest debt-to-GDP ratio recorded across emerging markets since at least 2007.
The expansion was heavily driven by the top five emerging borrowers, who accounted for 78% of total EMDE issuance in 2025: China, India, Brazil, Egypt, and Argentina. The sustained borrowing by Asian giants reinforces the widening manufacturing divergence between India and China and their respective fiscal financing requirements.
Crucially, emerging markets demonstrated greater resilience than in prior tightening cycles:
- Non-OECD EMDE sovereign bond debt stood at $12.1 trillion in 2025.
- The share of foreign-currency-denominated debt in low-income nations fell from 18.7% in 2019 to 7.6% in 2025, insulating domestic budgets from exchange rate devaluations.
- However, near-term rollover hurdles remain severe: 36% of all outstanding EMDE sovereign bonds mature within three years, and low-income countries face an acute squeeze, with more than half of their outstanding bonds maturing by 2028.
8. 0.84%: Term premia climb to a ten-year peak as investor bases shift
The underlying catalyst forcing governments into shorter maturities is the steepening of sovereign yield curves and the resurgence of the term premium. The OECD report documents that the average 10-year term premium across major OECD bond markets reached 0.84% at the end of 2025, its highest level in more than ten years.
Between 2019 and 2022, estimated term premia were consistently negative, suppressed by aggressive central bank quantitative easing (QE). As central banks initiated quantitative tightening (QT) and reduced their balance sheets, the composition of the debt buyer base underwent a structural transformation:
- Central banks, which operated as price-insensitive buyers, have steadily retrenched.
- Marginal debt absorption has shifted to price-sensitive private buyers, including hedge funds, asset managers, and retail households.
- In 2025, 30-year sovereign yields rose in 21 of 23 OECD countries with available data, with median long-end yields climbing above 4% over the course of 2025.
To compensate for price volatility, interest rate uncertainty, and record bond supply, private investors demand a positive term premium of 84 basis points to hold 10-year paper. For debt managers, this higher hurdle rate makes issuing long-term bonds financially punitive, cementing the structural reliance on Treasury bills.
How to read sovereign debt metrics
Interpreting international sovereign debt statistics requires understanding five core methodological conventions established by the OECD:
- Marketable debt differs from general government debt. The OECD Sovereign Borrowing Outlook focuses strictly on central government marketable securities (tradable bonds and bills). It excludes non-marketable bilateral loans, currency deposits, and municipal debt. Marketable debt accounts for the vast majority of aggregate OECD central government debt and provides a precise measure of capital market exposure.
- Gross borrowing includes redemptions; net borrowing does not. Gross borrowing ($17 trillion) measures total cash that must be raised across the year, including refinancing maturing paper. Net borrowing ($3.5 trillion) measures only the net cash deficit financing added to the debt pile.
- Nominal debt stock differs from constant-currency valuation. While OECD debt expanded by $6 trillion in 2025 to $61 trillion, $2 trillion of that increase was an accounting artifact of US dollar depreciation against the euro and pound. Constant-exchange-rate debt was $59 trillion.
- Average term to maturity (ATM) dictates rollover speed. An ATM of 8 years indicates that the average bond in the debt stock matures in eight years. A lower ATM reduces interest costs during rate cuts but increases vulnerability when yields remain elevated.
- Term premium represents compensation for duration risk. Long-term yields are not merely an average of expected future central bank rates; they include a term premium that fluctuates based on bond supply, inflation risk, and investor risk appetite.
The OECD sovereign debt outlook at a glance
The following table summarizes the core metrics and projections established in the OECD Global Debt Report 2026 across sovereign debt stocks, borrowing flows, refinancing requirements, and pricing benchmarks.
| Metric | Measured value | Reporting benchmark | Core economic or financial driver | Primary source |
|---|---|---|---|---|
| Total global bond market size | $109 trillion | Year-end 2025 | Stands at 93% of world GDP, up from 81% in 2015 | OECD Global Debt Report 2026 |
| Combined global market borrowing 2026 | $29 trillion | 2026 projection | Governments and corporations; up 17% from 2024 | OECD Global Debt Report 2026 |
| Combined global market borrowing 2025 | $27 trillion | Calendar 2025 | Record borrowing across public and corporate sectors | OECD Global Debt Report 2026 |
| OECD central government debt stock | $61 trillion | Year-end 2025 | All-time high; up from $55 trillion in 2024 | OECD Global Debt Report 2026 |
| Constant-exchange-rate debt stock 2025 | $59 trillion | Year-end 2025 | Adjusts for 12% USD depreciation against EUR | OECD Global Debt Report 2026 |
| OECD gross sovereign borrowing 2025 | $17 trillion | Calendar 2025 | Record volume; equivalent to 23% of OECD GDP | OECD Global Debt Report 2026 |
| Projected gross borrowing 2026 | Around $18 trillion | 2026 projection | Driven by rising refinancing and persistent deficits | OECD Global Debt Report 2026 |
| OECD annual refinancing requirements | $13.5 trillion | Calendar 2025 | Represents nearly 80% of total gross borrowing | OECD Global Debt Report 2026 |
| Projected refinancing requirements 2026 | $14 trillion | 2026 projection | Equals 19% of aggregate OECD gross domestic product | OECD Global Debt Report 2026 |
| US share of OECD refinancing | 70% share | Calendar 2025 | Up from 57% in 2020; US and Japan represent near 80% | OECD Global Debt Report 2026 |
| Japan share of OECD refinancing | 7% share | Calendar 2025 | Down from 16% in 2020 as fiscal balance improved | OECD Global Debt Report 2026 |
| OECD net sovereign borrowing 2025 | $3.5 trillion | Calendar 2025 | Stood at 5% of GDP, 2 p.p. above pre-pandemic average | OECD Global Debt Report 2026 |
| Projected net borrowing 2026 | Nearly $4 trillion | 2026 projection | Second-highest level on record after 2020 ($7T) | OECD Global Debt Report 2026 |
| OECD aggregate debt-to-GDP ratio | 83% of GDP | Year-end 2025 | Projected to climb to 85% in 2026 (near 2020 peak) | OECD Global Debt Report 2026 |
| OECD sovereign interest expenditures | 3.3% of GDP | Calendar 2025 | Near 10-year peak of 3.4%; average issuer near 2% | OECD Global Debt Report 2026 |
| Treasury bill share of debt stock | 15% of debt stock | Year-end 2025 | Up 5 p.p. from 2015-2019 pre-pandemic average | OECD Global Debt Report 2026 |
| Gross borrowing share of T-bills | 47% share | Calendar 2025 | Matched fixed-rate bonds at 47% of total borrowing | OECD Global Debt Report 2026 |
| 30-year to 1-5 year bond issuance ratio | 6% ratio | Calendar 2025 | Lowest long-duration issuance share since 2008 | OECD Global Debt Report 2026 |
| EMDE central government debt stock | $14 trillion | Year-end 2025 | Equivalent to 30% of GDP, highest since 2007 | OECD Global Debt Report 2026 |
| Non-OECD EMDE sovereign debt | $12.1 trillion | Year-end 2025 | Gross borrowing crossed $4 trillion in 2025 | OECD Global Debt Report 2026 |
| Average 10-year term premium | 0.84% (84 bps) | End-2025 | Highest in over a decade; reflects private buyer shift | OECD Global Debt Report 2026 |
Sources: OECD, Global Debt Report 2026 Press Release and Sovereign Borrowing Outlook Full Report.
What to watch
- Primary dealer balance sheet absorption limits, monitoring whether upcoming sovereign auctions experience lower bid-to-cover ratios or yield tailing.
- The pace of central bank balance sheet runoff under quantitative tightening, evaluating when the Federal Reserve and European Central Bank conclude passive portfolio reductions.
- Issuance remit adjustments by national debt management offices, observing whether treasuries re-extend duration into long-term bonds if yield curves flatten.
- Corporate debt competition from technology hyperscalers, tracking whether multi-billion-dollar corporate bond offerings crowd out mid-sized corporate and municipal issuers.
- Foreign exchange volatility and term premia in emerging market economies, observing whether nations with heavy 2026-2028 rollover schedules maintain access to international bond markets.
- Fiscal consolidation packages in major economies, tracking whether legislative efforts successfully narrow primary deficits to stabilize debt-to-GDP ratios before 2027.
The bottom line
The global debt landscape has entered a structurally more demanding regime: total worldwide bond debt reached $109 trillion in 2025, while OECD central governments accumulated an all-time record of $61 trillion in marketable debt obligations. With gross sovereign borrowing climbing to $17 trillion and nearly 80% consumed by an unrelenting $13.5 trillion refinancing wall, public debt management is increasingly constrained by elevated term premia and the withdrawal of central bank demand. By leaning heavily on Treasury bills to match fixed-rate bonds at 47% of borrowing, finance ministries have averted near-term yield spikes at the expense of shortening debt maturities and compounding future rollover exposure. As interest payments outpace inflation relief to push aggregate OECD debt ratios toward 85% of GDP in 2026, fiscal discipline and debt market resilience will define sovereign creditworthiness for the remainder of the decade. For continuing coverage of international economic benchmarks and fiscal policy developments, visit our World in Numbers section.
Related reading
- 68 Low-Income Countries, Ranked by Debt Risk: 10 Are Already in Distress: external debt distress, PRGT concessional loans, and sovereign restructuring frameworks.
- The world economy in 8 numbers: what the IMF’s October 2026 outlook says: global economic growth benchmarks, inflation trajectories, and world trade volumes.
- Central Bank Gold Buying in Q2 2026 as the Price Eased From a Record: official foreign reserve diversification, central bank asset purchases, and gold price trends.