Global commodity markets have collided with an unprecedented confluence of structural supply shocks. Rather than experiencing localized price swings confined to a single sector, international trade is absorbing simultaneous disruptions across crude oil, natural gas, agricultural staples, industrial base metals, and agricultural fertilizers. According to the World Bank Group in its comprehensive press release Commodity Prices Set to Increase by 23% in 2026 as Global Shocks Mount and its flagship research portal Commodity Markets, overall commodity prices are forecast to surge by 23% in 2026.
Drawing on primary data published in the Commodity Markets Outlook, October 2026, the global raw materials basket is reversing three consecutive years of post-pandemic deflation. Severe regional hostilities across the Middle East have drained global petroleum stockpiles, severe El Niño weather patterns threaten international cereal harvests, and accelerated energy transition investments have driven base metals to historic highs. Here are the eight numbers that explain the mechanics of the 2026 commodity price surge, the propagation of energy volatility into agricultural inputs, and the escalating risks confronting vulnerable economies.
1. 23%: Global commodity index marks sharpest annual acceleration since 2022
The headline benchmark of international raw material costs is the World Bank’s broad commodity price index. In 2026, overall commodity prices are projected to increase by 23%, marking the largest nominal annual acceleration observed since the initial commodity shock of 2022.
This broad-based surge touches every primary commodity grouping:
- Precious metals lead all sectors with a projected 40% price increase.
- Energy prices rank second, surging by 32% over 2025 levels.
- Industrial base metals follow closely, climbing by 25% to all-time highs.
- Agricultural fertilizers are set to advance by 14%.
- Food commodities are projected to increase by 10%.
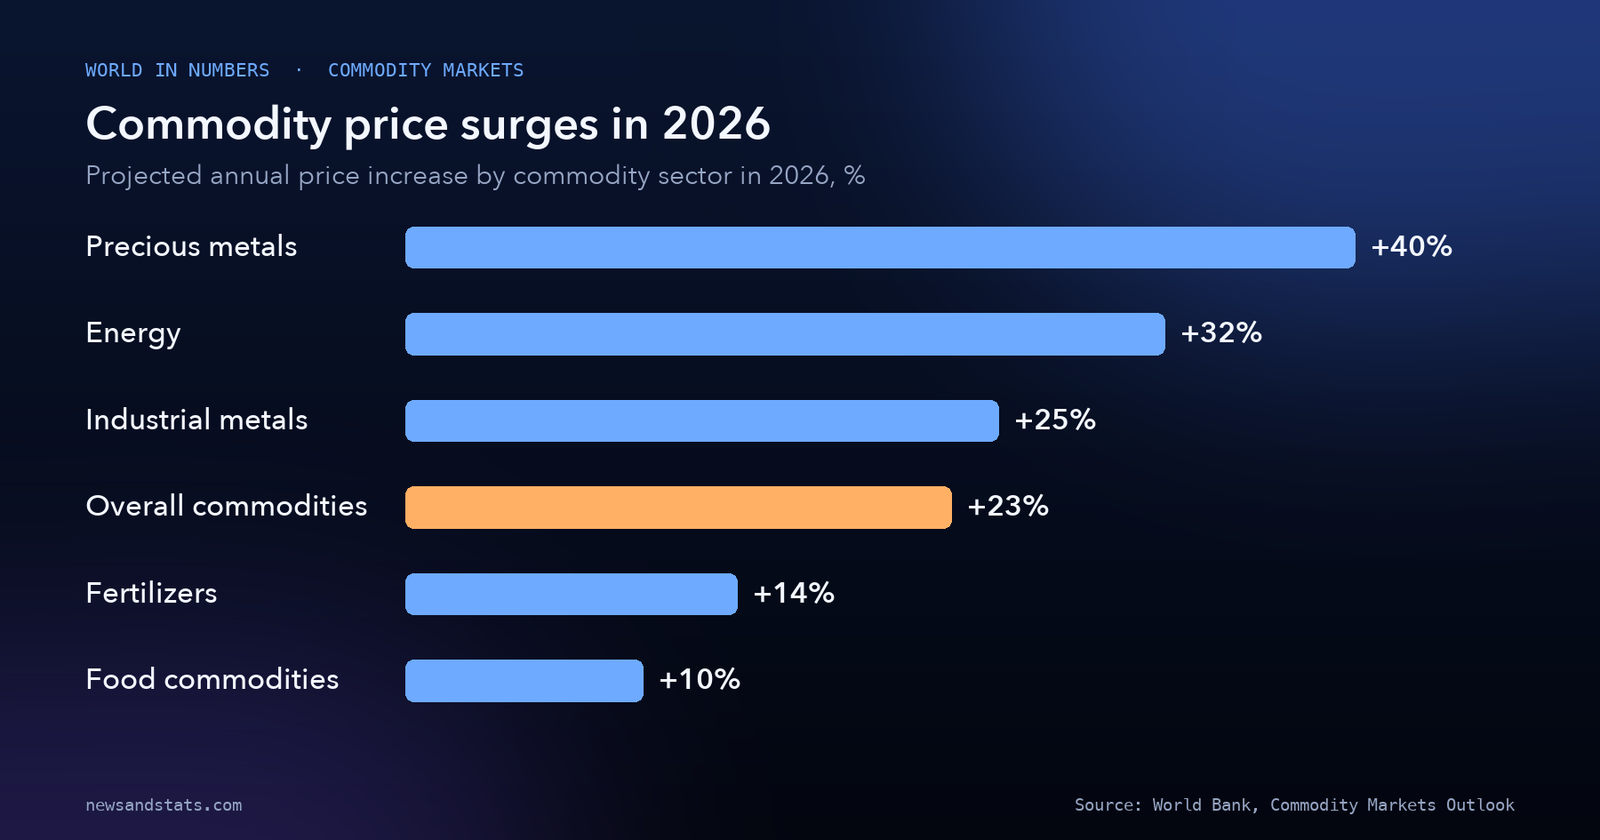
Source: World Bank, Commodity Markets Outlook.
The broad commodity index is forecast to retreat by 7% in 2027 as energy markets partially stabilize. However, the World Bank warns that the recovery will remain uneven, with food prices continuing to climb even after headline energy indicators ease.
The transmission of price volatility has also evolved structurally. The report’s special focus on market connectedness reveals that while commodity-specific fundamentals typically govern price swings during calm periods, cross-commodity volatility transmission spikes during geopolitical crises. After the outbreak of conflict in the Middle East in early 2026, the volatility spillover transmitted from oil prices into shipping freight, fertilizer synthesis, and grain pricing climbed to its highest intensity on record.
2. 32%: Energy prices surge to a four-year peak as Brent reaches $91
The central catalyst behind the 2026 commodity shock is energy. The World Bank projects that global energy prices will surge by 32% in 2026, reversing three consecutive years of declining prices and driving the international energy index to a four-year high.
The primary benchmark for international crude, Brent, is forecast to average $91 per barrel in 2026. This represents a dramatic escalation from the annual average of $69 per barrel recorded in 2025.
Our calculation: Brent crude will increase by $22 per barrel in 2026, representing a 31.9% year-over-year jump in baseline crude procurement costs for global refiners.

Source: World Bank, October 2026.
While the baseline forecast assumes that Brent will ease to $79 per barrel in 2027 as non-OPEC production expands, current monthly indicators reflect extreme tightness. In October 2026 alone, the World Bank’s monthly energy price index rose by 7.1%, driven by a 12.1% surge in European natural gas prices and a 7% monthly increase in Brent crude.
This rapid run-up in benchmark crude and liquefied gas has placed severe fiscal strain on importing nations. As analyzed in our review of the fiscal costs of fuel subsidies during the energy shock, governments attempting to cap domestic retail pump prices face unsustainable budget deficits and depleted foreign exchange reserves.
3. 5.2%: World oil supply registers steepest non-recession contraction in four decades
The fundamental imbalance driving energy prices upward is a severe physical supply deficit. Global oil supply is projected to contract by 5.2% in 2026.
According to historical World Bank records, a 5.2% drop in global petroleum supply represents the largest annual supply contraction in more than four decades outside the extraordinary economic shutdown of the 2020 pandemic recession.
Production declines within the Middle East have overwhelmed output gains across the Americas:
- Production in the Persian Gulf region dropped precipitously due to direct conflict damage and infrastructure blockades.
- Supply expansion across the United States, Guyana, Canada, and Brazil provided partial relief but proved insufficient to offset Middle Eastern losses.
Simultaneously, global oil consumption is projected to contract by 2.5% in 2026. This marks the third-largest annual demand contraction on record, trailing only the global recessions of 2020 and 1980.
Demand destruction has been accelerated by two distinct forces: high prices forcing industrial rationing, and structural vehicle electrification—most notably in China, where rapid electric car adoption has permanently suppressed petroleum transport demand. However, because the 5.2% supply contraction far outpaces the 2.5% drop in consumption, physical oil inventories have been drawn down to precarious operational minimums, leaving global markets acutely exposed to any further disruptions.
4. 25%: Industrial metals hit an all-time record on clean energy demand
While fossil fuel markets struggle with supply disruptions, industrial metals are experiencing an unprecedented structural demand shock. The World Bank’s industrial metals price index is forecast to surge by 25% in 2026, pushing average metals prices to an all-time record high.
This historic peak is driven by simultaneous record pricing across three essential industrial inputs:
- Refined copper prices reached all-time highs due to mine supply bottlenecks in the Americas and massive electrical grid buildouts.
- Primary aluminum prices reached record levels as energy-intensive smelting faced elevated power tariffs.
- Refined tin prices hit all-time records, driven by surging semiconductor packaging and printed circuit board soldering.
The primary engine sustaining this metals supercycle is the global energy transition and digital infrastructure expansion. High-voltage transmission lines, utility-scale solar farms, grid-scale battery storage facilities, and generative AI data centers require immense volumes of copper and aluminum wiring.
As documented in our review of critical mineral supply chains and export restrictions, mining lead times of 10 to 15 years prevent primary extraction from responding quickly to demand spikes. Although the World Bank projects metals prices to ease by 3% in 2027, prices are expected to remain structurally elevated throughout the decade.
5. 18%: Compounding food commodity inflation threatens developing economies
For vulnerable populations, the most severe fallout of the 2026 commodity shock is the compounding cost of staple nutrition. The World Bank projects that international food commodity prices will increase by 10% in 2026 and another 7% in 2027.
Our calculation: combining a 10% price increase in 2026 with a subsequent 7% increase in 2027 results in an 17.7% cumulative rise, which rounds to an 18% cumulative surge in agricultural food commodity prices over two years.
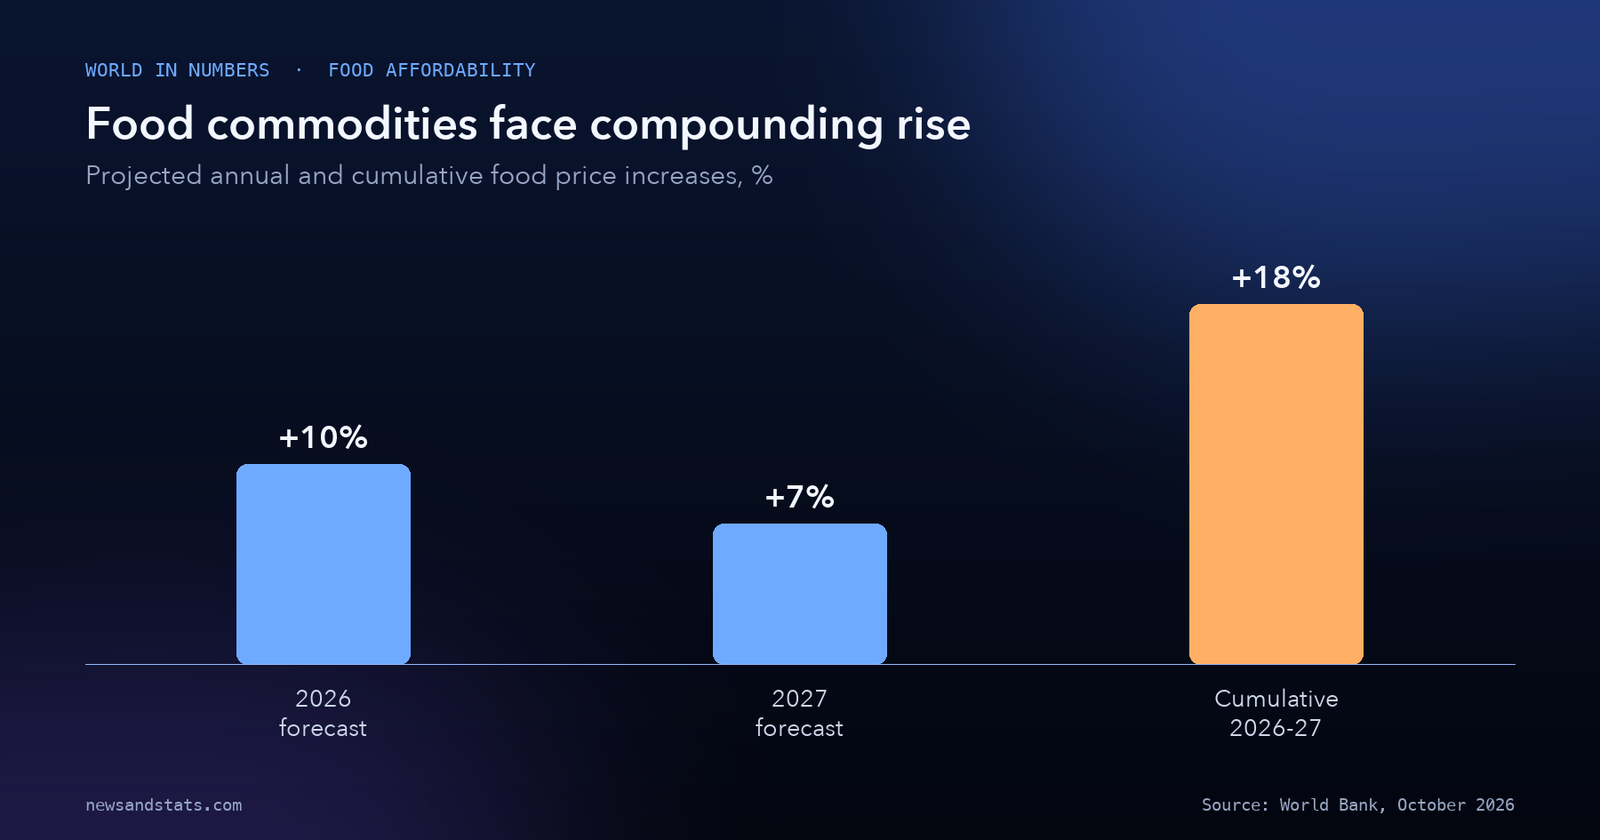
Source: World Bank, October 2026.
Agricultural production is being squeezed simultaneously by climate shocks and input cost spikes:
- A very strong El Niño weather event has disrupted monsoon rainfall and depleted soil moisture across Southern Africa, Southeast Asia, and parts of Latin America.
- Maritime hostilities have disrupted vital grain shipping corridors across the Black Sea and the Red Sea, inflating commercial cargo insurance freight rates.
- Elevated natural gas and diesel prices have mechanically increased the cost of operating tractors, running irrigation pumps, and synthesizing nitrogen fertilizers.
This compounding price pressure threatens to precipitate a global food security emergency reminiscent of the early 2010s. In countries already grappling with sovereign debt distress across vulnerable developing economies, soaring import bills for wheat, rice, and edible oils are eroding foreign reserves and forcing sharp depreciations in domestic currencies.
6. 40%: Precious metals surge as safe-haven asset demand intensifies
Reflecting pervasive macroeconomic instability and escalating geopolitical friction, precious metals represent the single fastest-growing commodity category in 2026. The World Bank projects that precious metals prices will surge by 40% in 2026.
This 40% increase follows aggressive buying from institutional asset managers, private family offices, and sovereign reserve managers seeking refuge from currency volatility and sovereign debt expansion.
The magnitude of this repricing is unprecedented in modern market history:
- Average precious metals prices in 2026 are forecast to stand at more than three times their 2015-2019 pre-pandemic average.
- While prices are expected to moderate somewhat in 2027, the World Bank projects they will remain structurally elevated well above pre-crisis benchmarks.
A critical structural pillar supporting this elevated valuation is sovereign reserve management. As detailed in our earlier tracking of official reserve diversification into physical gold, central banks across emerging economies have sustained record bullion purchases to de-risk national reserves away from G7 fiat sovereign debt, providing a persistent structural floor beneath international gold quotations.
7. 14%: Fertilizer price rebound pressures agricultural planting costs
Agricultural input markets are experiencing a secondary cost wave that threatens future crop yields. Global fertilizer prices are projected to rise by 14% in 2026, reversing two years of post-2023 price normalization.
The primary driver behind this fertilizer rebound is the high cost of energy inputs:
- Natural gas accounts for the vast majority of the cash operating cost of producing ammonia, the essential chemical building block for urea and nitrate fertilizers.
- European natural gas prices surged by 12.1% in October 2026 alone, directly increasing operating costs for regional chemical synthesis plants.
- Global fertilizer prices gained 1% in October 2026 as autumn application demand met tight merchant inventories.
International supply dynamics have been heavily influenced by export policy shifts. In global nitrogen markets, China operated as a decisive swing urea supplier throughout 2026, temporarily dampening international price spikes by accelerating export quotas during the middle of the year.
While the World Bank forecasts fertilizer prices to stabilize in 2027 and return to 2025 levels, the 14% price spike in 2026 directly inflates planting costs for farmers entering the 2026/27 crop season, locking in elevated food production costs for the next twelve months.
8. $105 per barrel: The adverse escalation scenario and systemic risk
While the World Bank’s baseline forecast outlines a challenging 23% commodity shock, the institution explicitly modeled an adverse escalation scenario where current geopolitical and climatic shocks intensify simultaneously.
Under this adverse scenario, three compounding risk factors materialize:
- Active conflict across the Middle East escalates to engulf regional oil processing hubs, while persistent attacks continue to degrade Russian energy infrastructure.
- Maritime security worsens, completely closing critical shipping chokepoints and paralyzing Black Sea grain exports.
- El Niño weather disruptions intensify into severe, multi-continent agricultural droughts.
Should these conditions coincide, the World Bank warns of severe global economic dislocations:
- Brent crude oil would average $105 per barrel in 2027, sitting $26 per barrel above the baseline forecast of $79.
- Food commodity prices would rise 12% above their baseline forecast, surpassing the historic food price peaks recorded during the 2022 crisis.
Our calculation: at $105 per barrel in 2027, Brent crude would sit 52.2% above its 2025 baseline average of $69 per barrel, eliminating any near-term disinflation dividend.
Under this adverse trajectory, imported food and energy inflation would reignite worldwide, forcing central banks to maintain elevated interest rates and stalling global economic growth and inflation forecasts. To mitigate this vulnerability, the World Bank Group has mobilized between $50 billion and $60 billion in financial support, including $25 billion in pre-arranged financing to reinforce emergency social safety nets and provide agricultural working capital across low-income nations.
How to read commodity market dynamics
Interpreting international commodity indices and price forecasts requires understanding five essential methodological principles established by the World Bank:
- Nominal versus constant-currency price indices. The World Bank’s commodity indices are calculated in current US dollars. When the US dollar appreciates, international commodity prices often face downward pressure in dollar terms while simultaneously becoming more expensive in local currencies for importing developing nations.
- Physical spot prices versus long-term futures contracts. Quoted spot prices reflect immediate physical delivery, whereas futures curves reflect market expectations and storage financing costs. In acute physical supply crises, spot prices often trade at a steep premium over deferred contracts (a market structure termed backwardation).
- Cross-commodity volatility transmission. Volatility transmission measures the statistical degree to which price shocks in one commodity explain price movements in another. While industrial metals typically transmit the largest baseline volatility, energy price shocks become the dominant volatility transmitter during geopolitical emergencies.
- Baseline versus adverse scenario modeling. The World Bank’s baseline forecast reflects the most probable modal outcome under current policies and assumes no major conflict escalation. Adverse scenarios model tail-risk outcomes where multiple low-probability, high-impact disruptions occur simultaneously.
- Upstream agricultural commodities versus consumer retail food prices. The World Bank Food Price Index measures unrefined bulk agricultural commodities (such as raw wheat, soybeans, and crude palm oil) at wholesale ports. Retail food inflation in grocery stores incorporates domestic transport costs, food processing margins, packaging, labor, and local currency exchange rates.
The World Bank commodity price outlook at a glance
The following table summarizes the verified baseline price projections, sector percentage shifts, supply-demand fundamentals, and financing allocations published in the World Bank’s October 2026 Commodity Markets Outlook.
| Metric | Measured value | Reporting benchmark | Core market or geopolitical driver | Primary source |
|---|---|---|---|---|
| Overall commodity price growth 2026 | +23% increase | Calendar 2026 | Broad-based surge across energy, metals, food, and fertilizer | World Bank Commodity Outlook 2026 |
| Overall commodity price shift 2027 | -7% decline | 2027 projection | Modest price moderation as energy supplies partially adapt | World Bank Commodity Outlook 2026 |
| Energy price index increase 2026 | +32% increase | Calendar 2026 | Reverses three years of declines to reach 4-year high | World Bank Commodity Outlook 2026 |
| Average Brent crude price 2025 | $69 per barrel | Calendar 2025 | Baseline oil price before Middle East conflict escalation | World Bank Commodity Outlook 2026 |
| Projected Brent crude price 2026 | $91 per barrel | Calendar 2026 | Reflects 5.2% supply contraction and inventory drawdowns | World Bank Commodity Outlook 2026 |
| Projected Brent crude price 2027 | $79 per barrel | 2027 baseline | Assumes no further major conflict escalation | World Bank Commodity Outlook 2026 |
| Adverse scenario Brent price 2027 | $105 per barrel | 2027 adverse | Models severe regional conflict escalation and infrastructure loss | World Bank Commodity Outlook 2026 |
| Global oil supply contraction 2026 | -5.2% decline | Calendar 2026 | Largest non-recession drop in more than four decades | World Bank Commodity Outlook 2026 |
| Global oil demand contraction 2026 | -2.5% decline | Calendar 2026 | Third-largest drop on record; driven by prices and EV growth | World Bank Commodity Outlook 2026 |
| Industrial metals price growth 2026 | +25% increase | Calendar 2026 | Reaches all-time record as copper, aluminum, and tin peak | World Bank Commodity Outlook 2026 |
| Industrial metals price shift 2027 | -3% decline | 2027 projection | Minor correction while remaining historically elevated | World Bank Commodity Outlook 2026 |
| Precious metals price surge 2026 | +40% increase | Calendar 2026 | Safe-haven demand driven by geopolitical fragmentation | World Bank Commodity Outlook 2026 |
| Precious metals level vs historical | Over 3x average | 2026 benchmark | Multiplies 2015-2019 pre-pandemic average by over three | World Bank Commodity Outlook 2026 |
| Food commodity price increase 2026 | +10% increase | Calendar 2026 | Driven by El Niño droughts and Black Sea grain disruptions | World Bank Commodity Outlook 2026 |
| Food commodity price increase 2027 | +7% increase | 2027 projection | Compounding increase as input cost pressures persist | World Bank Commodity Outlook 2026 |
| Cumulative two-year food price rise | +18% increase | 2026-2027 total | Compounding agricultural inflation eroding food affordability | World Bank Commodity Outlook 2026 |
| Fertilizer price increase 2026 | +14% increase | Calendar 2026 | Rebound driven by surging natural gas feedstock costs | World Bank Commodity Outlook 2026 |
| European natural gas monthly change | +12.1% increase | October 2026 | Monthly jump driving regional chemical operating expenses | World Bank Commodity Outlook 2026 |
| World Bank total financing package | $50B to $60B | Operational 2026 | Capital mobilized across existing crisis lending windows | World Bank Commodity Outlook 2026 |
| Pre-arranged emergency financing | $25 billion | Standby 2026 | Rapid liquidity support for social safety nets and farms | World Bank Commodity Outlook 2026 |
Sources: World Bank, Commodity Markets Outlook Press Release, Research Portal, and Full Report Repository.
What to watch
- Middle East maritime transit security, monitoring crude tanker and container traffic through the Strait of Hormuz and Bab el-Mandeb to evaluate freight risk premiums.
- Fertilizer export quotas in China and Egypt, tracking whether sovereign export restrictions restrict global urea supplies ahead of spring 2027 agricultural planting.
- Southern Hemisphere grain harvest yields, evaluating whether the ongoing El Niño episode causes severe crop failures in Brazil, Argentina, and Australia.
- Copper smelter treatment and refining charges (TC/RCs), observing whether negative smelting margins trigger widespread capacity curtailments across Asian refineries.
- Commercial oil inventory drawdowns in OECD nations, tracking whether strategic petroleum reserve releases are deployed to mitigate supply shortages before mid-2027.
- Emergency food import financing disbursements, monitoring whether the World Bank’s $25 billion pre-arranged financing effectively cushions balance-of-payments crises across low-income food-deficit nations.
The bottom line
The World Bank’s October 2026 Commodity Markets Outlook underscores that the global economy has entered a volatile high-cost commodity regime. Driven by a 32% spike in energy costs that pushes Brent crude to $91 per barrel, overall commodity prices are set to surge by 23% in 2026, breaking three years of disinflation. As physical crude supply registers its steepest non-recession contraction in four decades and industrial metals reach all-time records on clean energy demand, the transmission of energy volatility into fertilizers and freight is fueling a compounding 18% surge in food commodity prices through 2027. With adverse scenarios warning of $105 oil and severe food insecurity, macroeconomic resilience will depend on international emergency financing, expanded energy efficiency, and targeted social safety nets to protect the world’s most vulnerable populations. For continuing analysis of global economic indicators, commodity flows, and trade policy, explore our World in Numbers category hub.
Related reading
- Who pays for the 2026 energy shock? The numbers, country by country: fossil fuel import costs, subsidy burdens, and inflation pass-through.
- The world economy in 8 numbers: what the IMF’s October 2026 outlook says: macroeconomic growth benchmarks, inflation projections, and global trade volumes.
- Central Bank Gold Buying in Q2 2026 as the Price Eased From a Record: official foreign reserve diversification, central bank purchases, and gold price movements.