The strategic catalyst driving global clean energy deployment has undergone a fundamental transformation. While environmental pledges and carbon reduction targets previously served as the primary justification for building renewable capacity, national energy security has decisively taken over as the central economic driver. Escalating regional instability and maritime supply disruptions have exposed the extreme fiscal vulnerability of importing fossil fuels, prompting finance ministries and power planners worldwide to accelerate domestic generation assets. According to the International Energy Agency (IEA) in its landmark press release Energy security concerns spur faster renewables growth across a widening constellation of countries and its comprehensive report Renewables 2026: Analysis and Forecasts to 2031, the world is on track to install massive clean power volumes over the remainder of the decade.
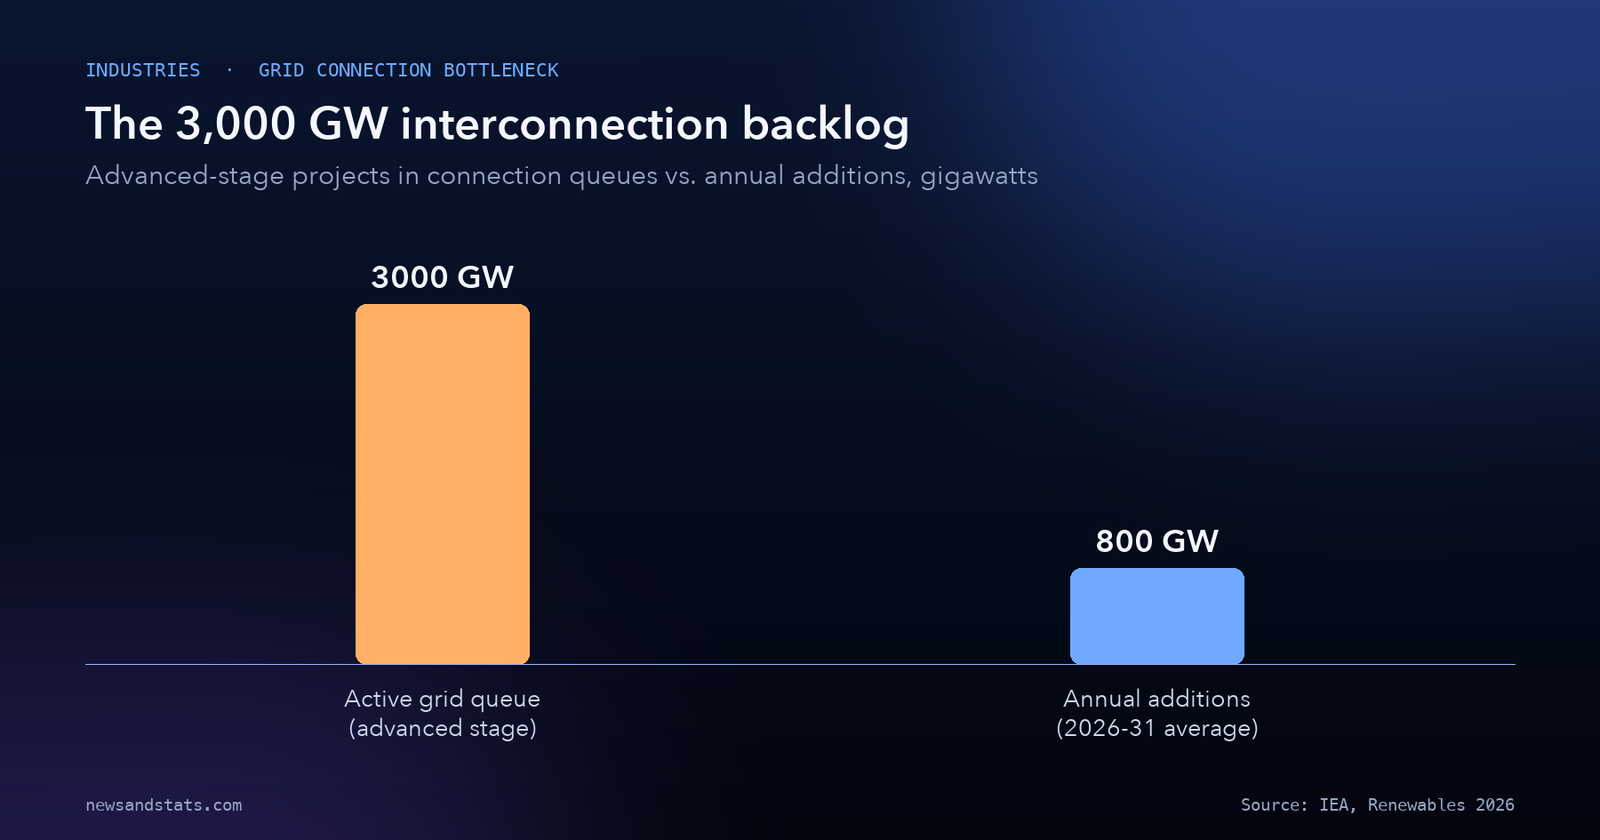
Drawing on verified empirical data from the IEA’s Renewable electricity analysis and Regional forecasts and data, global renewable power capacity is projected to expand by more than 4,770 gigawatts (GW) between 2026 and 2031. Yet this historic expansion is running directly into a severe structural constraint: electrical transmission infrastructure. Today, 3,000 GW of advanced-stage clean power and storage projects sit stalled in grid interconnection queues. Here are the eight numbers that define the scale of the 4,770 GW buildout, the emergence of developing economies as primary growth drivers, and the mechanics of the 3,000 GW transmission bottleneck.
1. 4,770 GW: Global renewable capacity set to expand nearly 60% faster
The core headline figure in the IEA’s medium-term outlook is the total volume of renewable capacity entering global power grids. Between 2026 and 2031, global renewable power capacity is projected to expand by over 4,770 GW—nearly 4,800 GW in aggregate installations.
This pace of construction marks a dramatic escalation in global industrial execution. The 4,770 GW buildout represents a 57% acceleration compared to the preceding six-year period between 2020 and 2025. Over the forecast horizon, renewable technologies will account for more than 80% of all new power generation capacity built worldwide.
Annual installations will reach an industrial rhythm never before observed in electrical power history. Global annual renewable capacity additions are forecast to average almost 800 GW per year between 2026 and 2031, sitting 57% above the 2020-2025 historical average.
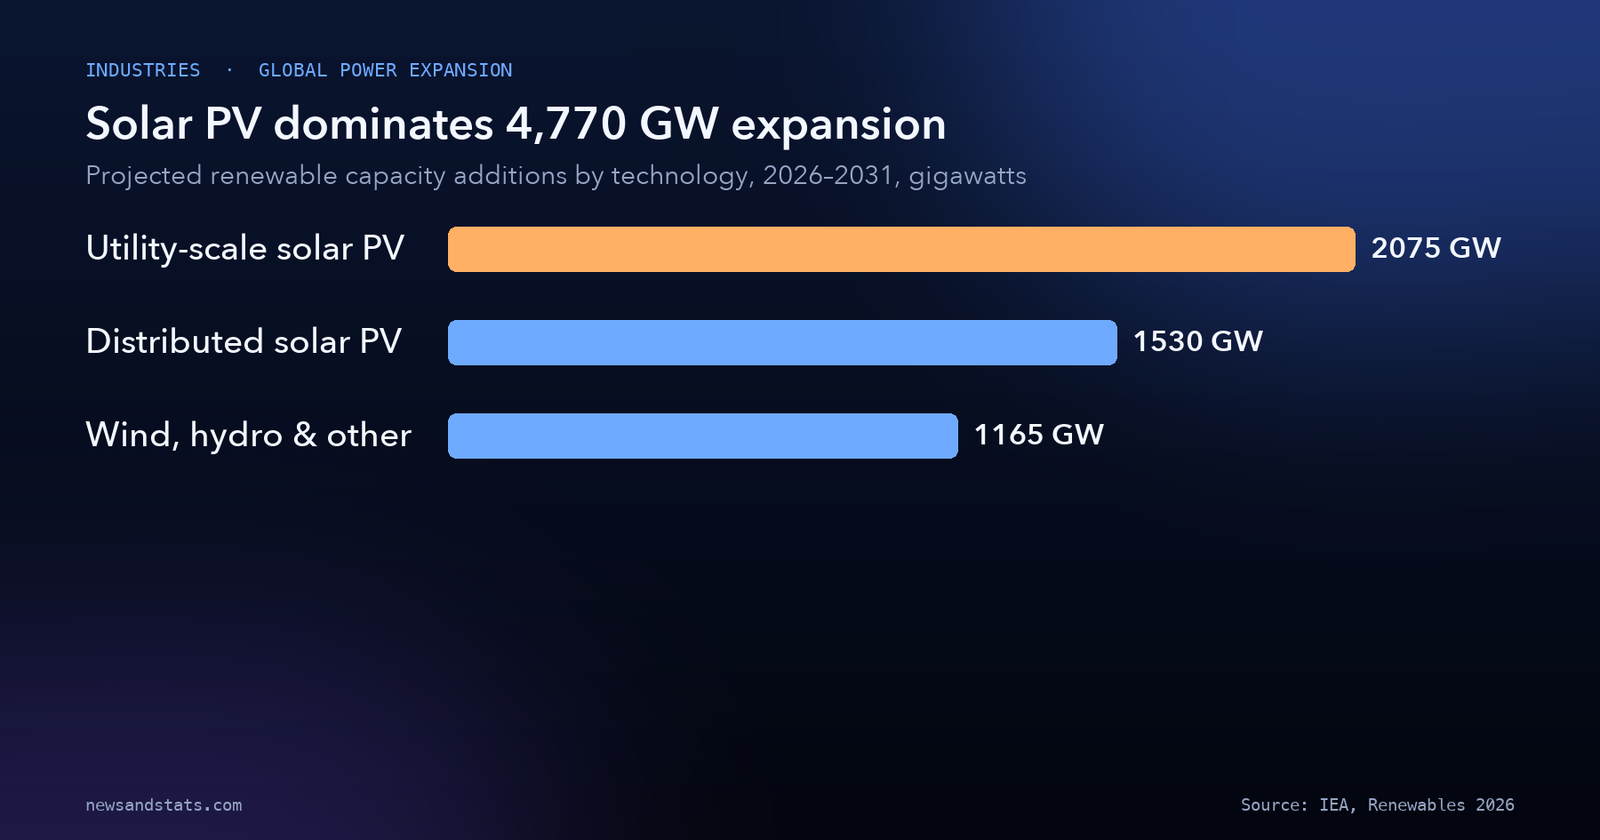
Source: IEA, Renewables 2026.
Our calculation: out of the 4,770 GW of new capacity projected through 2031, solar photovoltaic systems will account for 3,605 GW across utility and distributed installations, leaving 1,165 GW for wind, hydropower, bioenergy, and other clean power sources.
The underlying catalyst for this expansion is structural self-reliance. As our earlier analysis documented regarding fossil fuel import costs during the energy shock, economies that rely on imported hydrocarbons face volatile international commodity swings. Because solar and wind assets harness domestic natural resources, governments are treating renewable capital expenditure as defensive economic infrastructure.
2. 3,000 GW: Grid connection backlog swells to four times annual deployment
While renewable generation equipment is rolling off automated factory lines at record speeds, transmission networks have become the ultimate physical pinch point. According to the IEA, the total volume of advanced-stage renewable energy and storage projects waiting for electrical grid connections reached 3,000 GW worldwide.
This interconnection backlog expanded with alarming speed, growing by 60% over the trailing twelve months. To grasp the magnitude of this bottleneck: 3,000 GW represents nearly four times the total volume of wind and solar PV capacity connected to global grids throughout the entirety of 2025.
Source: IEA, Renewables 2026.
The composition of the queue reveals where grid operators are struggling most. Battery storage applications and hybrid renewable-plus-storage projects accounted for the entire 60% increase in connection backlogs over the past year.
Our calculation: at the projected deployment pace of almost 800 GW per year, the 3,000 GW queue contains enough advanced project capacity to satisfy nearly 3.75 years of total worldwide renewable installations.
To prevent queues from being overwhelmed by speculative proposals, system operators have begun tightening access rules. Comprehensive interconnection reforms implemented in India, the United Kingdom, and the United States eliminated almost half of early-stage standalone wind and solar projects from active queues, forcing developers to demonstrate land control, financing milestones, and commercial viability before securing grid study positions.
3. 75%: Solar PV commands three-quarters of new power additions
Technological deployment across clean energy is increasingly dominated by a single manufacturing architecture: crystalline silicon solar photovoltaics. The IEA projects that solar PV will account for three-quarters—75%—of all global renewable power capacity growth between 2026 and 2031.
This dominance spans both large-scale power infrastructure and localized decentralized generation:
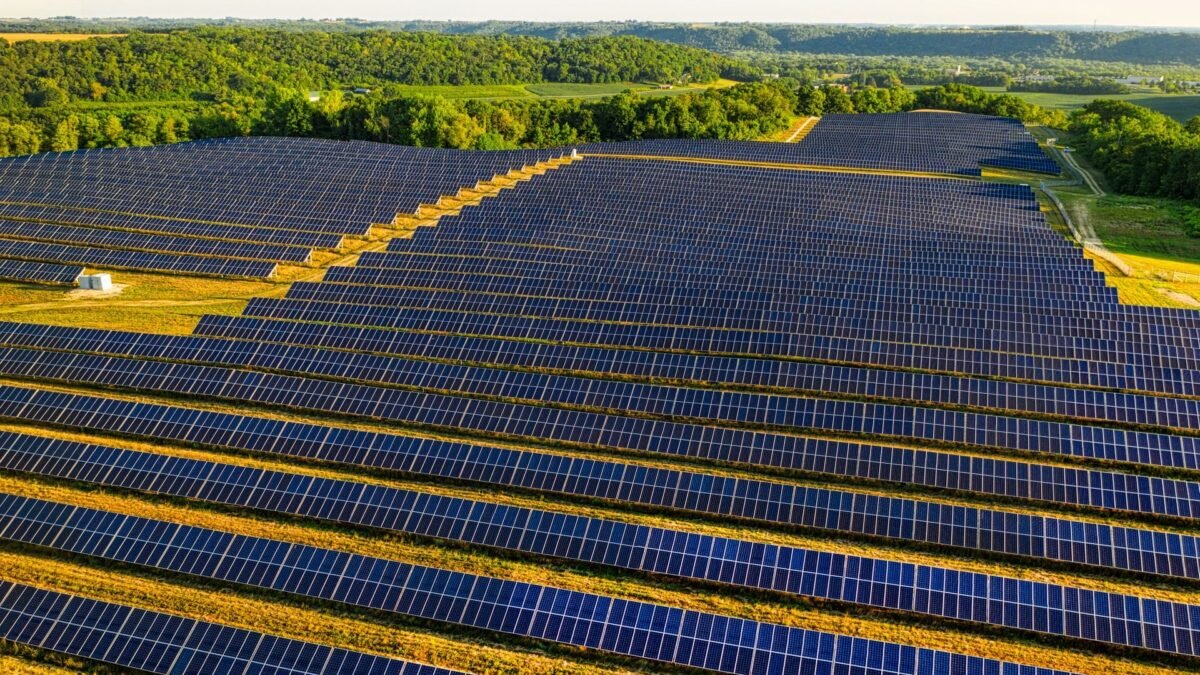
- Utility-scale solar PV installations will expand by 2,075 GW over the six-year forecast period.
- Distributed solar PV applications—encompassing residential rooftops, commercial warehouses, industrial parks, and agricultural off-grid systems—will expand by an additional 1,530 GW.
The economic engine powering this buildout is cost superiority. Plunging module pricing, streamlined engineering, and rapid construction timelines allow solar projects to reach commercial operation in fractions of the time required for conventional thermal plants or offshore wind developments. Furthermore, faster municipal permitting and broad public acceptance have made solar PV the default technology for utility developers even in regions where onshore wind yields higher capacity factors.
In parallel, consumer self-consumption has decoupled from centralized utility planning. In markets plagued by high retail electricity tariffs or frequent distribution outages, distributed rooftop solar systems have already improved electricity reliability for approximately 70 million households worldwide. Building on our examination of rapid utility and distributed solar deployment, decentralized solar is transforming individual consumers into active power producers.
4. 53%: China’s dominance moderates as emerging economies match the West
A geographic shift is redefining international energy geopolitics. While the People’s Republic of China has historically operated as the undisputed engine of global renewable manufacturing and deployment, its relative share of worldwide capacity expansion is beginning to moderate.
China accounted for more than 60% of all global renewable power additions in 2025. Over the 2026-2031 forecast period, the IEA projects that China’s share of global additions will settle at an average of 53%.
This relative deceleration stems from structural market reforms within China itself:
- In June 2025, the Chinese government ended fixed remuneration feed-in tariffs, transitioning renewable developers to competitive market auctions.
- Chinese solar PV additions contracted by almost 55% year-on-year across the first nine months of 2026 as developers adjusted to tighter merchant project economics.
- Consequently, total global renewable additions are forecast to decline by 11% in 2026, snapping a historic 21-year streak of consecutive record-breaking annual expansions.
Despite this 11% global dip, 2026 will still register the second-highest annual addition volume in history. In July 2026, China released its 15th Five-Year Plan for Renewable Energy Development, establishing an indicative target of at least 2,800 GW of combined wind and solar PV alternating current (AC) capacity by 2030, implying 190 GW of required annual deployment. The IEA expects China to exceed this official target by almost 30%.
Crucially, the deceleration in China coincides with a breakout across developing nations. For the first time in history, the volume of renewable capacity added across emerging markets and developing economies (EMDEs) outside China will match the combined additions of all advanced economies. While emerging nations expanded at half the pace of advanced economies between 2020 and 2025, escalating energy security priorities have raised the six-year EMDE forecast by nearly 20%.
5. 8.5%: India emerges as the world’s second-largest expansion engine
As China’s share moderates, India has solidified its position as the primary growth market in the global clean energy transition. The IEA projects that India’s renewable capacity expansion between 2026 and 2031 will be 2.6 times greater than during the 2020-2025 period, effectively doubling its contribution to global growth to nearly 8.5%.
Total renewable power capacity in India is on track to more than double by 2031, underpinned by strong central auction frameworks, expanding transmission corridors, and aggressive domestic manufacturing incentives.
India’s expansion is transforming international hardware supply chains:
- India is projected to be the only nation outside China capable of manufacturing every component of the crystalline solar PV supply chain at scale by 2031.
- India’s share of global solar PV module manufacturing capacity is expected to nearly double, reaching 17% over the next five years.
Our calculation: capturing an 8.5% share of the 4,770 GW global buildout means India alone will install approximately 405 GW of new renewable capacity between 2026 and 2031.
The acceleration extends across the broader Global South. Driven by national electrification targets and emergency energy diversification, Southeast Asia (ASEAN), the Middle East and North Africa (MENA), and sub-Saharan Africa are collectively tripling their pace of renewable installations over the next six years. Saudi Arabia is set to expand its renewable deployment fivefold, while the ASEAN region is projected to register the highest annual solar additions among all emerging regions by 2031. As tracked in our analysis of the industrial manufacturing divergence between India and China, heavy state backing for domestic clean technology manufacturing is shifting the geographic center of energy production.
6. 45%: Renewables approach half of worldwide electricity generation by 2031
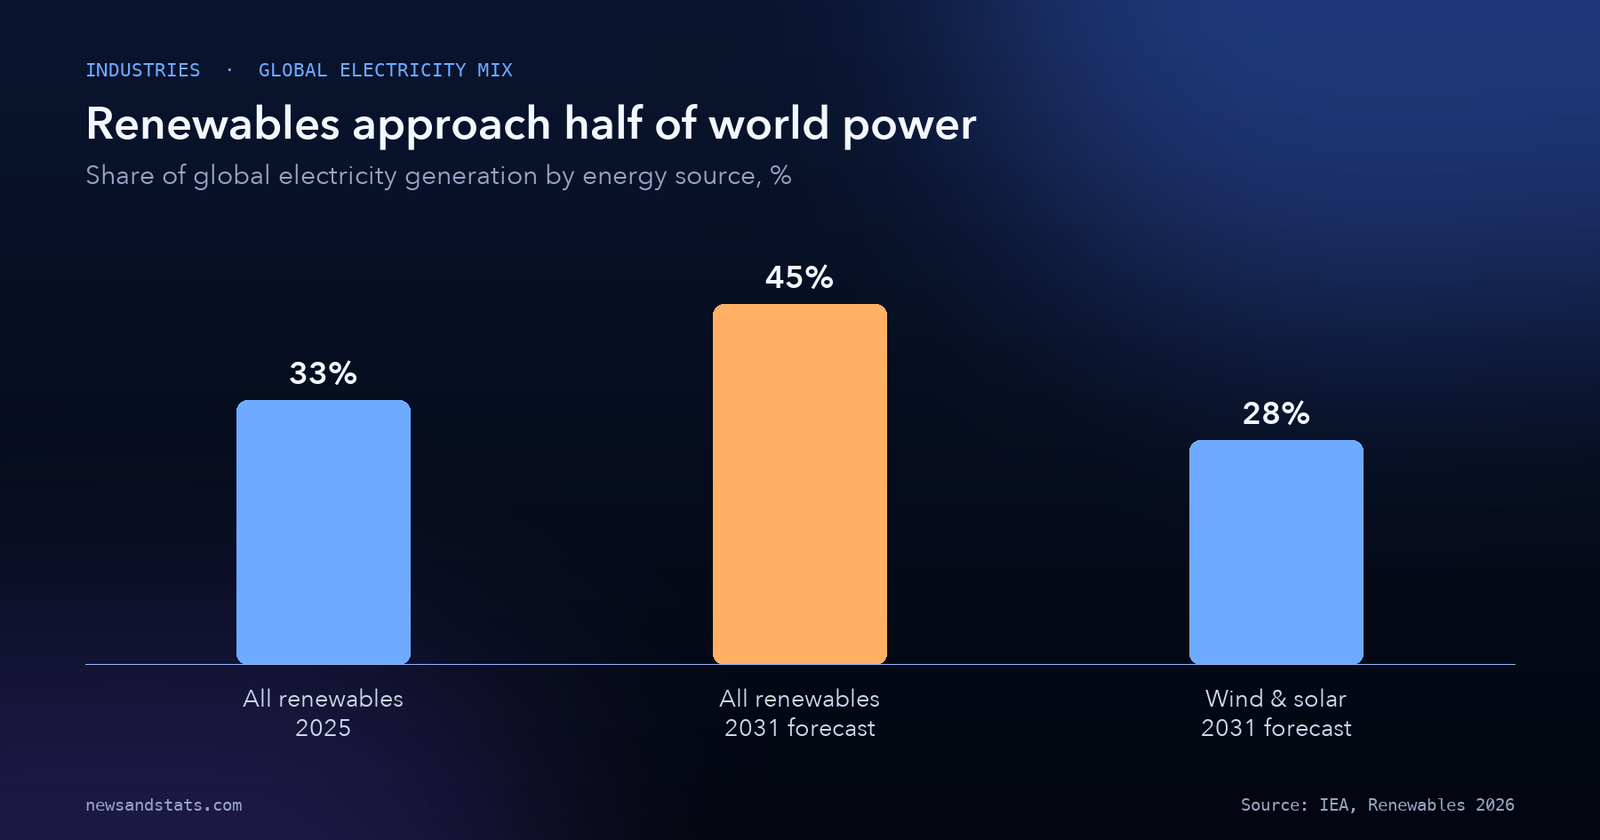
The relentless compounding of capacity additions is triggering an irreversible transformation in the global electrical generation mix. The IEA projects that renewable energy will generate almost 45% of total worldwide electricity by 2031, climbing from 33% in 2025.
Combined electricity generation from wind and solar photovoltaic assets will more than double over the forecast period, expanding from their current footprint to supply over 28% of total global electricity generation by 2031.
Source: IEA, Renewables 2026.
This surge brings a historic changing of the guard among renewable power technologies. While conventional hydroelectric dams have anchored clean electricity systems for more than a century, solar PV generation has already surpassed wind power and is projected to overtake hydropower in 2029 to become the world’s largest individual source of renewable electricity.
In the transport sector, renewable energy use will expand by more than 60% by 2031, covering 6% of worldwide transport energy demand. Renewable electricity consumed by electric passenger vehicles and commercial trucks will drive approximately 45% of this transport growth, while liquid biofuels provide the second-largest contribution. According to the IEA’s Renewable transport report, supported by aggressive blending mandates in Southeast Asia and Latin America, global liquid biofuel demand could increase by nearly 35% to 333 billion liters by 2031 under announced policies.
7. 800 TWh: Power curtailment surges as grid flexibility lags generation
The rapid penetration of variable solar and wind power without commensurate investments in electrical transmission, long-duration storage, and demand response is introducing severe operational volatility to wholesale power markets. By 2031, 17 countries will see variable renewables account for more than 50% of their annual electricity generation mix.
Without sufficient system flexibility, grid operators are increasingly forced to order technical curtailment—deliberately disconnecting operational wind turbines and solar plants to prevent transmission lines from overloading:
- Technical curtailment of wind and solar PV generation almost doubled in both 2024 and 2025.
- Curtailment reached nearly 200 terawatt-hours (TWh) globally in 2025.
- The IEA warns that annual curtailment could exceed 800 TWh by 2031—an energy loss equivalent to almost 8% of total variable renewable generation worldwide.
Our calculation: an 800 TWh curtailment volume in 2031 is greater than the entire annual electricity consumption of Germany and the United Kingdom combined.
This supply-demand mismatch is already eroding project revenues. Across European electricity exchanges, wholesale power markets are registering a record number of negative electricity price hours during sunny midday periods. Plunging power prices during peak solar generation hours depress capture rates for merchant solar developers and corporate power purchase agreements (PPAs), threatening the economic sustainability of market-based deployment models. As reviewed in our evaluation of utility-scale battery energy storage installations, deploying four-hour and eight-hour battery storage systems is vital to capturing discarded renewable megawatt-hours and re-injecting them during evening peak demand.
8. 615 million tonnes: Avoided coal demand highlights fossil displacement
Despite integration friction, the sheer volume of operating clean energy assets is delivering massive, quantifiable reductions in global fossil fuel consumption. According to the IEA’s energy accounting model, operating renewable power installations directly displaced substantial volumes of fossil fuels in 2025:
- 615 million tonnes (Mt) of coal demand avoided globally.
- 515 billion cubic meters (bcm) of natural gas demand displaced across power and industrial heat applications.
- 2.4 million barrels per day (mb/d) of crude oil demand displaced across power generation and transportation.
This displaced volume provides profound macroeconomic relief. In natural gas markets, avoiding 515 bcm of consumption is equivalent to eliminating more than the entire annual gas consumption of the European Union, removing immense pricing pressure from international liquefied natural gas (LNG) supply chains.
The urgency to sustain this displaced volume is intensifying due to new baseload loads. Electricity demand from digital infrastructure, artificial intelligence clusters, and automated manufacturing is accelerating rapidly. In the United States, the IEA revised its renewable forecast upwards by almost 40% primarily because solar PV and battery storage represent the only power generation assets capable of being permitted, procured, and energized rapidly enough to satisfy surging data center electricity demand.
How to read global renewable energy metrics
Evaluating international renewable energy data requires understanding five fundamental technical and reporting conventions established by the IEA:
- Nameplate capacity (GW) differs from electrical generation (TWh). A gigawatt (GW) measures instantaneous theoretical peak power output under ideal conditions, whereas a terawatt-hour (TWh) measures actual electrical energy generated over time. Because solar panels and wind turbines operate at variable capacity factors (typically 15% to 45%), adding 1 GW of solar PV yields substantially fewer TWh of electricity than adding 1 GW of baseload nuclear or geothermal capacity.
- Alternating current (AC) versus direct current (DC) ratings. Solar photovoltaic modules generate direct current (DC) electricity, which inverters convert into alternating current (AC) for transmission across power grids. China’s Five-Year Plan targets specify AC capacity, whereas global equipment manufacturing statistics often measure peak direct current (GWp DC).
- Utility-scale versus distributed generation. Utility-scale systems represent centralized power stations that transmit high-voltage electricity into bulk transmission grids. Distributed systems consist of decentralized installations (such as residential rooftops and commercial warehouses) that interconnect directly to low-voltage distribution networks to offset onsite building loads.
- Technical curtailment versus market redispatch. Curtailment occurs when a system operator instructs a renewable plant to restrict output because transmission lines cannot absorb the power. While curtailment protects physical grid stability, it results in zero-carbon electricity being permanently lost.
- Main case versus accelerated forecast scenarios. The IEA’s main case forecast reflects existing policies, announced regulatory frameworks, and market fundamentals, projecting global renewable capacity to reach 2.6 times the 2022 baseline by 2030. The accelerated case assumes rapid administrative reforms, faster grid permitting, and aggressive storage deployment, enabling the world to reach the COP28 target of tripling renewable capacity by 2031.
The IEA Renewables 2026 outlook at a glance
The following table summarizes the verified deployment targets, technology breakdowns, grid bottlenecks, and fossil fuel displacement statistics published in the IEA Renewables 2026 report.
| Metric | Measured value | Reporting benchmark | Core economic or structural driver | Primary source |
|---|---|---|---|---|
| Projected renewable expansion | Over 4,770 GW | 2026-2031 forecast | 57% acceleration over the 2020-2025 six-year period | IEA Renewables 2026 |
| Renewable share of power additions | Over 80% share | 2026-2031 forecast | Cost competitiveness and energy security priorities | IEA Renewables 2026 |
| Average annual capacity additions | Almost 800 GW/yr | 2026-2031 forecast | Sits 57% above the 2020-2025 historical average pace | IEA Renewables 2026 |
| 2026 global capacity contraction | 11% annual decline | Calendar 2026 | Ends 21-year streak due to China competitive auction reform | IEA Renewables 2026 |
| Active grid connection queue | 3,000 GW backlog | Year-end 2026 | Advanced-stage projects; 4x 2025 wind and solar additions | IEA Renewables 2026 |
| Grid connection queue annual growth | 60% annual increase | Trailing 12 months | Driven entirely by battery storage and hybrid applications | IEA Renewables 2026 |
| Utility-scale solar PV additions | 2,075 GW | 2026-2031 forecast | Fastest-growing utility generation asset globally | IEA Renewables 2026 |
| Distributed solar PV additions | 1,530 GW | 2026-2031 forecast | Rooftop and off-grid adoption across homes and commerce | IEA Renewables 2026 |
| Solar PV share of capacity growth | 75% of total growth | 2026-2031 forecast | Commands three-quarters of all new renewable capacity | IEA Renewables 2026 |
| China share of global additions | 53% average share | 2026-2031 forecast | Moderates from over 60% in 2025 as auctions take effect | IEA Renewables 2026 |
| India share of global expansion | Nearly 8.5% share | 2026-2031 forecast | Total capacity more than doubles; 2.6x prior six-year pace | IEA Renewables 2026 |
| India solar module manufacturing | 17% global share | By 2031 projection | Diversifies crystalline silicon supply chain outside China | IEA Renewables 2026 |
| Renewable electricity share 2025 | 33% of global power | Calendar 2025 | Baseline clean generation prior to the new forecast wave | IEA Renewables 2026 |
| Renewable electricity share 2031 | Almost 45% of power | 2031 projection | Solar PV overtakes hydro in 2029 as largest clean source | IEA Renewables 2026 |
| Wind and solar power share 2031 | Over 28% of power | 2031 projection | Combined generation more than doubles worldwide | IEA Renewables 2026 |
| Technical curtailment volume 2025 | Almost 200 TWh | Calendar 2025 | Output discarded due to localized transmission bottlenecks | IEA Renewables 2026 |
| Projected curtailment volume 2031 | Exceeds 800 TWh | 2031 projection | Represents nearly 8% of total variable renewable generation | IEA Renewables 2026 |
| Avoided coal consumption 2025 | 615 million tonnes | Calendar 2025 | Direct thermal displacement by operating clean generators | IEA Renewables 2026 |
| Avoided natural gas demand 2025 | 515 billion m3 | Calendar 2025 | Eliminates more than the annual gas demand of the EU | IEA Renewables 2026 |
| Avoided crude oil demand 2025 | 2.4 million b/d | Calendar 2025 | Displaced across power peaking and electric transport | IEA Renewables 2026 |
| Rooftop solar household reach | 70 million homes | Cumulative 2026 | Small-scale systems improving power reliability globally | IEA Renewables 2026 |
Sources: IEA, Renewables 2026 Press Release, Executive Summary, Renewable electricity, and Regional forecasts and data.
What to watch
- Electrical transmission grid capital appropriations, monitoring whether national infrastructure budgets allocate sufficient high-voltage direct current (HVDC) corridor funding to clear 3,000 GW queues.
- Wholesale power market redesign across Europe and North America, observing whether regulators introduce locational marginal pricing and capacity remuneration mechanisms to preserve developer revenues amid negative midday prices.
- China’s competitive auction clearing prices, tracking whether domestic solar PV project margins recover from the 55% contraction experienced in early 2026.
- India’s vertical solar manufacturing integration, observing whether Indian ingot, wafer, and cell production facilities achieve cost parity with Tier-1 Chinese exporters by 2028.
- Long-duration energy storage (LDES) commercialization, evaluating whether utility deployments of 8-hour to 24-hour non-lithium storage technologies scale quickly enough to prevent annual curtailment from crossing 800 TWh by 2031.
- Interconnection queue attrition rates, monitoring whether strict financial milestone requirements in the United States and United Kingdom successfully filter speculative applications without dampening viable renewable investments.
The bottom line
The IEA’s Renewables 2026 outlook demonstrates that global clean energy expansion has evolved into a strategic industrial imperative. Projected to deploy over 4,770 GW between 2026 and 2031, renewable power is expanding nearly 60% faster than during the prior six years, driven by solar PV commanding three-quarters of all new capacity. As energy security replaces climate virtue as the dominant political rationale, emerging economies across India, Southeast Asia, and the Middle East are matching advanced economies in deployment for the first time. However, this historic generation boom is colliding with a 3,000 GW grid interconnection backlog that threatens to waste more than 800 TWh of clean electricity annually through technical curtailment. To turn 4,770 GW of planned capacity into energized, reliable power that pushes renewables toward 45% of global electricity by 2031, policymakers must urgently modernize electrical grid infrastructure and deploy grid-scale battery flexibility at scale. For ongoing data-led intelligence on power generation, industrial supply chains, and infrastructure transitions, explore our Industries category hub.
Related reading
- Solar Electricity Generation in 8 Numbers: How Solar PV Met One-Quarter of World Energy Growth: empirical 2025 solar generation data, coal displacement, and international capacity benchmarks.
- Global Battery Storage in 8 Numbers: The Global Storage Target and Technology Cost Plunge: battery pack economics, grid storage scaling, and electrochemical cell manufacturing.
- Who pays for the 2026 energy shock? The numbers, country by country: fossil fuel import bills, subsidy burdens, and international energy price volatility.