The global quest for clean, round-the-clock electricity has triggered a decisive renaissance in nuclear energy. According to the International Atomic Energy Agency (IAEA) in its report IAEA Projects Global Nuclear Power Capacity Could Triple by 2060, Continuing Rising Trend, worldwide nuclear generating capacity could expand more than three-and-a-half-fold over the coming decades.
The agency’s 46th annual projections, published in its landmark reference report Nuclear Power Reactors in the World, represent the sixth consecutive year in which the IAEA has upwardly revised its global nuclear forecasts. Facing surging load growth from artificial intelligence data centers, industrial electrification, and electric transport, governments and utilities are turning to nuclear fission as an essential firm zero-carbon pillar. Yet realizing this ambitious expansion requires overcoming an aging reactor fleet, supply chain bottlenecks, and licensing hurdles for next-generation small modular reactors (SMRs). Here are the eight numbers from the IAEA’s latest data that define the future of global nuclear power.
1. 413 reactors and 377.1 GW(e): The global operational baseline
The starting point for the modern nuclear industry is a consolidated, highly productive fleet. At the end of 2025, exactly 413 nuclear power reactors were operational worldwide, delivering 377.1 gigawatts electric (GW(e)) of net capacity to electrical grids.
These 413 commercial units provide firm, dispatchable baseload power across 31 countries. Operating at capacity factors that routinely remain exceptionally high, the commercial reactor fleet generates reliable power independent of weather variations.
As electricity grids confront power grid bottlenecks and transmission constraints, the high energy density and compact physical footprint of nuclear installations make them uniquely valuable. A multi-gigawatt nuclear station produces continuous power from a site occupying just a fraction of a square mile, avoiding the extensive land-use footprints and long-distance transmission lines required by dispersed renewable buildouts.
2. 1,284 GW(e) by 2060: Capacity projected to more than triple
The defining headline of the IAEA’s 46th annual assessment is the upward trajectory of long-term nuclear deployment. In its high-case projection, global nuclear power capacity expands to 1,045 GW(e) by 2050—surpassing the 992 GW(e) projected in 2024—before climbing further to 1,284 GW(e) by 2060.
Our calculation: an increase from 377.1 GW(e) in 2025 to 1,284 GW(e) in 2060 represents a 3.4-fold expansion, adding 906.9 GW(e) of net clean capacity to global power grids over the next 35 years.

Source: IAEA, Press Release 70/2026.
Even in the IAEA’s conservative low-case scenario, global nuclear capacity is projected to expand to 696 GW(e) by 2060, nearly double the 2025 baseline. This upward revision reflects commitments made by more than 25 nations at international climate summits to triple global nuclear energy capacity by 2050.
As IAEA Director General Rafael Mariano Grossi stated at the 70th IAEA General Conference on 14 September 2026: “The IAEA projections show the increasing role of nuclear power in meeting the world’s growing electricity needs. To realize this potential, investment in new nuclear capacity and reactor lifetime extensions will be essential.”
This private and public investment surge operates alongside the broader clean energy innovation and battery patent race, where advanced electrochemistry and next-generation nuclear architectures are attracting capital to decarbonize heavy industrial clusters.
3. 28%: Small Modular Reactors capture nearly one-third of new builds
While traditional gigawatt-scale light-water reactors continue to provide the bulk of existing capacity, the composition of future installations is shifting toward modular architectures. In the IAEA’s high-case projection, Small Modular Reactors (SMRs) account for 28% of all new nuclear capacity added globally by 2060.
In the low-case scenario, SMRs comprise 23% of new additions. This represents a dramatic upgrade from the previous edition of the IAEA’s projections, which had anticipated SMRs contributing 24% in the high case and just 5% in the low case.
Our calculation: SMRs are projected to deliver approximately 254 GW(e) of new capacity in the high case by 2060 (28% of the 906.9 GW(e) net expansion).
Defined generally as nuclear reactors producing smaller modular increments of power, SMRs offer prefabricated factory assembly, passive safety systems, and flexible geographic siting. Rather than requiring billions in upfront balance-sheet financing for a single multi-gigawatt project, modular reactors allow industrial operators and private utilities to add capacity in incremental steps, co-locating power directly at industrial hubs, remote mining facilities, and desalination plants.
4. 60% in North America: The regional SMR deployment frontier
The commercial adoption of modular nuclear technology is highly concentrated by region. The IAEA projects that North America will lead the world in SMR adoption, with approximately 60% of all new regional nuclear capacity expected to come from small modular designs.

Source: IAEA, Press Release 70/2026.
This North American focus is driven by private commercial demand. Hyperscale technology companies and cloud infrastructure providers have signed landmark energy offtake agreements to deploy SMR fleets to power artificial intelligence data centers. By pairing small reactors directly with compute clusters, technology firms secure carbon-free firm electricity while avoiding congested regional utility transmission queues.
Significant SMR uptake is also anticipated across emerging industrial regions. In South-Eastern Asia and in Latin America and the Caribbean, the IAEA projects that 40% of all new nuclear capacity added through 2060 will come from small modular reactors in both the high and low cases, enabling island grids and regional industrial zones to deploy nuclear power without constructing massive national transmission backbones.
5. 2,689.1 TWh: Generation hits a record but falls behind overall demand
From an operational standpoint, the global nuclear fleet delivered record electricity volumes in 2025. Total nuclear electricity generation expanded by 1.1% to reach 2,689.1 terawatt-hours (TWh).
However, global electricity demand grew at more than double that speed, expanding by 2.7% worldwide. Because total power consumption outpaced nuclear additions, nuclear power’s share of global electricity generation declined slightly from 8.7% in 2024 to 8.4% in 2025.
Our calculation: global electricity generation reached approximately 32,013 TWh in 2025 (2,689.1 TWh divided by 0.084).
This relative market share contraction occurred even as solar and wind broke installation records. As analyzed in our review of surging solar electricity generation, solar PV met the largest share of global primary energy demand growth in 2025. Yet because solar and wind generate intermittent output, utilities increasingly recognize that achieving grid reliability without coal or gas requires scaling firm nuclear baseload in parallel.
6. 14.3 GW(e) in new starts: Construction outpaces retirements
To expand global capacity, new reactor construction must outstrip scheduled retirements. In 2025, commercial construction began on 12 new nuclear power reactors with a combined capacity of 14.3 GW(e).
These 14.3 GW(e) in construction starts significantly exceeded reactor retirements during the year. Seven aging commercial reactors with a total capacity of 2.8 GW(e) were retired in 2025, while three newly built reactors totaling 3.0 GW(e) were synchronized to commercial transmission grids.
Our calculation: net capacity additions in the project pipeline were positive by 11.5 GW(e) in 2025 (14.3 GW(e) in construction starts minus 2.8 GW(e) in retirements).
Geographically, new construction starts remain heavily concentrated in Asia. As detailed in our comparison of the economic gap between India and China, China leads the worldwide construction pipeline by a wide margin, deploying standardized domestic designs like the Hualong One. Over the past decade, Chinese shipyards and heavy industrial fabricators have achieved rapid construction lead times, lowering overnight capital costs compared to Western first-of-a-kind projects.
7. Two in three over 30 years old: The aging fleet challenge
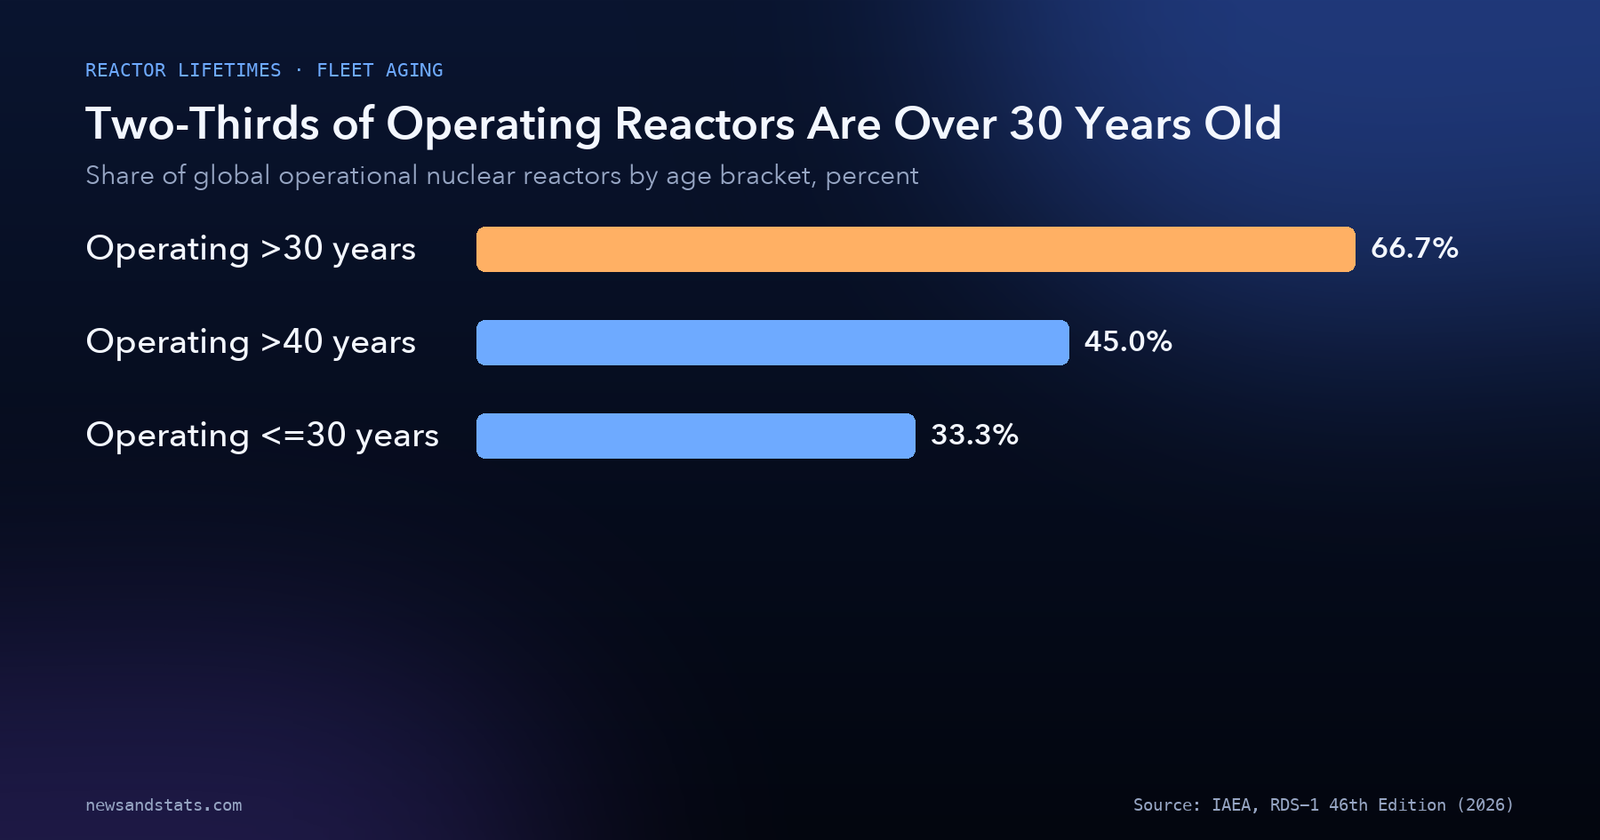
The central operational challenge facing the global nuclear industry is fleet demographic aging. The IAEA reports that two out of every three operating nuclear reactors (66.7%) have been in service for more than 30 years, and 45% have operated for more than 40 years.
Our calculation: out of 413 active commercial reactors worldwide, approximately 275 reactors have operated for more than 30 years, and roughly 186 reactors have exceeded four decades of service.
Source: IAEA, Press Release 70/2026.
Commercial reactors were originally engineered and licensed for 30- to 40-year operational lifetimes. Under the IAEA’s baseline modeling, about one-third of 2025 operational capacity would retire by 2060 in the high case, and almost two-thirds would retire in the low case if operating licenses are not renewed.
To prevent a premature loss of baseload clean generation, utilities across North America, Europe, and Asia are executing comprehensive plant life extension (PLEX) programs. Major operators are securing regulatory approvals for long-term operation (LTO) to extend reactor service lives to 60 or even 80 years. Refurbishing an existing plant to operate for an additional 20 years costs a fraction of building new capacity, providing the most cost-effective source of firm clean power available.
For nations exposed to fossil fuel import price shocks, preserving existing nuclear generation protects sovereign trade balances by directly avoiding expensive liquefied natural gas and coal imports.
8. 114 GW to 407 GW: Central and Eastern Asia drives future growth
The long-term center of gravity for global nuclear power is shifting decisively eastward. The IAEA identifies Central and Eastern Asia as the primary engine of global nuclear expansion through 2060.
In the high-case scenario, nuclear generating capacity across Central and Eastern Asia is projected to surge from 114 GW(e) in 2025 to 407 GW(e) by 2060. Nuclear electricity output across the region is expected to expand almost fivefold from 2025 levels.
Our calculation: Central and Eastern Asia will add 293 GW(e) of net nuclear capacity by 2060, accounting for 32.3% (nearly one-third) of all net nuclear capacity additions worldwide in the high case.
This expansion is propelled by large-scale multi-unit coastal energy parks in mainland China, alongside ongoing fleet expansions in South Korea and new project commitments across East Asia. By standardizing component manufacturing, creating dedicated nuclear supply chains, and training specialized construction workforces, Asian economies are driving down the levelized cost of electricity (LCOE) for nuclear power.
How to read the IAEA nuclear projections
Interpreting international nuclear energy statistics requires recognizing five critical technical distinctions:
- Net electrical capacity differs from thermal output. The IAEA’s 377.1 GW(e) metric measures net electrical power delivered to the grid, not thermal heat produced in reactor cores. Commercial nuclear reactors typically operate at thermal conversion dynamics, meaning thermal energy output is approximately three times higher than electrical output.
- High and low cases reflect policy commitments versus business-as-usual. The IAEA’s high-case projection (1,284 GW(e) by 2060) assumes that international climate pledges, reactor lifetime extensions, and SMR commercialization goals are fully implemented. The low case (696 GW(e)) assumes modest policy support and higher attrition from aging plant retirements.
- Construction start requires pouring first safety-related concrete. An announced or planned reactor project does not appear in official IAEA construction accounts until the pouring of first safety-grade nuclear concrete begins. The 12 construction starts in 2025 represent active, capital-committed physical engineering works.
- SMR capacity share differs from unit count share. Because SMR modules are smaller in capacity than traditional gigawatt-scale reactors, a 28% capacity share implies that SMRs will account for a far higher proportion of total individual reactor vessels manufactured and installed.
- Nuclear generation share reflects relative, not absolute, dynamics. Nuclear generation reached an all-time record of 2,689.1 TWh in 2025, yet its generation share dipped from 8.7% to 8.4% because total worldwide electricity consumption expanded even faster.
The global nuclear energy transition at a glance
The following table synthesizes the primary metrics from the IAEA’s 46th annual edition of Energy, Electricity and Nuclear Power Estimates for the Period up to 2060 across operational baselines, capacity projections, small modular reactor adoption, and fleet demographics.
| Metric | Measured value | Reporting benchmark | Key operational or policy driver | Source |
|---|---|---|---|---|
| Global operational reactor fleet | 413 reactors | End of 2025 | Commercial units delivering power in 31 nations | IAEA RDS-1 46th Edition |
| Global operational nuclear capacity | 377.1 GW(e) | End of 2025 | Baseline net electrical generating capacity | IAEA RDS-1 46th Edition |
| Global nuclear capacity 2050 high case | 1,045 GW(e) | 2050 projection | Up from 992 GW(e) projected in prior edition | IAEA RDS-1 46th Edition |
| Global nuclear capacity 2060 high case | 1,284 GW(e) | 2060 projection | Approximately 3.4 times the 2025 baseline | IAEA RDS-1 46th Edition |
| Global nuclear capacity 2060 low case | 696 GW(e) | 2060 projection | Nearly double the 2025 baseline capacity | IAEA RDS-1 46th Edition |
| Global nuclear electricity generation | 2,689.1 TWh | Calendar 2025 | Increased 1.1% to reach an all-time record | IAEA RDS-1 46th Edition |
| Global electricity demand growth | 2.7% annual growth | Calendar 2025 | Outpaced nuclear output, trimming share to 8.4% | IAEA RDS-1 46th Edition |
| Nuclear share of global electricity | 8.4% of total power | Calendar 2025 | Eased from 8.7% in 2024 as total load surged | IAEA RDS-1 46th Edition |
| SMR share of new global capacity 2060 | 28% in high case | 2060 projection | 23% in low case; major upgrade from prior RDS-1 | IAEA RDS-1 46th Edition |
| SMR share of new North American capacity | 60% of additions | Regional projection | Corporate AI offtake and private capital contracts | IAEA RDS-1 46th Edition |
| SMR share in SE Asia and Latin America | 40% of additions | Regional projection | Flexible siting for regional grids and industry | IAEA RDS-1 46th Edition |
| New reactor construction starts 2025 | 12 reactors (14.3 GW) | Calendar 2025 | Significantly outstripped 2.8 GW in retirements | IAEA RDS-1 46th Edition |
| Operational reactors over 30 years old | 66.7% of global fleet | Fleet status 2025 | Two in three units require lifetime extensions | IAEA RDS-1 46th Edition |
| Operational reactors over 40 years old | 45.0% of global fleet | Fleet status 2025 | Highlights critical need for refurbishment | IAEA RDS-1 46th Edition |
| Central and Eastern Asia capacity 2060 | 407 GW(e) | 2060 high case | Surges from 114 GW(e) in 2025; output up 5x | IAEA RDS-1 46th Edition |
Source: International Atomic Energy Agency (IAEA), Press Release 70/2026.
What to watch
- The pace of reactor lifetime extension approvals in North America and Western Europe, tracking whether major 60- and 80-year operating licenses are granted to offset scheduled retirements.
- Licensing and construction milestones for commercial Small Modular Reactor designs in the United States and Canada, following private hyperscaler power purchase agreements.
- Construction timelines and grid synchronizations in China, observing whether the country maintains its cadence of completing 6 to 8 large commercial reactors annually.
- Government policy implementations following the international COP28 commitment to triple global nuclear energy capacity by 2050.
- Uranium fuel cycle diversification, monitoring whether Western conversion and enrichment investments successfully reduce dependence on Russian nuclear supply chains.
- Small modular reactor deployment in emerging industrial economies, assessing whether regulatory frameworks in Southeast Asia and Eastern Europe accommodate modular builds before 2030.
The bottom line
The global nuclear power industry has entered a decisive expansionary era: operational generation reached an all-time record of 2,689.1 TWh in 2025, while the IAEA’s latest outlook projects global capacity could more than triple to 1,284 GW(e) by 2060. Driven by corporate demand for 24/7 carbon-free electricity, small modular reactors are projected to deliver 28% of all new global nuclear builds—and 60% in North America. Yet realizing this vision requires managing an aging baseline where two out of every three reactors exceed 30 years of operation, making plant lifetime extensions and streamlined licensing as vital as new construction starts. For the broader macroeconomic context framing these investments, explore our review of the macroeconomic environment from the IMF, and visit our Industries section for continuing analysis of global technology and infrastructure supply chains.
Related reading
- Data Center Power Demand Is Set to Double by 2030. The Grid Is the Bottleneck.: grid reliability, utility interconnection delays, and baseload energy demand.
- Solar Electricity Generation in 8 Numbers: How Solar PV Met One-Quarter of World Energy Growth: renewable generation milestones, solar capacity additions, and fuel displacement.
- Who pays for the 2026 energy shock? The numbers, country by country: energy import vulnerability, sovereign subsidies, and volatile fossil fuel commodity prices.