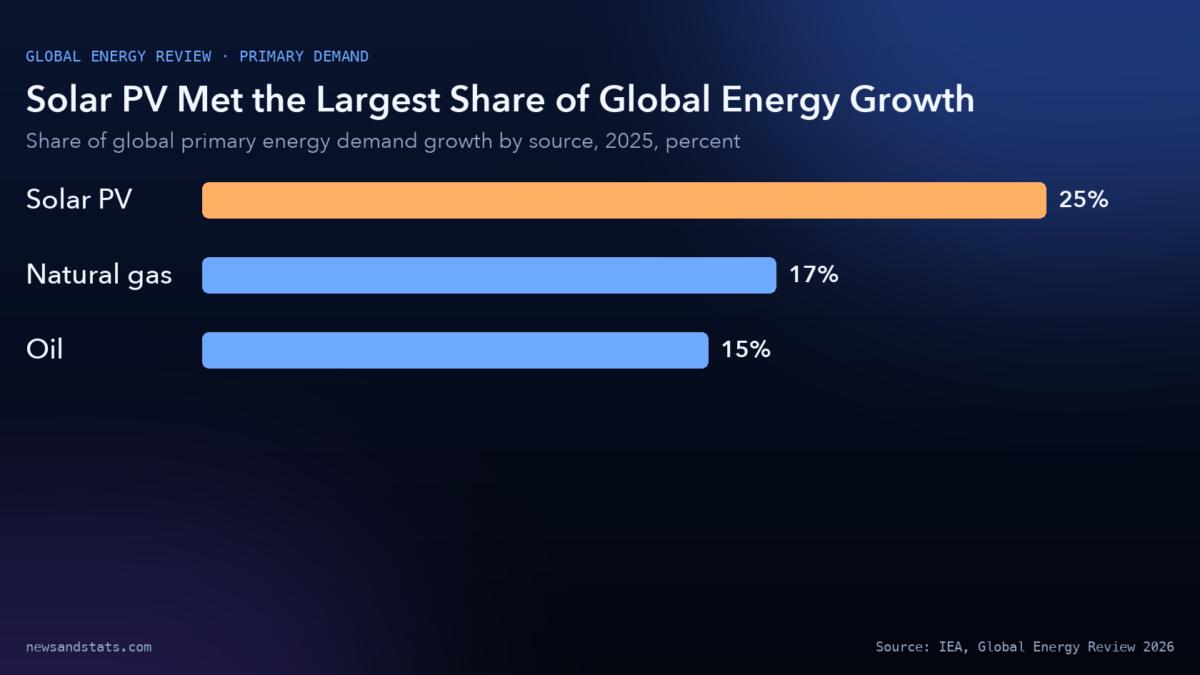
The global energy transition achieved a structural milestone in 2025. According to the International Energy Agency (IEA) in its flagship report Global Energy Review 2026 and its detailed analysis of Global trends, solar electricity generation expanded so rapidly that it met more than 25% of the entire net increase in global primary energy demand. This marked the first time in documented industrial history that a modern renewable technology contributed the largest single share of world primary energy demand growth, surpassing fossil fuels.
Overall global energy demand expanded by 1.3%, or 8 exajoules (EJ), in 2025. While that represents a modest deceleration from the 2% increase recorded in 2024, electricity consumption decoupled from total energy use, expanding at well over twice that speed. Supported by record hardware manufacturing and tumbling equipment costs, clean power installations expanded across every major continent. Here are the eight numbers that define the new global energy balance, how solar power altered the generation mix, and why fossil fuel demand is losing its structural momentum.
1. More than 25%: Solar electricity generation leads world primary energy growth
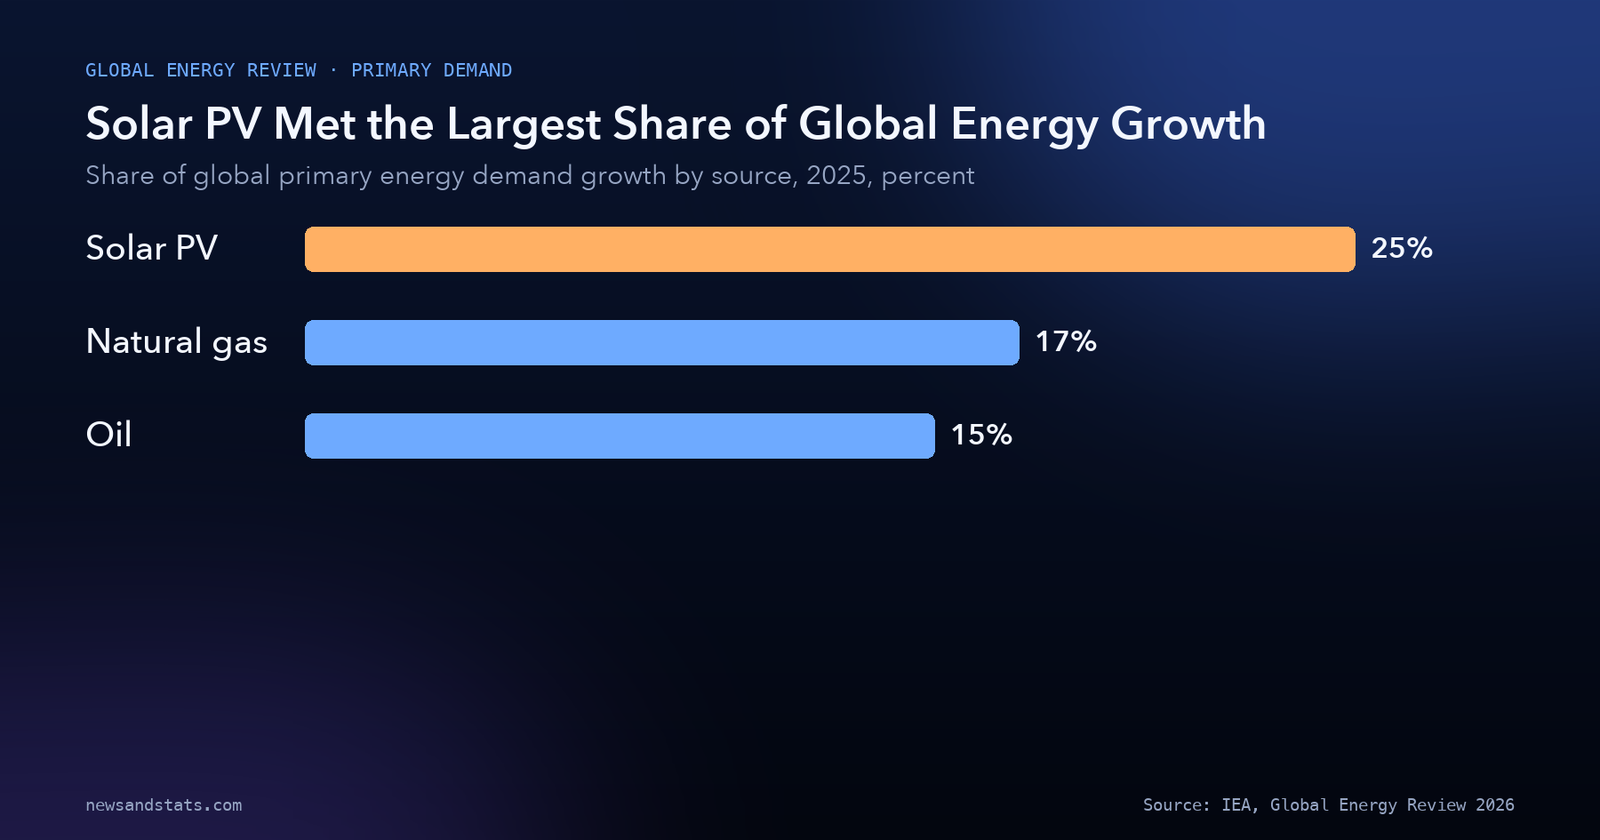
The central finding of the IEA’s assessment is the emergence of solar photovoltaic (PV) power as the primary engine of global energy growth. In 2025, higher solar generation satisfied more than 25% of incremental world primary energy demand.
Natural gas followed, meeting around 17% of global demand growth, while oil contributed around 15%. Coal demand growth slowed significantly, while nuclear and other non-hydro renewables supplied the remainder. In total, low-emissions sources—encompassing solar, wind, nuclear, hydropower, bioenergy, and geothermal—contributed nearly 60% of the entire increase in world energy demand in 2025.
Source: IEA, Global Energy Review 2026.
This achievement represents a qualitative shift in how global economic expansion is energized. In past decades, incremental GDP growth was satisfied predominantly by burning more coal, crude oil, and fossil gas. In 2025, even against the macroeconomic backdrop from the IMF where global GDP grew by 3.1%, zero-carbon power supplied the majority of incremental consumption.
The 1.3% growth rate in total energy demand reflected several moderating factors. Global temperatures in 2025, while still the third warmest on record, were slightly cooler than the record heat of 2024, lowering summer cooling needs in several emerging markets. Furthermore, global energy intensity improved by nearly 2% in 2025, returning to its 2010 to 2019 historical baseline after a sluggish post-pandemic stretch.
2. 600 TWh: The record annual leap in solar generation
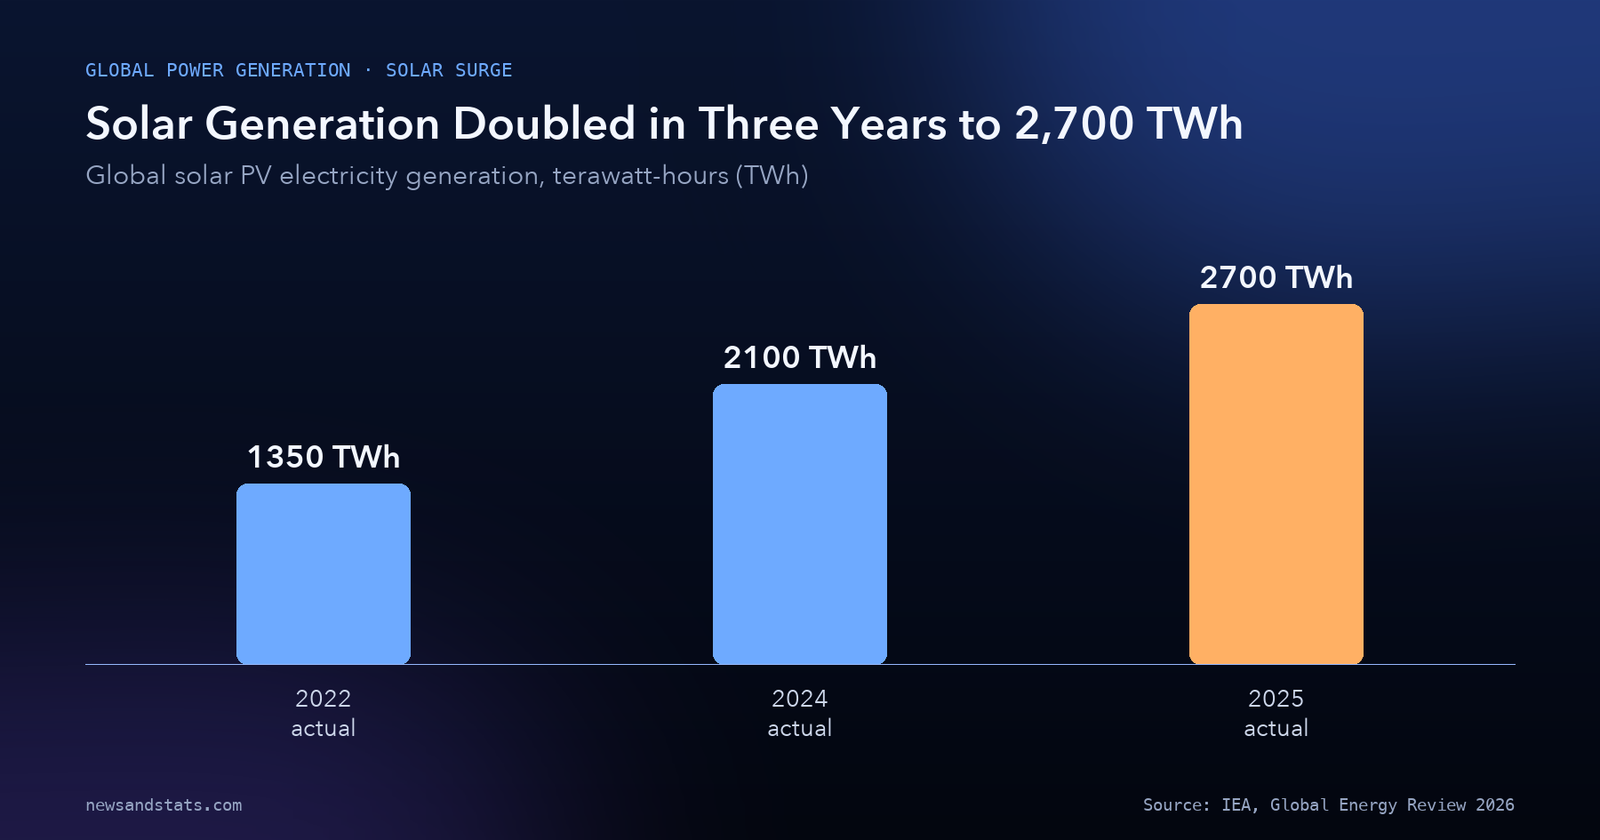
The physical volume of clean electricity added to transmission grids reached unprecedented dimensions. In 2025, global solar PV generation increased by 600 terawatt-hours (TWh).
The IEA emphasizes that this 600 TWh annual addition represents the largest absolute generation increase ever recorded for any single electricity source in history, excluding years characterized by artificial economic rebounds following global shocks like Covid-19. The surge in solar PV alone met around 70% of total world electricity generation growth in 2025.
This single-year expansion propelled total worldwide solar PV generation to nearly 2,700 TWh. To appreciate the acceleration: global solar generation stood at roughly 1,350 TWh in 2022. Our calculation: solar electricity output doubled in just three years between 2022 and 2025, and the 600 TWh added in 2025 accounted for 22.2% of the entire global solar output operating today.
Source: IEA, Global Energy Review 2026.
Solar PV now accounts for over 8% of total global electricity generation. While China accounted for the largest absolute volume of new solar installations, rapid deployment was visible across continents. The United States, India, and the Middle East all registered solar generation increases of 20% or more in 2025.
However, integrating 600 TWh of intermittent generation within twelve months created acute local transmission pressures. As analyzed in our review of power grid bottlenecks and transmission constraints, transmission networks in high-penetration regions face midday curtailment and negative wholesale pricing, accelerating the requirement for synchronous grid hardware.
3. 800 GW: A record-breaking year for renewable capacity additions
Generating hundreds of terawatt-hours requires massive physical manufacturing and deployment. Worldwide additions of renewable power capacity climbed to a record 800 gigawatts (GW) in 2025.
Solar technology comprised the overwhelming bulk of this capacity build-out. Solar PV contributed 75% of all new renewable capacity, translating to approximately 600 GW of solar installations completed and synchronized during the calendar year.
Complementary zero-carbon technologies also achieved significant installation volumes. Battery storage emerged as the fastest-growing power technology globally, with annual capacity additions surging by around 40% in 2025 to reach almost 110 GW. The IEA notes that this 110 GW battery addition exceeded the highest annual capacity build-out ever achieved by natural gas power plants in a single year.

Source: IEA, Global Energy Review 2026.
Nuclear power also re-entered expansion mode, with construction starting on over 12 GW of new reactor capacity in 2025. Total nuclear electricity output rose by 1.2% worldwide, reaching its highest level ever recorded. When combined, additions across solar, wind, nuclear, and battery storage outpaced the net growth in world power demand, exerting structural downward pressure on fossil fuel utilization.
4. 1.5% and 3%: Coal generation drops in China and India
The direct consequence of solar power’s rapid ascent was a historic contraction in fossil fuel electricity generation. In 2025, global electricity generation from coal declined for the first time since 2019, excluding the temporary economic shutdown of 2020.
This reduction was driven by the world’s two largest coal consumers:
- In China, coal-fired electricity generation fell by around 1.5%.
- In India, coal-fired electricity generation dropped by 3%.
In China, rapid additions of solar PV and wind generation met all incremental electricity demand, pushing down thermal generation hours and improving the economy’s primary energy intensity. While overall Chinese energy demand expanded by 1.7%, that rate was substantially lower than GDP growth and marked a notable deceleration from the 2.7% growth rate registered in 2024.
In India, an early and vigorous monsoon season provided abundant hydrological generation while reducing agricultural irrigation pumping and space cooling loads. Combined with rapid solar deployment, this dynamic squeezed coal power plants. As examined in our comparison of the economic gap between India and China, both Asian giants have made energy security and domestic renewable manufacturing cornerstones of their long-term industrial strategies.
On a global scale, the IEA reports that total electricity generation from all renewable sources combined now virtually matches total global generation from coal. Coal remains the largest single source of electricity worldwide, but its share has peaked and begun its structural retreat.
5. 30%: Wind and solar overtake fossil fuels in the European Union
In advanced economies, clean power crossed historic thresholds in grid dispatch. In the European Union, the combined share of solar PV and wind in electricity generation reached 30% in 2025.
For the first time on record, the combined output of wind and solar surpassed total electricity generation from fossil fuels across the EU bloc. Coal power generation in the European Union fell below 10% of total electricity generation for the first time in modern industrial history.
This milestone was achieved despite challenging winter hydrological conditions and periods of low wind availability, which temporarily required European utilities to ramp up natural gas generation. Even with gas stepping into a balancing role, the structural dominance of fossil fuels in European electricity has effectively ended.
In the United States, electricity demand increased by more than 2% in 2025, marking the second fastest annual expansion since 2000 (excluding post-recession rebounds). Data centers accounted for around 50% of total electricity demand growth in the United States, driven by artificial intelligence compute facilities and cloud clustering. Strong heating needs during a severe winter and gas-to-coal switching supported domestic US coal consumption, but solar additions continued at a record clip.
6. 0.65 mb/d: Oil demand growth slows as electric cars take one-quarter of sales
While electricity demand accelerated, oil consumption growth exhibited pronounced deceleration. Global oil demand increased by 0.65 million barrels per day (mb/d), or 0.7%, in 2025.
This 0.65 mb/d expansion was down from 0.75 mb/d in 2024, and sat far below the historical average annual increase of 1.4 mb/d recorded between 2010 and 2019. The primary driver of this slowdown was the electrification of passenger road transport.
Electric car sales continued their rapid ascent, expanding by over 20% in 2025 to surpass 20 million units sold worldwide. Electric vehicles accounted for around one-quarter (25%) of all new passenger car sales globally in 2025.
The replacement of internal combustion engines with electric drivetrains has structurally capped road gasoline demand in major markets. The incremental growth in oil demand that did occur was concentrated in aviation fuel and petrochemical feedstocks. For oil-importing nations exposed to fossil fuel import price shocks, the adoption of electric mobility and domestic solar generation provides a direct hedge against volatile maritime tanker routes.
7. 35 EJ: How clean technologies avoided fossil fuel consumption
The cumulative deployment of clean energy technologies over the past six years has created a massive wedge in global fossil fuel consumption. The IEA calculates that the rollout of clean energy infrastructure since 2019 avoided more than 35 exajoules (EJ) of annual fossil fuel demand in 2025.
To put 35 EJ in perspective: it represents approximately 7% of total global fossil fuel consumption. The avoided fossil fuel combustion breaks down into concrete physical metrics:
- Avoided coal demand reached around 800 million tonnes of coal equivalent (Mtce), an amount exceeding the entire annual coal consumption of India in 2025.
- Avoided natural gas demand exceeded 260 billion cubic meters (bcm), an amount equivalent to almost half of the entire global liquefied natural gas (LNG) export market.
- Clean energy technologies deployed since 2019 prevent 3 billion tonnes (3 Gt) of carbon dioxide emissions annually, equivalent to roughly 8% of global energy-related greenhouse emissions.
Without the rapid scaling of solar PV, wind turbines, nuclear power, heat pumps, and electric vehicles since 2019, worldwide fossil fuel combustion would have expanded significantly faster, compounding emissions and straining fuel logistics.
8. 38 Billion Tonnes: Emissions hit a record despite structural progress
Despite the rapid scaling of renewables, the absolute level of energy-related greenhouse gases reached an all-time peak. Global energy-related carbon dioxide (CO2) emissions rose by 0.4% in 2025, reaching a record high of more than 38 billion tonnes (Gt).
Total emissions from fuel combustion and industrial processes increased by around 145 million tonnes (Mt). The IEA estimates that weather-related anomalies—including severe cold snaps in North America and drought-induced shortfalls in European and Latin American hydropower—pushed up fossil fuel combustion emissions by around 90 million tonnes.
A notable geographical divergence unfolded in 2025:
- In China, CO2 emissions fell by around 0.5%, driven by the massive deployment of solar and wind, growing EV fleets, and structural reductions in output from energy-intensive heavy industries like steel and cement.
- In India, energy-related emissions were flat for the first time since normal economic conditions in the 1970s, as a strong monsoon boosted hydro and solar squeezed coal dispatch.
- In advanced economies, emissions rose by 0.5%, marking the first annual increase since 2018 (excluding the 2021 post-pandemic rebound), caused by severe winter heating demands and natural gas pricing dynamics in the United States.
Consequently, emissions from advanced economies grew faster (+0.5%) than emissions from emerging market and developing economies (+0.3%) for the first time since the 1990s.
The broader analytical context for this transition is detailed in the IEA’s complete Global Energy Review 2026. As clean generation hardware scales, the industrial battleground is shifting toward semiconductor manufacturing supply chains, where advanced microelectronics, power management chips, and smart inverters dictate how effectively solar generation is synchronized with regional grids.
How to read the Global Energy Review numbers
Navigating macroeconomic energy datasets requires recognizing five technical distinctions:
- Primary energy differs from electricity generation. Primary energy measures the total energetic content of raw fuels harvested (including crude oil, coal, and sunlight), whereas electricity generation measures the electrical output delivered to grids. Solar PV accounted for over 25% of primary energy growth and 70% of electricity generation growth in 2025.
- Nameplate capacity differs from energy delivered. An 800 GW renewable build-out represents peak nameplate capacity under standard test conditions. Because solar operates at lower capacity factors (typically 15% to 25%) than thermal baseload plants, capacity additions must be substantially larger in gigawatt terms to generate equivalent terawatt-hours.
- Weather adjustments separate cycles from structural trends. The IEA isolates weather-related variations in heating degree days (HDD) and cooling degree days (CDD). In 2025, weather pushed down coal use in India but drove up natural gas combustion in North America and Europe.
- Avoided consumption is a cumulative counterfactual. The 35 EJ of avoided fossil fuel demand measures what global consumption would have been if post-2019 clean hardware had not been built, calculated using standard displacement substitution methodologies.
- Slowdown in growth is not an absolute peak. Global energy demand growth slowed to 1.3% and emissions growth slowed to 0.4%, but both reached new absolute record highs in volume. Structural displacement takes years to turn flattening growth curves into sustained absolute declines.
The 2025 global energy transition at a glance
The following table synthesizes the primary metrics from the IEA’s Global Energy Review 2026 across primary fuels, generation technologies, capacity additions, and greenhouse emissions.
| Indicator | Value in 2025 | Annual change | Key driver or regional milestone | Source |
|---|---|---|---|---|
| Total global primary energy demand | 8 EJ growth | +1.3% | decel. from 2% in 2024; efficiency +2% | IEA Global Energy Review |
| Solar PV share of primary energy growth | >25% | Largest share | First time a modern renewable led growth | IEA Global Energy Review |
| Global electricity demand growth | +800 TWh | ~3% | Grew 2.3x faster than total energy demand | IEA Global Energy Review |
| Solar PV electricity generation | ~2,700 TWh | +600 TWh | Largest single-year increase by any source | IEA Global Energy Review |
| Solar share of electricity growth | ~70% | Landmark | Met bulk of incremental power demand | IEA Global Energy Review |
| Total renewable capacity additions | 800 GW | Record | Solar PV contributed 75% (600 GW) | IEA Global Energy Review |
| Battery storage capacity additions | ~110 GW | +40% | Surpassed highest-ever annual gas builds | IEA Global Energy Review |
| Nuclear power construction starts | >12 GW | Rebound | Generation reached highest level ever (+1.2%) | IEA Global Energy Review |
| Coal power generation (China & India) | Fall in coal | -1.5% CN, -3% IN | First global coal drop since 2019 (excl. 2020) | IEA Global Energy Review |
| EU wind and solar generation share | 30% | Milestone | Surpassed total fossil fuel generation | IEA Global Energy Review |
| Global oil demand growth | 0.65 mb/d | +0.7% | Down from 0.75 mb/d; EV sales >20 million | IEA Global Energy Review |
| Avoided annual fossil fuel demand | >35 EJ | Cumulative | Equal to 7% of annual fossil fuel use | IEA Global Energy Review |
| Global energy-related CO2 emissions | >38 Gt | +0.4% (145 Mt) | Record high; China fell 0.5%, India flat | IEA Global Energy Review |
Sources: IEA, Global Energy Review 2026: Key findings and Global trends.
What to watch
- Whether solar PV generation maintains its 600 TWh annual expansion pace in 2026 or confronts curtailment bottlenecks in major regional grids.
- Grid battery storage additions in 2026, tracking whether the sector can replicate its 40% growth rate and 110 GW installation benchmark.
- Data center power consumption in the United States, following the sector’s absorption of 50% of incremental US electricity demand in 2025.
- Global coal power generation trajectories in China and India, assessing whether 2025 marked the definitive peak of worldwide coal-fired electricity.
- Passenger electric vehicle adoption rates, monitoring whether global sales exceed 25 million units after surpassing the 20 million threshold in 2025.
- Global carbon emissions in 2026, observing whether structural declines in China and stabilization in India finally initiate an absolute downward curve in global totals.
The bottom line
The global energy system reached a historic turning point in 2025: solar electricity generation provided more than one-quarter of all world primary energy growth, adding an unprecedented 600 TWh to transmission grids while renewable capacity expanded by 800 GW. With renewables now matching global coal output and EV sales topping 20 million units, clean technologies avoided 35 EJ of fossil fuel consumption. Yet with overall emissions reaching a record 38 billion tonnes, the transition remains a contest between surging clean generation and rising energy consumption in an electrifying world. For additional analysis of international economic dynamics, explore our World in Numbers section, and visit our energy technology intellectual property coverage for deeper reporting on industrial supply chains.
Related reading
- Who pays for the 2026 energy shock? The numbers, country by country: how fossil fuel import dependencies create national fiscal exposure.
- Data Center Power Demand Is Set to Double by 2030. The Grid Is the Bottleneck.: the transmission and power challenges created by digital compute clustering.
- The world economy in 8 numbers: what the IMF’s October 2026 outlook says: the global macroeconomic environment framing energy demand.