The transition from fossil-fueled electricity to wind and solar energy is confronting a fundamental physics problem: the mismatch between variable natural weather patterns and instantaneous grid demand. Solar panels generate surplus power at midday when electricity prices often collapse to zero, while consumer demand peaks during evening hours when the sun has set. Solving this intermittency challenge without relying on natural gas peaker plants or coal boilers requires immense energy storage capacity. According to the International Energy Agency (IEA) in its comprehensive study Executive summary – Batteries and Secure Energy Transitions and its detailed sector review Status of battery demand and supply, global battery storage has emerged as the fastest-growing commercial energy technology on earth.
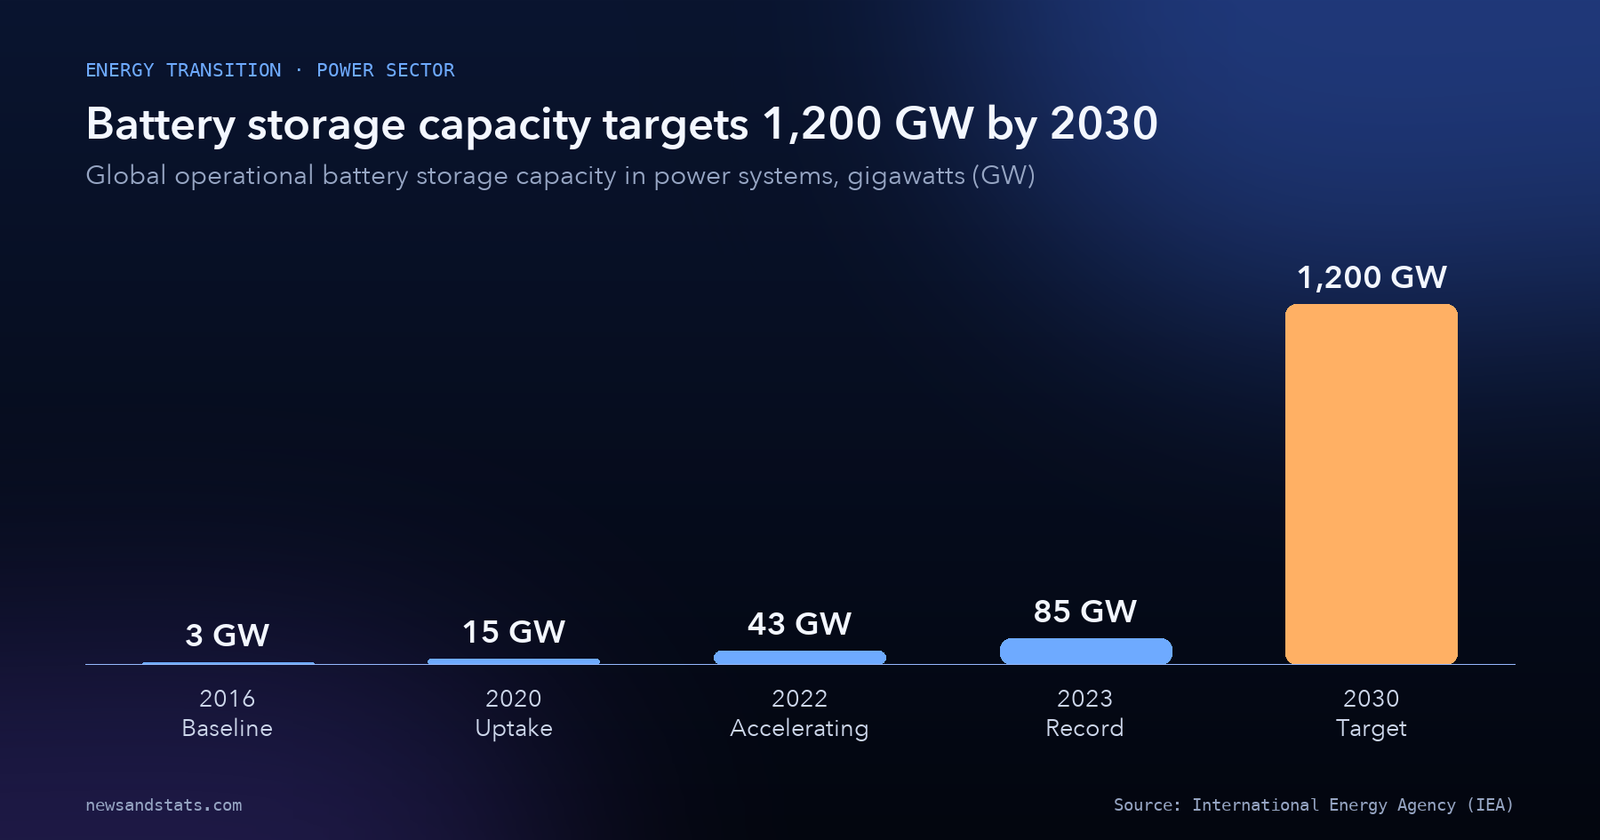
In 2023, global annual additions of battery storage in the power sector more than doubled, adding 42 GW of new capacity and pushing total operational storage past 85 GW. Over the past decade, lithium-ion battery pack prices collapsed by 90%, transforming electrochemical storage from an expensive research novelty into a cost-competitive utility asset. Yet the clean energy transition requires a much steeper ramp: to fulfill the COP28 pledge of tripling global renewable energy capacity, the IEA calculates that power sector battery storage must expand 14-fold to 1,200 GW by 2030. Here are the eight numbers that define the global battery storage revolution, its industrial bottlenecks, and its role in stabilizing the modern power grid.
1. 85 GW: Total power sector battery storage reaches a record high
The headline metric of the utility storage boom is operational capacity. By the end of 2023, total battery storage in use across the global power sector exceeded 85 GW.
This marks an extraordinary transformation in less than a decade. In 2016, global operational battery storage in power systems stood at just 3 GW. In 2020, it stood at 15 GW, and by 2022, it had reached 43 GW. Our calculation: operational power sector battery storage expanded by 2,733% between 2016 and 2023, multiplying by more than 28 times in seven years.
In 2023 alone, grid operators and commercial developers added 42 GW of battery storage capacity globally—more than doubling additions year-on-year and exceeding the cumulative total installed in all preceding human history.
This surge was split between two primary deployment models:
- Utility-scale projects accounted for 65% of 2023 additions, deployed as multi-megawatt containerized installations directly connected to high-voltage transmission grids.
- Behind-the-meter systems accounted for 35% of additions, installed by homeowners and commercial businesses pairing rooftop solar panels with residential battery packs.
This buildout directly enables the rapid expansion of solar photovoltaic generation. By absorbing midday solar generation and discharging during evening net peak demand, battery systems prevent clean energy curtailment while delivering essential grid-balancing services.
2. 1,200 GW: The 14-fold storage surge required by 2030
While recent growth has broken historical records, it represents only the opening phase of what the global energy transition demands. At the COP28 climate summit in 2023, nearly 200 nations agreed to triple global renewable power capacity by 2030. The IEA projects that maintaining electricity security while integrating this massive influx of solar and wind requires total global energy storage capacity to expand sixfold, rising to 1,500 GW by 2030 in the Net Zero Emissions by 2050 (NZE) Scenario.
Battery storage is projected to deliver 90% of that expansion, surging 14-fold from 85 GW in 2023 to 1,200 GW in 2030. The remainder will be complemented by pumped storage hydropower, compressed air, and mechanical flywheels.
Source: IEA, Batteries and Secure Energy Transitions.
Our calculation: adding 1,115 GW of new battery storage between 2024 and 2030 requires global deployment to expand by an average annual pace of 25% each year.
The rapid construction timeline of battery storage provides a decisive advantage over conventional grid infrastructure. While high-voltage transmission lines require 5 to 15 years to permit and build, and pumped hydro reservoirs require decades of civil engineering, utility-scale battery systems can be permitted, assembled, and commissioned in a matter of months. This speed makes battery storage the primary near-term buffer for managing escalating data center power demand and industrial electrification bottlenecks.
3. 90% cost plunge: From $1,400 to $140 per kilowatt-hour
The catalyst driving this deployment is one of the steepest cost declines in the history of industrial technology. In 2010, the average price of a lithium-ion battery pack stood at $1,400 per kilowatt-hour ($/kWh). By 2023, intensive manufacturing scale and process engineering reduced pack prices to less than $140/kWh—a 90% cost reduction.

Source: IEA, Batteries and Secure Energy Transitions.
This deflationary trajectory outclassed all alternative storage technologies. Between 2010 and 2023, battery energy density doubled while cycle life extended past 5,000 charge-discharge cycles.
The IEA projects that this cost decline will continue. Technological innovation in cell chemistry and automated high-throughput manufacturing is expected to drive global average lithium-ion battery costs down by an additional 40% between 2023 and 2030, bringing pack prices toward $80/kWh.
As battery costs drop, the economics of power generation shift permanently. In India, solar PV paired with four-hour battery storage is already fully competitive with new coal-fired power plants. Within the next two years, the IEA projects that solar-plus-storage will become cheaper than new coal power in China and cheaper than new natural gas peaker plants in the United States.
4. 85%: China’s dominance of global battery cell manufacturing
While battery deployment is expanding globally, the industrial supply chain remains heavily concentrated in a single geography. China possesses almost 85% of global battery cell production capacity and controls well over half of worldwide raw material refining for lithium and cobalt.
By comparison, North America and Europe each hold 10% or less of the global supply chain for critical battery metals and finished cells.

Source: IEA, Batteries and Secure Energy Transitions.
Our calculation: China’s cell production capacity exceeds that of North America and Europe combined by more than 4.2 to 1. China is also the largest end-market, accounting for over half of all batteries in use across the global energy sector in 2023.
However, the IEA notes that supply chain diversification is beginning. If all announced manufacturing gigafactories are constructed on schedule, North America and Europe are each projected to expand their domestic manufacturing shares to about 15% by 2030, sufficient to satisfy nearly all their domestic battery requirements and reducing China’s global manufacturing share to approximately two-thirds.
5. 80%: The decisive takeover of lithium iron phosphate (LFP)
Within lithium-ion technology, a major chemical transition has restructured the stationary storage market. In 2023, lithium iron phosphate (LFP) chemistry captured 80% of all new utility-scale battery storage installations globally.
LFP has achieved dominance over nickel-manganese-cobalt (NMC) chemistries because stationary storage prioritizes economics and longevity over weight:
- LFP eliminates expensive and ethically vulnerable minerals like cobalt and nickel, utilizing abundant iron and phosphorus.
- LFP provides significantly lower thermal runaway risk and lower flammability, reducing insurance and fire suppression costs in dense utility container yards.
- LFP offers longer cycle life, allowing utility installations to operate reliably for 10 to 15 years with minimal capacity degradation.
While EV manufacturers utilize nickel-rich chemistries in over half of new electric car sales to maximize driving range, LFP captured 40% of global EV sales in 2023, highlighting its broad industrial adoption.
Looking beyond 2025, emerging sodium-ion batteries are poised to challenge LFP in grid storage. Sodium-ion batteries eliminate lithium entirely, utilizing cheap sodium compounds that yield production costs 30% lower than LFP, providing a crucial hedge against lithium commodity price spikes. This materials transition mirrors patterns analyzed in our tracking of patenting across clean energy innovation.
6. $150 billion: Capital investment powers the manufacturing boom
Capital allocation to battery technology has expanded into a mega-scale industrial asset class. According to the IEA, global annual investment in batteries reached $150 billion in 2023.
This capital flood represents a structural shift across private equity and corporate balance sheets:
- Investment in EV battery manufacturing surged eightfold since 2018, totaling $115 billion in 2023.
- Investment in stationary battery storage surged fivefold over the same period, reaching $35 billion.
- Early-stage battery technology startups attracted $6 billion in venture capital funding in 2023 alone.
Our calculation: total battery investment expanded from roughly $21 billion in 2018 to $150 billion in 2023, a 614% increase in annual capital commitments.
The economic prize is expanding rapidly. The IEA projects that the global market value of battery packs across EVs and stationary storage will more than quadruple from $120 billion in 2023 to nearly $500 billion in 2030 under the NZE Scenario, transforming batteries into an industrial pillar rivaling the traditional automotive and aerospace sectors.
7. 2,400 GWh: Total battery volume in the energy sector quadruples
The physical throughput of battery manufacturing reflects this financial expansion. Total battery capacity deployed across the energy sector exceeded 2,400 gigawatt-hours (GWh) in 2023—a fourfold increase from 2020.
The energy sector now commands overwhelming priority in global battery consumption:
- Over 90% of annual lithium-ion battery demand originates from the energy sector (electric vehicles and power storage), compared to only 50% in 2016 when consumer electronics dominated cell purchases.
- In 2023, electric vehicles consumed over 750 GWh of battery capacity, powering 14 million new electric cars and expanding the global electric fleet to nearly 45 million EVs, as analyzed in our review of electric car sales reaching new global highs.
- In 2030, global EV deployment is projected to displace 8 million barrels of crude oil per day—exceeding Europe’s entire current oil consumption for road transport.
This massive volume has completely subordinated consumer electronics. A market once defined by laptop and smartphone batteries is now dictated by utility grid procurements, automotive contracts, and bulk chemical refining across rare earth and critical mineral supply chains.
8. $12.5 billion: The annual fossil fuel penalty of failing to scale storage
The consequences of failing to build adequate battery storage are severe. In its analysis of grid bottlenecks, the IEA modeled a “Low Battery Case” where regulatory hurdles, interconnection delays, and supply chain constraints slow storage deployment.
The findings demonstrate that battery storage is the critical keystone of the entire renewable energy transition:
- In the Low Battery Case, the uptake of solar PV stalls due to grid congestion, putting at risk close to 500 GW of solar capacity needed to triple renewable generation by 2030.
- Without storage to balance midday solar surpluses, power systems are forced to maintain prolonged operation of unabated coal-fired and natural gas-fired generation.
- Importing countries would incur an average penalty of $12.5 billion per year in additional fossil fuel import bills between 2030 and 2050.
- Europe and South Korea face the highest economic exposure for natural gas imports, while India faces the largest financial exposure for coal imports.
Overall, the IEA calculates that 60% of all energy sector CO2 emissions reductions projected to 2030 in the NZE Scenario are directly or indirectly enabled by batteries. Without battery storage, decarbonization of the global power grid stalls permanently.
How to read battery storage metrics
Interpreting utility storage announcements requires understanding five fundamental operational distinctions:
- Power capacity (GW) differs from energy capacity (GWh). Headline gigawatt figures measure instantaneous electrical power injection, while gigawatt-hour metrics quantify sustained duration over multi-hour discharge windows.
- Four-hour duration is the standard utility benchmark. While early batteries provided short 30-minute to 1-hour bursts for frequency regulation, modern grid-scale procurements overwhelmingly deploy 4-hour systems designed to shift midday solar peak generation into the evening demand window.
- Sticker pack cost differs from installed system capex. While lithium-ion battery cell costs have fallen rapidly and packs cost under $140/kWh, total installed project costs include bidirectional inverters, transformers, thermal management, software controls, civil works, and grid interconnection fees.
- Behind-the-meter storage creates Virtual Power Plants (VPPs). Aggregating thousands of distributed residential batteries through software allows grid operators to dispatch decentralized power during peak hours, reducing the need for expensive transmission line expansions.
- Supply chain lead times govern deployment speed. While containerized battery storage can be physically erected in 6 to 12 months, grid interconnection queues in the United States and Europe routinely delay energization by 3 to 7 years due to transmission substation shortages.
Global battery storage at a glance
The following table summarizes the core empirical benchmarks and 2030 targets established in the IEA’s Batteries and Secure Energy Transitions report across power storage, EV adoption, manufacturing capacity, and economic parameters.
| Metric | Measured value | Reporting benchmark | Core energy system or industrial driver | Primary source |
|---|---|---|---|---|
| Total power battery storage capacity | Over 85 GW | Year-end 2023 | Record baseline; expanded from 3 GW in 2016 | IEA Batteries Report |
| Annual battery storage additions 2023 | 42 GW added | Calendar 2023 | More than doubled year-on-year; 65% utility-scale | IEA Batteries Report |
| Target battery storage capacity 2030 | 1,200 GW | 2030 NZE Scenario | 14-fold expansion needed to support tripling renewables | IEA Batteries Report |
| Total energy storage target 2030 | 1,500 GW | 2030 NZE Scenario | Sixfold growth; batteries deliver 90% of expansion | IEA Batteries Report |
| Average battery storage annual growth | 25% per year | 2023 to 2030 requirement | Required annual deployment pace to achieve 1,200 GW | IEA Batteries Report |
| Average battery pack price 2023 | Under $140/kWh | Calendar 2023 | Down 90% from $1,400/kWh in 2010 | IEA Batteries Report |
| Projected battery pack price 2030 | Toward $80/kWh | 2030 projection | Further 40% reduction driven by automated scale | IEA Batteries Report |
| China battery cell production share | Nearly 85% | Calendar 2023 | Extreme manufacturing concentration in cells and refining | IEA Batteries Report |
| North America battery cell share | 10% or less | Calendar 2023 | Projected to reach 15% by 2030 under domestic policies | IEA Batteries Report |
| Europe battery cell share | 10% or less | Calendar 2023 | Projected to reach 15% by 2030 under domestic policies | IEA Batteries Report |
| LFP share of utility battery storage | 80% market share | Calendar 2023 | Replaced nickel/cobalt due to lower cost and safety | IEA Batteries Report |
| LFP share of global EV car sales | 40% market share | Calendar 2023 | Dominant entry-level EV chemistry globally | IEA Batteries Report |
| Annual global battery investment | $150 billion | Calendar 2023 | Surged eightfold for EVs and fivefold for storage since 2018 | IEA Batteries Report |
| Total energy sector battery volume | Over 2,400 GWh | Calendar 2023 | Fourfold increase from 2020; over 90% for energy sector | IEA Batteries Report |
| Electric vehicles on the road | Nearly 45 million EVs | Calendar 2023 | Includes passenger cars, commercial buses, and trucks | IEA Batteries Report |
| Transport oil displaced by EVs 2030 | 8 million barrels/day | 2030 NZE Scenario | Exceeds total current road transport oil use in Europe | IEA Batteries Report |
| Solar PV capacity at risk without storage | Close to 500 GW | Low Battery Case | 20% of renewable gap between STEPS and NZE | IEA Batteries Report |
| Annual fossil fuel import penalty | $12.5 billion/year | Low Battery Case 2030–2050 | Extra fuel costs incurred by importing countries | IEA Batteries Report |
| Global battery pack market value 2030 | Nearly $500 billion | 2030 NZE Scenario | Quadruples from $120 billion in 2023 | IEA Batteries Report |
| Sodium-ion cost advantage over LFP | 30% production saving | Emerging benchmark | Eliminates lithium, cobalt, and nickel dependencies | IEA Batteries Report |
Sources: International Energy Agency, Batteries and Secure Energy Transitions – Executive Summary and Status of battery demand and supply.
What to watch
- Grid interconnection queue reforms in the United States (FERC Order 2023) and the European Union, observing whether streamlined cluster studies accelerate battery energization.
- The commercial rollout of utility-scale sodium-ion storage projects, monitoring whether cell cost savings survive cold-temperature cycle testing.
- The deployment of long-duration energy storage (LDES) technologies exceeding 10 hours of discharge duration, including iron-air and flow batteries.
- Regulatory reforms establishing capacity market payments and multi-service remuneration for stationary batteries, ensuring revenue stacking for frequency regulation and energy arbitrage.
- Battery recycling capacity expansion in North America and Europe, evaluating whether closed-loop black mass refining supplies critical secondary lithium and nickel.
- The buildout of domestic cathode and battery cell manufacturing facilities under the US Inflation Reduction Act and EU Net-Zero Industry Act, tracking progress toward the 15% regional market share targets by 2030.
The bottom line
The global battery storage revolution has established itself as the indispensable foundation of the clean energy transition: operational storage in power systems reached a record 85 GW in 2023 as battery pack prices collapsed by 90% to under $140/kWh, enabling solar-plus-storage to undercut coal in India and natural gas in the United States. To triple global renewable capacity by 2030, battery storage must expand 14-fold to 1,200 GW, providing 90% of all new energy storage capacity while preventing $12.5 billion in annual fossil fuel import penalties across energy-importing economies. Although China retains an overwhelming 85% manufacturing lead in battery cells, surging global investments totaling $150 billion annually and the rapid shift to cobalt-free LFP chemistry are building a resilient, decentralized storage layer for the world\’s electrical networks. For continuing analysis of the industrial technologies and supply chains reshaping global energy systems, visit our Industries section.
Related reading
- Solar Electricity Generation in 8 Numbers: How Solar PV Met One-Quarter of World Energy Growth: renewable installations, capacity additions, and energy transition milestones.
- Clean Energy Innovation in 8 Numbers: The Patent Race and Battery Dominance: clean energy patent filings, battery chemistry dominance, and global R&D investments.
- Global Electric Car Sales in 8 Numbers: The Electric Transition and Export Surge: electric vehicle adoption, charging infrastructure, and transport oil displacement.