The multi-decade global crusade against severe human deprivation has ground to a complete standstill.
According to the official global extreme poverty findings published in the World Bank’s flagship Poverty, Prosperity, and Planet Report 2026: Jobs at the Center of Poverty Eradication, worldwide progress in reducing extreme poverty has halted. In 2026, an estimated 811 million people—equivalent to 1 in 10 people globally—live on less than $3.00 a day (measured at 2021 purchasing power parity). This headcount rate has remained essentially unchanged since 2019, reflecting seven consecutive years of lost development momentum.
The human cost of this stagnation is immense. Had the robust pace of poverty alleviation achieved between 2000 and 2013 continued uninterrupted over the past decade, 243 million fewer people would be living in extreme poverty today. Subtracting those 243 million people from the 811 million actual total reveals that the world should have reduced its extreme poor population to 568 million by 2026 (my calculation).
Even more concerning is the widening layer of near-poverty directly above the extreme threshold. Escaping extreme destitution has not delivered economic security: nearly half of humanity—3.7 billion people—survives on less than $8.30 a day. With 1.5 billion people exposed to acute climate hazards without basic social safety nets, hundreds of millions of families remain a single medical bill, drought, or job loss away from tumbling back into severe deprivation.
1. The $3.00 plateau: 811 million trapped in extreme poverty
Between the late 1990s and 2013, the reduction of extreme poverty stood as one of the modern global economy’s greatest accomplishments.
During that golden development window, rapid industrial growth across East Asia and South Asia lifted hundreds of millions of agrarian workers into manufacturing and service employment. Global extreme poverty rates plummeted year after year.
However, over the last decade, that historical engine has broken down:
- 811 million people in 2026: Approximately 10% of the world’s population remains trapped below the extreme poverty line of $3.00 a day.
- Stagnant since 2019: The global poverty rate has flatlined, failing to make net headway against population growth in the poorest nations.
- The 243 million gap: The World Bank estimates that 243 million additional people are living in extreme poverty today solely because the 2000–2013 rate of progress evaporated.
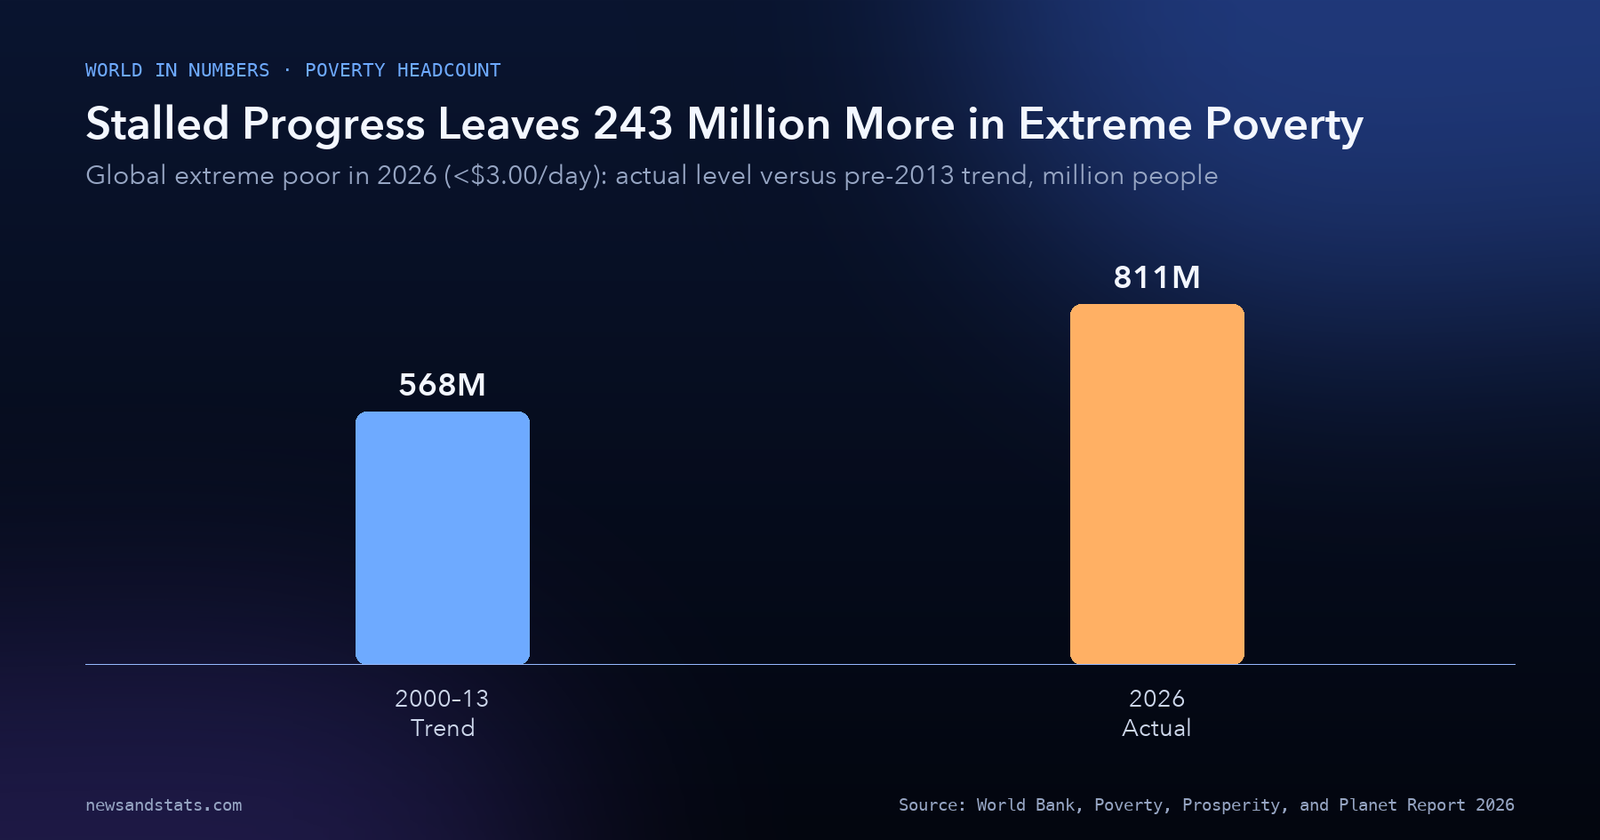
Source: World Bank, Poverty, Prosperity, and Planet Report 2026, Figure 1.1: Extreme poverty against the 2000–13 trajectory.
Dividing the 243 million lost-progress population by the 811 million total indicates that 29.96% of today’s extreme poor would have escaped destitution under the prior growth path (my calculation).
This stalling is not merely a temporary artifact of the post-pandemic recovery. The World Bank warns that at the sluggish per capita economic growth rates recorded between 2010 and 2019, both the global extreme poverty rate and the absolute headcount of people living in extreme poverty will be higher in 2030 than they are today. The United Nations Sustainable Development Goal of eradicating extreme poverty by 2030 is now quantitatively out of reach.
2. The vulnerability tier: 3.7 billion live on under $8.30 a day
Public discourse frequently treats poverty as a binary condition: one is either extremely poor or safely middle class. The World Bank’s 2026 telemetry dismantles this misconception.
Across the developing world, millions of families who crossed the $3.00-a-day extreme poverty line have merely advanced into an expansive zone of acute economic vulnerability.
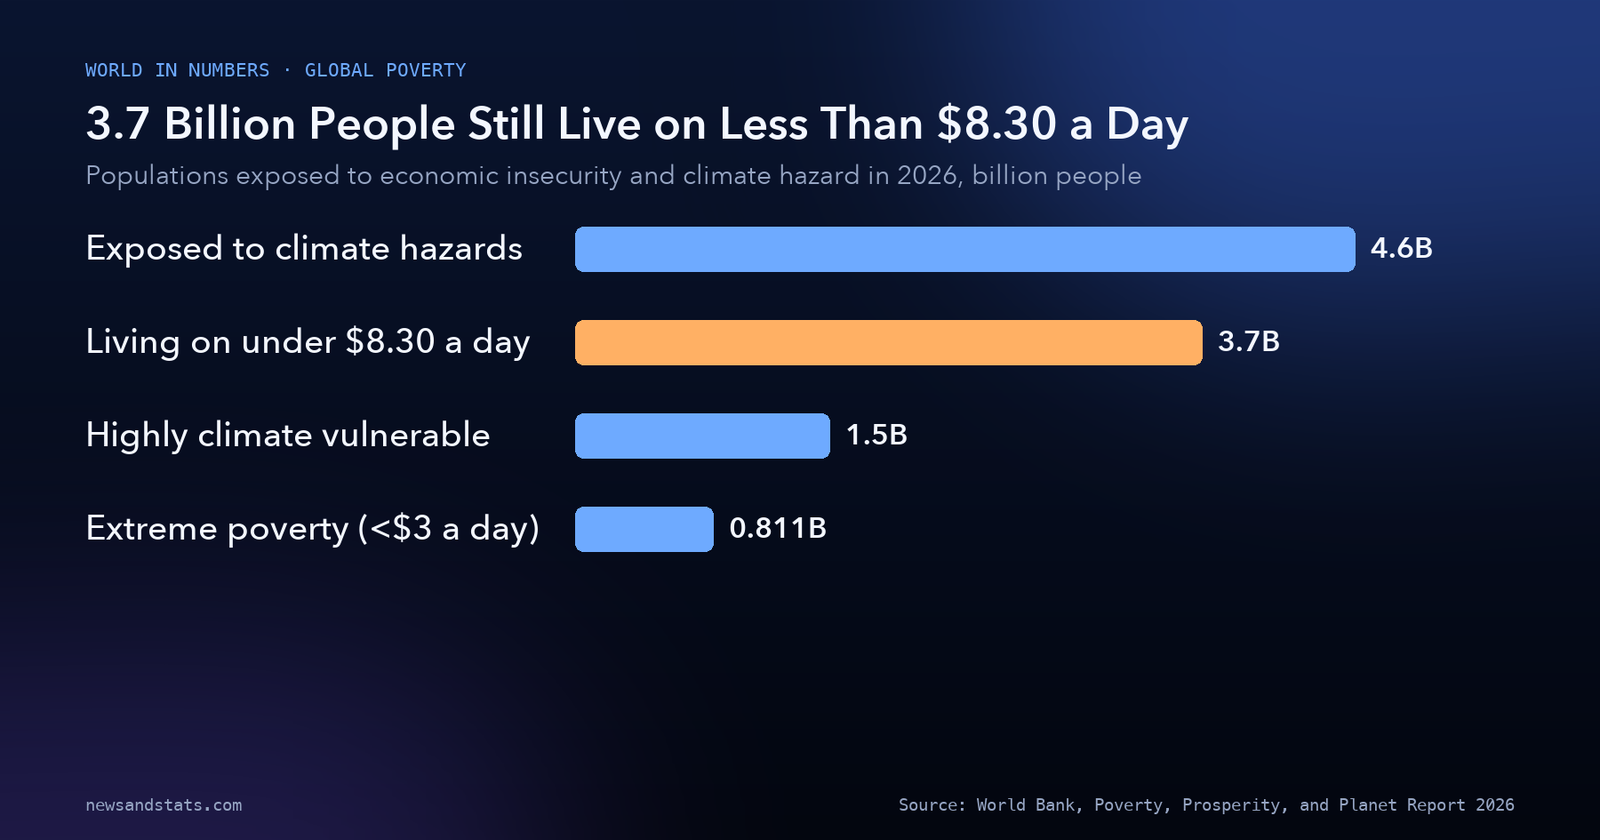
Source: World Bank, Poverty, Prosperity, and Planet Report 2026, Key Messages at a Glance.
The data outlines a stark pyramid of global economic standards:
- 3.7 billion people live on less than $8.30 a day: This threshold represents the typical national poverty line of upper-middle-income countries. It encompasses nearly half of the entire human population.
- The $4.20 lower-middle-income line: Between the extreme $3.00 line and the upper $8.30 line sits the $4.20-a-day standard, capturing over 1.8 billion individuals who subsist with precarious access to clean water, electricity, and formal sanitation.
- Subtracting extreme poverty: Subtracting the 811 million extreme poor from the 3.7 billion total reveals that approximately 2.889 billion people live in the precarious buffer zone between $3.00 and $8.30 a day (my calculation).
This vast vulnerable majority possesses virtually zero financial reserves. As detailed in our coverage of global food prices and agricultural commodity shocks, lower-income households spend 40% to 60% of their total daily budget on basic staples such as wheat, rice, and cooking oil. When global commodity markets experience supply shocks, families in the $3.00 to $8.30 band immediately reduce nutritional intake, pull children from secondary schooling, or exhaust their small savings, sliding back under the extreme line.
3. Regional concentration: why 87% will be in Africa and conflict zones by 2030
A critical structural transformation documented in the 2026 report is the intense geographic concentration of human destitution.
Extreme poverty is no longer dispersed uniformly across emerging markets. Instead, it is retreating into a localized cluster of fragile states:
- Nine economies hold more than 50%: More than half of all people living in extreme poverty today reside in just nine countries.
- The 2030 concentration projection: By 2030, the World Bank projects that 87 percent of all extreme poor globally will live in Sub-Saharan Africa, in fragile and conflict-affected situations (FCS), or in both.
- Divergence from other regions: In East Asia, Southeast Asia, and Latin America, extreme poverty rates have declined to low single digits. By contrast, in Sub-Saharan Africa, rapid population growth combined with sluggish economic expansion has caused the absolute number of poor individuals to rise.
This geographical entrapment reflects the severe fiscal headwinds examined in our analysis of low-income countries facing debt distress. When sovereign debt service consumes more than 15% to 20% of total tax revenues, governments in low-income African nations are forced to slash public capital investments, primary healthcare clinics, and rural electrification programs, extinguishing the primary escape routes from generational poverty.
4. The working poor: why employment is not enough to escape poverty
The central theme of the World Bank’s 2026 flagship report is an uncomfortable truth about global labor markets: having a job is not sufficient to escape poverty.
Conventional economic models assume that unemployment is the primary cause of household deprivation. However, empirical survey telemetry across low- and middle-income countries reveals that the extreme poor work long, grueling hours:
- A 6-percentage-point employment gap: Working-age adults in poor households are employed at rates only 6 percentage points below those of nonpoor households.
- Eroding labor conditions: Across 88 of 138 economies evaluated between 2003 and 2024, employment rates among poor adults actually deteriorated, driven by agricultural mechanization and urban informal sector saturation.
- The wage deficit: Poor workers are overwhelmingly locked into low-productivity subsistence farming, day labor, and informal street vending that generate insufficient cash income to lift a family above $3.00 per person per day.
The report evaluates two distinct labor market interventions to break this cycle:
- Closing household employment gaps: Raising the employment rate of working-age adults in poor households to a benchmark of 75 percent would reduce global extreme poverty by one-fifth (20%). However, this intervention primarily benefits near-poor households above the extreme line, where non-working adults are predominantly women excluded by caregiving burdens.
- Raising poor workers’ earnings: Boosting the hourly and daily earnings of poor workers to the level achieved by comparable nonpoor workers would cut extreme poverty by nearly half (close to 50%). This intervention delivers its greatest benefits directly to the poorest households at the bottom of the income pyramid.
Subtracting the 20% poverty reduction achieved through employment volume from the 50% reduction achieved through wage gains demonstrates that earning quality is 2.5 times more potent than raw job volume in eradicating extreme poverty (my calculation).
This reality reinforces the dynamics analyzed in our study of global remittance flows to developing economies. For millions of rural households, survival does not depend on local subsistence work, but on financial transfers sent home by family members working in commercial centers or foreign markets.
5. Climate exposure: 4.6 billion exposed as hazards expand
Poverty alleviation in the late 2020s is colliding directly with environmental disruption.
According to the World Bank’s climate hazard mapping:
- 4.6 billion people live in hazard zones: More than half of the global population resides in geographical areas exposed to major climate-related hazards, including extreme heatwaves, recurrent droughts, coastal storm surges, and riverine floods.
- The exposed population grew by 550 million: Between 2010 and 2024, the absolute number of people living in climate-exposed locations increased by approximately 550 million, driven by population growth and rapid urbanization in hazard-prone coastal and riverine basins.
- 1.5 billion people are highly vulnerable: Within this exposed population, 1.5 billion people live in a state of extreme vulnerability, lacking basic piped water, durable housing, medical clinics, or social protection programs to withstand a weather shock.
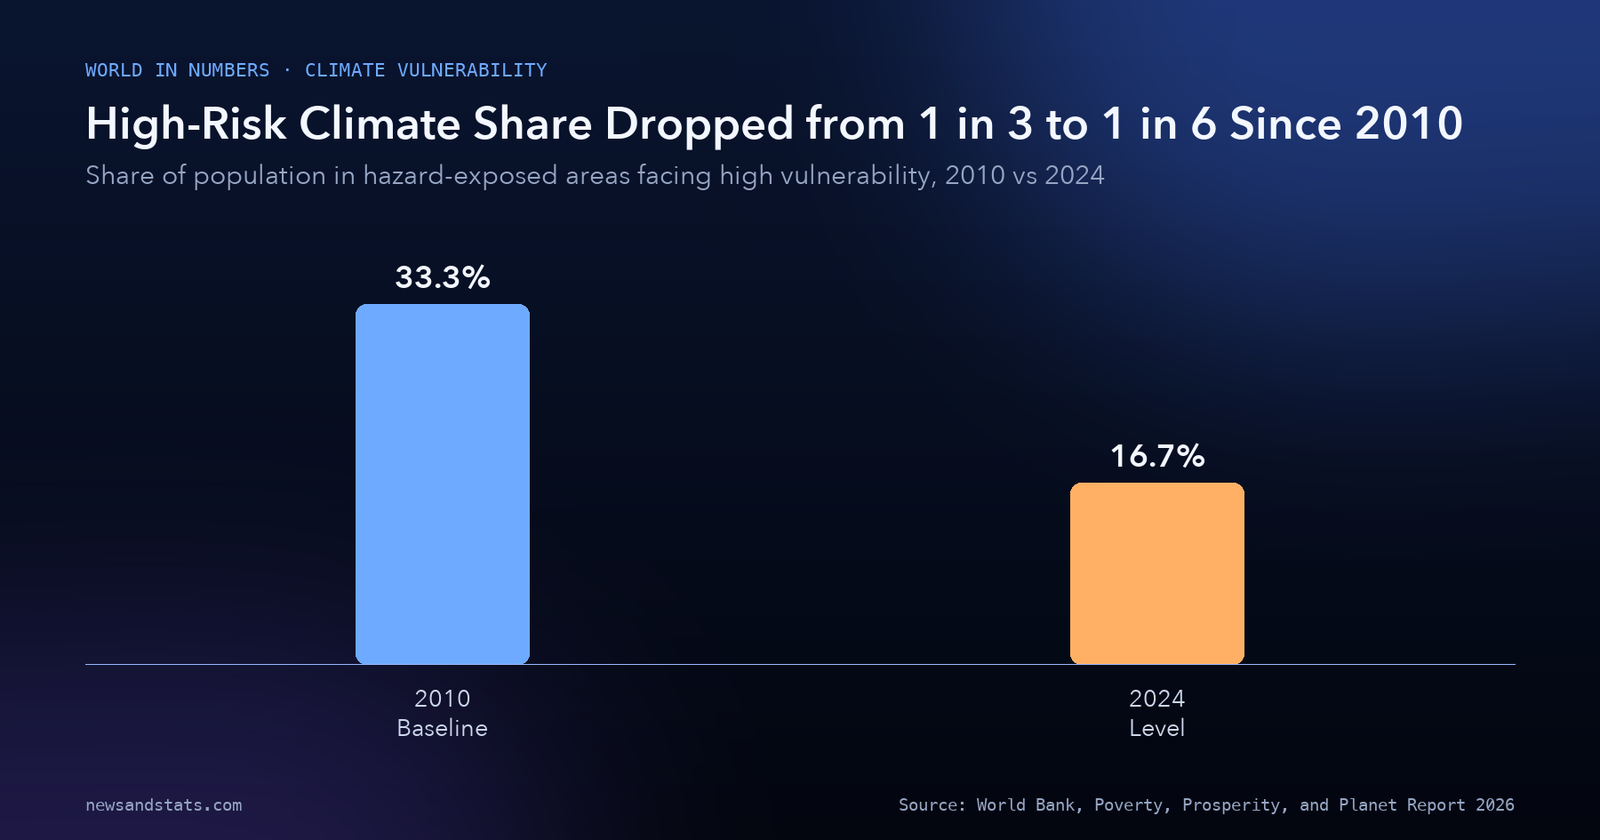
Source: World Bank, Poverty, Prosperity, and Planet Report 2026, Figure 1.14: Climate risk and population vulnerability.
Encouragingly, targeted investments in early warning systems, basic infrastructure, and rural electrification have reduced the proportion of exposed people living in high vulnerability:
- Down from 1 in 3 to 1 in 6: In 2010, one-third (33.3%) of people in exposed areas were classified as highly vulnerable. By 2024, that share was halved to one-sixth (16.7%).
- The net spread: Subtracting 16.7% from 33.3% represents a 16.6-percentage-point reduction in acute climate vulnerability over fourteen years (my calculation).
However, the report dispels the argument that poverty eradication conflicts with global climate targets. The economic growth required to lift all 811 million extreme poor above the $3.00-a-day line is estimated to add less than 5 percent to total global greenhouse gas emissions.
As demonstrated in our analysis of the global carbon budget and emissions trajectory, the world’s carbon budget is consumed almost entirely by energy-intensive middle- and high-income populations. The extreme poor contribute negligible emissions, yet they absorb the physical brunt of climate disruption.
6. The shared prosperity gap: a slowing convergence towards $25 a day
Beyond tracking minimum survival thresholds, the World Bank evaluates shared prosperity through the Global Prosperity Gap.
The Prosperity Gap measures the average shortfall between the world’s actual living standards and a benchmark of $25.00 per person per day, the standard of living associated with dignity, financial resilience, and middle-class security in high-income economies.
The trajectory of this gap mirrors the broader development slowdown:
- Halved from 1990 to 2013: Between 1990 and 2013, robust economic convergence reduced the Global Prosperity Gap by 50%.
- Stagnation since 2013: Since 2013, the rate of convergence has slowed to barely 1 percent per year, reflecting sluggish productivity gains in middle-income nations.
- Inequality concentration: One in five people globally (20%)—and more than a third of people in extreme poverty—live in economies with high inequality, defined by a national Gini index exceeding 40.
| Income line / poverty metric | Population threshold (2021 PPP) | Global population affected | Share of world population | Key structural dynamic |
|---|---|---|---|---|
| Extreme Poverty Line | $3.00 per person per day | 811 million people | ~10.0% (1 in 10) | Headcount rate unchanged since 2019; 87% in Africa/FCS by 2030 |
| Lower-Middle-Income Line | $4.20 per person per day | ~1.80 billion people | ~22.0% | Severe deficits in sanitation, electricity, and clean cooking fuel |
| Upper-Middle-Income Line | $8.30 per person per day | 3.70 billion people | 44.0% | Precarious vulnerability; families one shock away from destitution |
| Global Prosperity Standard | $25.00 per person per day | Deficit tracked via Prosperity Gap | High shortfall | Gap halved from 1990 to 2013, but narrowing barely 1% annually since |
| Climate Hazard Exposure | Major weather/climate hazard | 4.60 billion people | ~55.0% | Population exposed rose by 550 million between 2010 and 2024 |
| Acute Climate Vulnerability | Hazard exposed with zero safety net | 1.50 billion people | ~18.0% | High-risk share fell from 1 in 3 (2010) to 1 in 6 (2024) |
| High Inequality Economies | Gini index greater than 40 | ~1.62 billion people | 20.0% (1 in 5) | Concentrates more than one-third of the world’s extreme poor |
Source: World Bank, Poverty, Prosperity, and Planet Report 2026, Synthesis of core tables and annexes.
This convergence barrier reflects the structural bottlenecks examined in our study of the global digital divide leaving billions offline. When 2 billion people remain offline and lack modern digital payment infrastructure, low-productivity agricultural regions cannot integrate into global service supply chains, cementing the 1% annual crawl in shared prosperity.
What to watch
- Sub-Saharan African agricultural productivity initiatives: Monitor whether regional fertilizer subsidy reforms and drought-resistant seed deployments raise farm yields, improving earnings for the rural poor who represent the majority of the 811 million extreme poor.
- IDA21 donor replenishment commitments: Track whether international donor governments fulfill funding targets for the World Bank’s International Development Association (IDA), providing concessional grants to the 68 low-income countries facing acute fiscal constraints.
- Adaptive social protection expansion: Follow whether developing nations scale climate-indexed cash transfers, shielding the 1.5 billion highly vulnerable individuals before extreme weather events destroy local livelihoods.
- Female labor force participation reforms: Observe whether legal, childcare, and transport reforms unlock wage employment for nonworking women in poor households, tapping the potential to cut extreme poverty by 20%.
- Middle-income sovereign debt restructuring: Watch whether G20 debt treatment frameworks provide liquidity relief to upper-middle-income economies, preventing vulnerable families in the $3.00 to $8.30 band from sliding backward.
The bottom line
The 2026 World Bank Poverty, Prosperity, and Planet Report delivers an urgent reality check: global extreme poverty reduction has stalled at 811 million people, while 3.7 billion individuals remain trapped in economic insecurity on less than $8.30 a day. Because poor adults already work at rates comparable to the nonpoor, poverty cannot be eradicated merely by creating low-wage informal jobs; it requires transforming farm productivity, connecting rural enterprises to markets, and raising worker earnings. With 87% of extreme poverty projected to concentrate in Sub-Saharan Africa and conflict zones by 2030, reversing this historical stagnation requires coordinated global action on concessional finance, debt relief, and adaptive climate infrastructure. For continuous analysis of international development, demography, and macroeconomic inequality, explore our World in Numbers coverage.
Related reading
- 68 Low-Income Countries, Ranked by Debt Risk: 10 Are Already in Distress: sovereign debt sustainability, fiscal constraints, and concessional finance in developing economies.
- Global Remittance Flows in 8 Numbers: How $656 Billion Powers Developing Economies: cross-border worker remittances, transfer corridors, and household poverty alleviation.
- Global Food Prices Ease to 133.9 Points: Inside the FAO’s October 2026 Index: agricultural commodity prices, food inflation, and staple food affordability.
- Global Carbon Budget 2026: The Key Numbers: global CO2 emissions, fossil fuel trajectories, and the international climate transition.
- The Global Digital Divide in 8 Numbers: 2 Billion Still Offline: telecommunications access, rural broadband gaps, and mobile connectivity.