China mined 69% of the world’s rare earths in 2025 and refined close to half its copper, according to the two government and intergovernmental reports behind this article. That concentration matters right now because a one-year pause on China’s broadest rare-earth export controls, put in place after an October 2025 expansion, is due to run out around November 2026 — within days of this article’s publication. The rare earth supply chain behind magnets, batteries, chips and motors runs through a small number of mines and an even smaller number of refineries, and the numbers below, drawn from the US Geological Survey (USGS) and the International Energy Agency (IEA), show how concentrated it has become, what it has done to prices, and what is actually scheduled to happen next.
1. 390,000 tonnes: the rare-earth supply chain’s main source is one country
The world mined an estimated 390,000 tonnes of rare-earth oxide (REO, the standard unit for rare-earth output) in 2025, up from 380,000 tonnes in 2024, according to the USGS Mineral Commodity Summaries 2026. China alone produced 270,000 tonnes of that total — a 69% share, by my calculation from the two USGS figures. The United States was a distant second at 51,000 tonnes (13% of world output), followed by Australia at 29,000 tonnes, Burma at 22,000 tonnes and Thailand at 4,800 tonnes. Every other producing country combined made up the remaining roughly 13,000 tonnes.
| Country | 2025 mine production (tonnes REO) | Reserves (tonnes REO) |
|---|---|---|
| China | 270,000 | 44,000,000 |
| United States | 51,000 | 1,900,000 |
| Australia | 29,000 | 6,300,000 |
| Burma | 22,000 | Not available |
| Thailand | 4,800 | Not available |
| World total | 390,000 | More than 75,000,000 |
Source: USGS Mineral Commodity Summaries 2026, Rare Earths chapter, production and reserves tables.
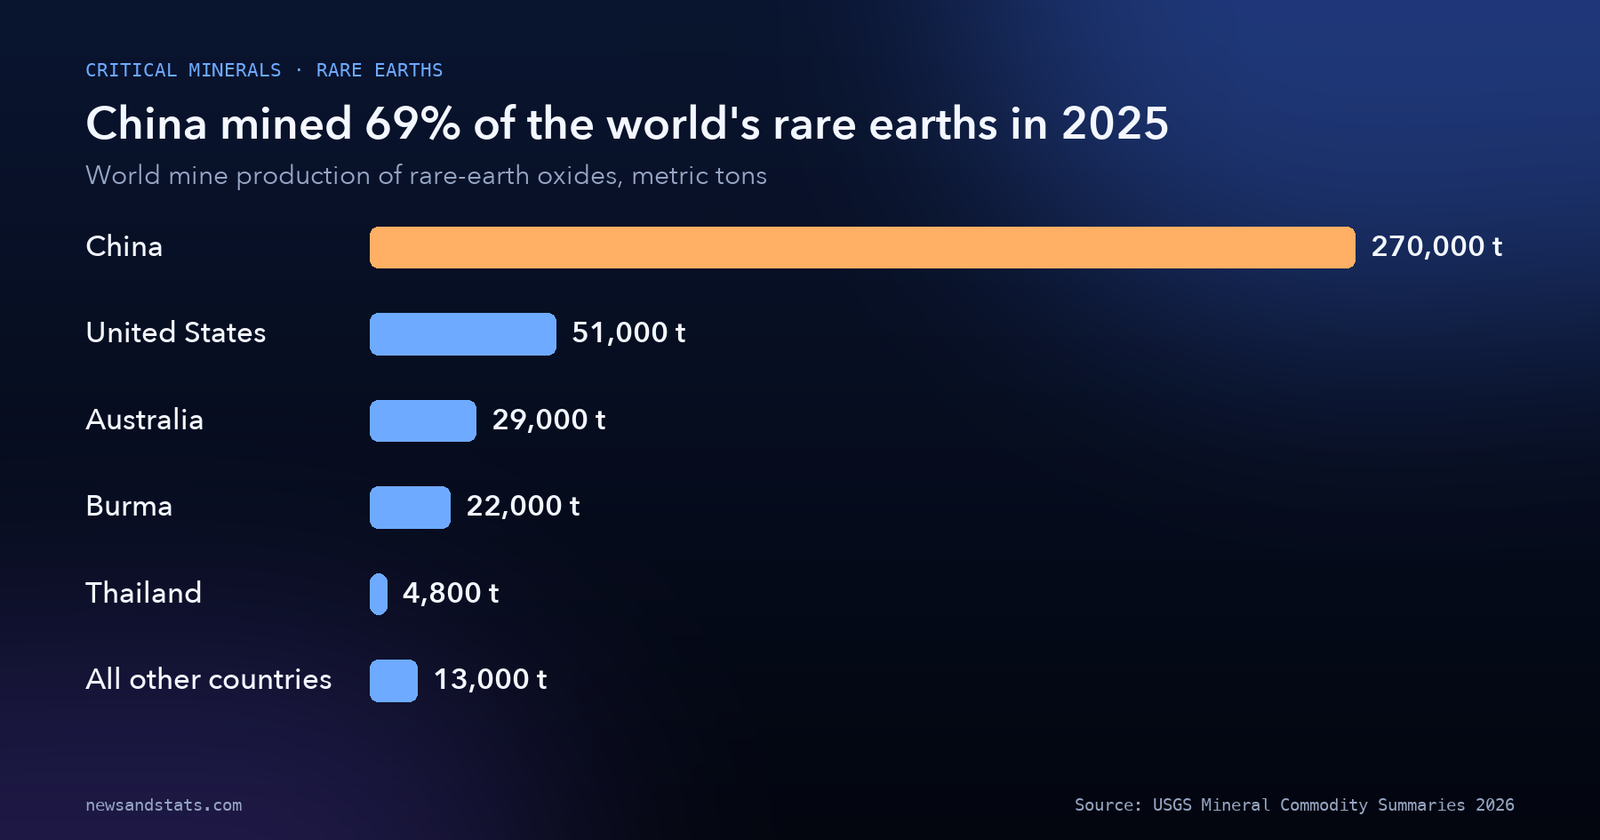
Source: USGS Mineral Commodity Summaries 2026, Rare Earths chapter.
Rare earths are a group of 17 elements used mainly, in their global end use, for permanent magnets — the kind that go into electric motors, wind turbines and, elsewhere in manufacturing, the global robot installation surge we have covered separately. The USGS lists magnets as the leading global end use of rare earths, while in the United States specifically the leading use is catalysts.
2. 44,000,000 tonnes: China’s reserve lead is bigger than its production lead
China’s dominance is not just about current mining. The USGS puts China’s rare-earth reserves — the resources that are both known and economically extractable at today’s prices — at 44,000,000 tonnes, against a world total of more than 75,000,000 tonnes. The next-largest reserve holder among countries reporting a figure is Vietnam, at 3,500,000 tonnes, followed by Russia at 3,800,000 tonnes and Brazil at 11,000,000 tonnes. The United States, despite its position as the world’s second-largest current producer, holds only 1,900,000 tonnes of reserves — far less than Australia’s 6,300,000 tonnes. That gap suggests China’s lead in mine output is not a short-term fluke of investment timing; it is backed by a much larger resource base than any other single country has reported.
3. 67%: America’s reliance on imported rare earths swung hard in two years
The United States still mines rare-earth concentrates, at Mountain Pass, California, among other sites, but it relies on imports once that material needs to be turned into usable compounds and metals. The USGS’s net import reliance figure — imports minus exports, as a share of apparent consumption — for rare-earth compounds and metals was more than 90% in 2023, then dropped sharply to 53% in 2024, before climbing back to 67% in 2025. In the same period, US imports of rare-earth compounds and metals rose 169% in 2025, even though the dollar value of those imports fell slightly, to $165 million from $168 million in 2024 — a sign that the US was importing more material at a lower average price per unit.
Those imports are not spread evenly. For 2021 through 2024, the USGS attributes 71% of US imports of rare-earth compounds and metals to China, including Hong Kong, with Malaysia at 13%, Japan at 5% and Estonia at 5%. The real China exposure runs higher than that headline number: the USGS notes that material imported from Estonia, Japan and Malaysia was itself derived from mineral concentrates and chemical intermediates produced in Australia, China and elsewhere.
4. The on-and-off export-control timeline, explained
China’s export controls on rare earths did not arrive all at once. According to the USGS, in April 2025 China added controls on alloys, compounds, metals and oxides of seven elements: samarium, gadolinium, terbium, dysprosium, lutetium, scandium and yttrium. In October 2025, it expanded those controls to cover five more elements — europium, holmium, erbium, thulium and ytterbium. Then, in November 2025, China suspended the October controls for one year, while the original April controls stayed in effect; the USGS also notes that China began issuing general export licenses to selected exporters during this period. The IEA’s Global Critical Minerals Outlook 2026 describes the same sequence and says the suspension of the broader controls runs until November 2026 — which, as of this article’s publication, is close at hand. This is a similar on-again, off-again pattern to what we found in another part of the chip and components supply chain, where shortages and restrictions have also arrived in waves rather than a single event.
What happens after the suspension period is not yet decided, and this article does not predict it. The April 2025 controls on the seven heavy elements remain in force regardless of what happens to the October additions.
5. $6.5 trillion: what the IEA says is riding on the outcome
The stakes of that decision are large by the IEA’s own estimate. Full implementation of the expanded rare-earth export controls, the IEA says, could put an estimated $6.5 trillion per year of downstream production outside China at risk — a figure that reflects how deeply rare-earth magnets and components are embedded in global manufacturing, not a prediction that this amount of output will actually be lost. The IEA separately flagged a smaller but still substantial risk tied to the same October 2025 controls: battery supply-chain materials, including cathode materials, precursors, graphite anode materials and battery manufacturing equipment, were also covered, and a full disruption of battery-grade graphite trade specifically could put more than $300 billion per year of downstream production outside China at risk. The scale of both numbers is one reason governments and companies have been paying close attention to a technical trade decision that, on its face, concerns a short list of chemical elements. It is also one reason central banks’ own stockpiling instinct, in a different metal entirely, has drawn comparisons in recent coverage — both reflect a broader unease about depending on concentrated supply.
6. It’s not just rare earths: China’s copper squeeze looks similar
Rare earths are not the only critical mineral where supply has concentrated around one country. The IEA reports that China’s share of global copper smelting capacity rose from about 15% around 2005 to 50% by 2025, and that China has accounted for more than 90% of all growth in global copper smelting capacity since 2005. The USGS’s separate, output-based figures point the same way: in 2025, China refined an estimated 14,000 thousand tonnes of the world’s 29,000 thousand tonnes of refined copper, a 48% share by my calculation — close to, though not identical to, the IEA’s capacity-based 50% figure, since the two measures count different things (installed capacity versus actual output).
| Country | 2025 mine production (thousand tonnes) | 2025 refinery production (thousand tonnes) |
|---|---|---|
| China | 1,800 | 14,000 |
| Chile | 5,300 | 1,700 |
| United States | 1,000 | 850 |
| World total | 23,000 | 29,000 |
Source: USGS Mineral Commodity Summaries 2026, Copper chapter, world mine and refinery production table.
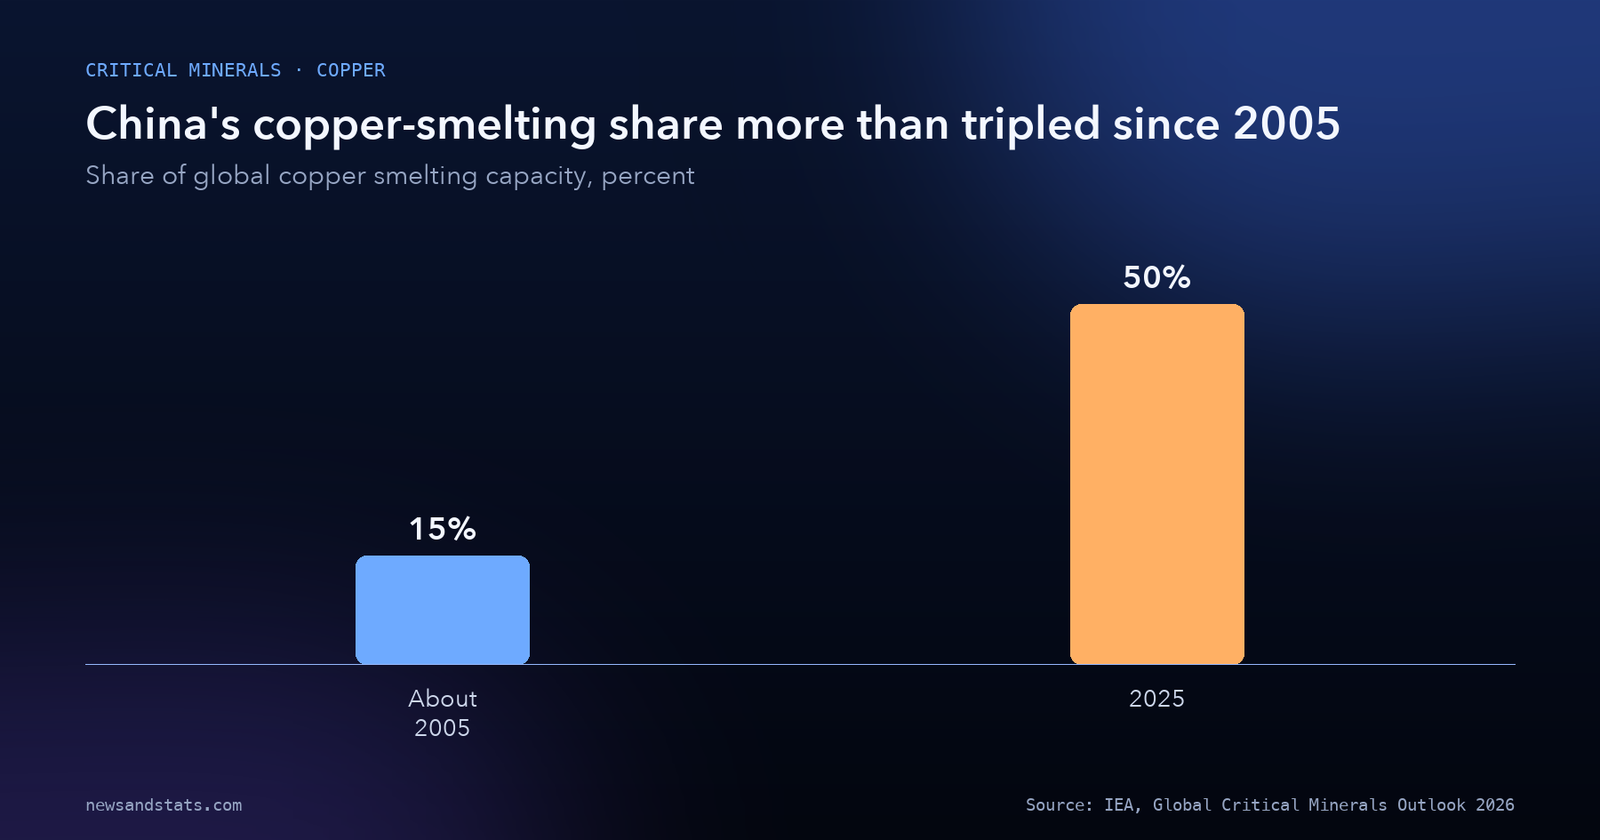
Source: IEA, Global Critical Minerals Outlook 2026, executive summary.
Interestingly, China is not the world’s leading copper miner — Chile is, at 5,300 thousand tonnes in 2025 against China’s 1,800 thousand tonnes, respectively 23% and 8% of world mine output by my calculation. China’s edge is in processing ore into usable metal, not in digging it out of the ground. The IEA says smelter utilization outside China was below 70% in 2025, versus around 85% inside China, and that the benchmark copper smelter treatment charge for 2026 — the fee miners pay smelters to process their ore — was agreed at $0 per tonne, the lowest ever agreed, a sign of how little bargaining power ore suppliers have against a processing base this concentrated. Much of that refined copper, alongside the magnet rare earths discussed above, ultimately competes for the same end markets: electrical wiring, motors, and the data centers behind AI data centers’ doubling power needs and the hyperscalers behind the AI infrastructure build-out we’ve covered elsewhere.
7. What tightening supply has done to prices
Prices have moved with the supply picture. The IEA reports that aluminium, copper and tin prices rose by about one-third (33%) between January 2025 and April 2026, with copper reaching record highs over that stretch. Cobalt rose around 130% over the same period, which the IEA attributes largely to export restrictions from the Democratic Republic of the Congo. Strategic minor minerals — a category of metals used in smaller volumes but still critical to specific technologies — more than doubled in price on average, and tungsten specifically rose sixfold (up 500%).
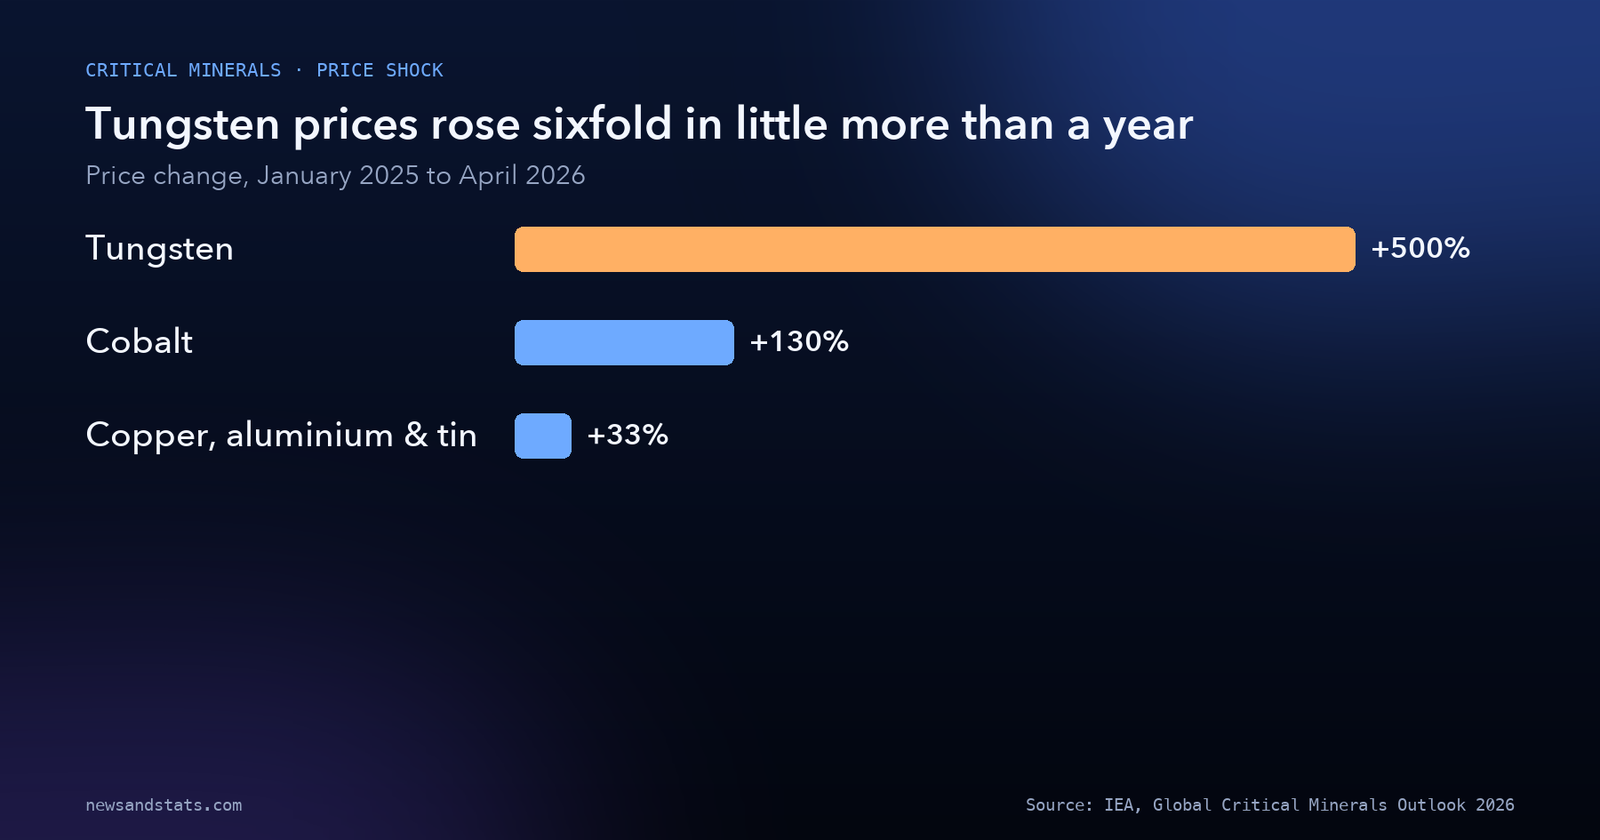
Source: IEA, Global Critical Minerals Outlook 2026, executive summary.
Copper’s US price move was large enough that the USGS tracked it directly: the COMEX cathode price was projected to average $4.80 per pound in 2025, up 14% from $4.22 per pound in 2024, a record high. USGS analysts attributed the increase primarily to uncertainty over the implementation of tariffs on US copper imports — a policy-driven cause, not simply a supply-and-demand one, and the USGS is explicit that this is its own attribution rather than an unattributed claim.
8. Investment pulled back exactly when more of it is needed
If prices were rising because supply was tight, more investment might be expected to follow. Instead, the IEA found that overall critical-mineral investment fell 9% in 2025. Battery-metal capital spending fell more than 20% — the largest decline in more than a decade — with lithium companies specifically cutting investment by around 40%. Copper was the exception: copper-focused investment spending rose 8% in 2025, even as exploration spending for critical minerals overall fell more than 10%, with lithium and nickel exploration down around 45% and Asia-Pacific exploration up 20%. Diversifying rare-earth magnet supply chains away from China would require about $60 billion of investment over the next decade, the IEA estimates — a sum that dwarfs the sums currently being committed, and one reason the IEA’s report frames diversification as a multi-year project rather than something that follows automatically from higher prices. This mirrors, in a different mineral category entirely, clean energy innovation’s own funding squeeze that we found when we looked at battery and solar patent activity.
9. Washington’s own list of “critical” keeps growing
Governments have been formally expanding their definitions of what counts as a critical mineral. On 7 November 2025, the United States published its Final 2025 List of Critical Minerals in the Federal Register (90 FR 50494), adding copper, lead, potash, rhenium, silicon and silver to the list that had stood since 2022, based on an updated USGS methodology. Following public comment on the draft list, the government also added boron, metallurgical coal, phosphate rock and uranium. The inclusion of copper on a list that previously excluded it is itself notable, given the concentration numbers above — until that list was published, US policy attention to copper’s own supply chain was formally outside the “critical minerals” framework that triggers specific federal support measures.
What to watch
- Whether China lets the suspended October 2025 rare-earth export controls lapse around November 2026, extends the pause again, or replaces it with a different arrangement.
- The 2027 edition of the USGS Mineral Commodity Summaries, to see whether the US net import reliance figure keeps climbing past 67% or reverses again.
- Whether the IEA’s estimated $60 billion in magnet-supply diversification investment over the next decade starts to show up in actual project financing.
- Whether the $0-per-tonne benchmark copper treatment charge for 2026 changes in next year’s smelter-industry negotiations, as a signal of whether processing capacity outside China is catching up.
- Further additions to the US critical-minerals list beyond the 7 November 2025 update, particularly for minerals tied to magnets and batteries.
- Whether copper-focused investment, which rose 8% in 2025 while most other critical-mineral investment fell, continues to diverge from the rest of the sector.
The bottom line
China’s edge in rare earths and copper is not identical in each metal — it mines most of the world’s rare earths outright, while in copper it leads mainly in refining rather than mining — but in both cases the concentration has reached the point where a single country’s regulatory decisions can move global prices and expose trillions of dollars of downstream production to risk. The numbers show investment has not kept pace with prices, and that diversifying supply chains away from that concentration remains a decade-scale, tens-of-billions-of-dollars project rather than a quick fix. What the numbers do not show is what China will actually do when its current rare-earth suspension runs out around November 2026; that remains an open question this article cannot answer in advance.
Related reading
- Why memory chips got so expensive: the DRAM shortage in numbers: another critical input to modern electronics that became suddenly scarce and expensive.
- The AI infrastructure bet: who spends it, and who pays: one of the demand sources competing for the copper and rare-earth magnets described above.
- Five Million Robots in Factories: The Global Automation Surge: one of many industries built on the magnet-grade rare earths covered here.
- Clean Energy Innovation: The Patent Race and Battery Dominance: a related funding squeeze in the technologies that consume these same minerals.