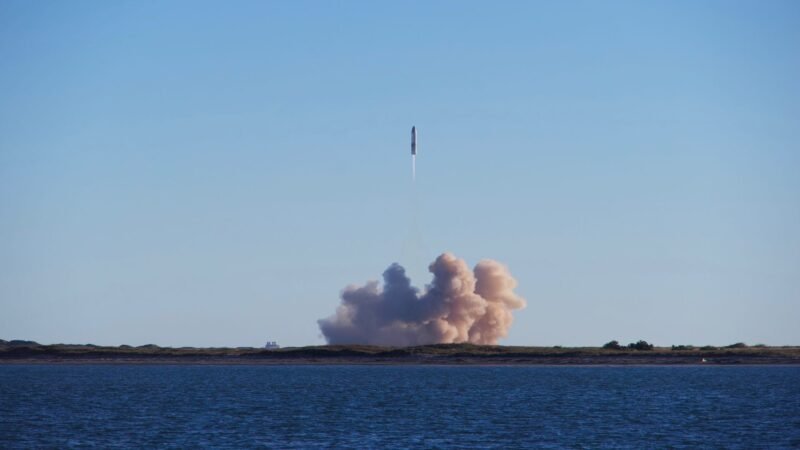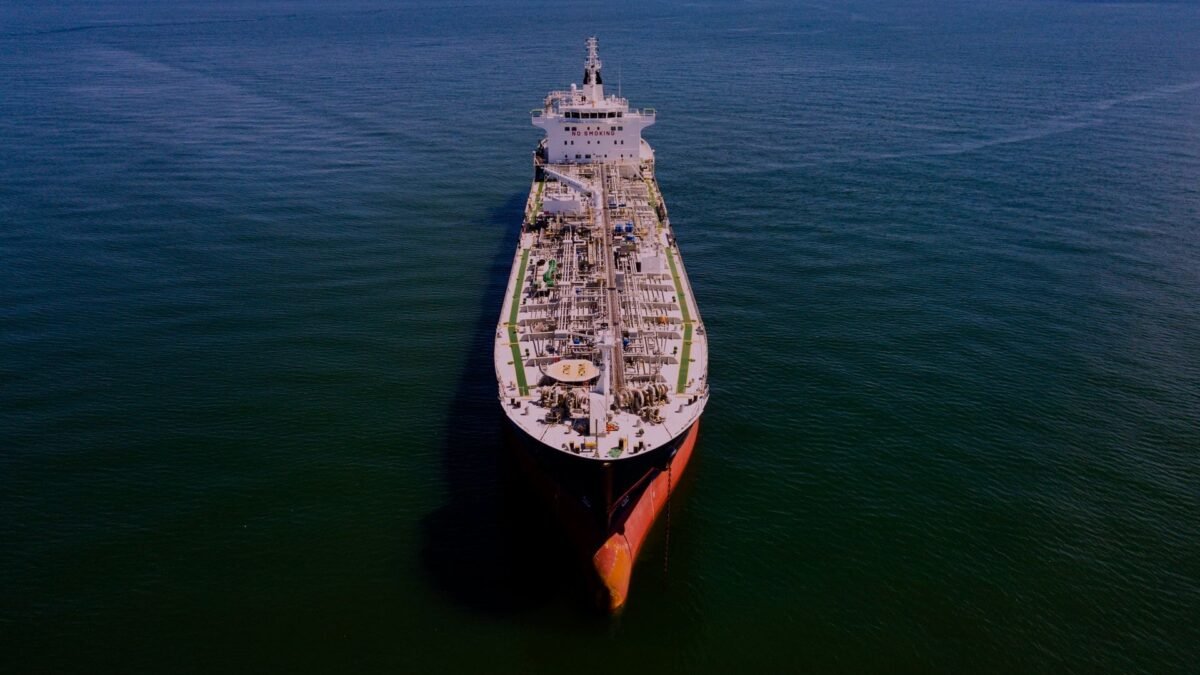
By the end of October 2026, disruptions to shipping through the Strait of Hormuz had removed 2.8 billion barrels of oil and 60 billion cubic meters (bcm) of natural gas from Gulf supply, making the 2026 crisis the largest energy supply shock in modern history. On 19 November 2026, the International Energy Agency released its World Energy Outlook 2026, modeling how that shock alters fuel trade, power grids, and technology choices through 2035 and 2050. Earlier this year, we tracked country-by-country import cost bills from the first months of the crisis. The IEA’s flagship report steps back from short-term price spikes to test five structural pathways, asking whether governments double down on bypass pipelines, domestic renewables, nuclear reactors, and electrification, or lock in new supply-chain bottlenecks.
1. The 2.8-billion-barrel shock and Asia’s chokepoint exposure
The scale of the 2026 disruption surpasses every oil supply crisis since 1956, including the 1979 Iranian Revolution and the 1990–1991 Gulf War, according to the IEA’s Overview and Key Findings. Well-stocked inventories, the largest coordinated emergency stock release in IEA history, higher Atlantic basin exports, and reduced Chinese crude imports cushioned the early months of the crisis. As those buffers ran down, consumers and industrial buyers absorbed the shock directly through prices: diesel, the primary fuel for freight, agriculture, and heavy machinery, hit record levels above $200 per barrel, while Red Sea transit risks and fifth-year disruptions to Russian supply compounded market tightness. As we noted in our coverage of the IEA’s November 2026 oil market report, physical product tightness has fallen hardest on importing economies.
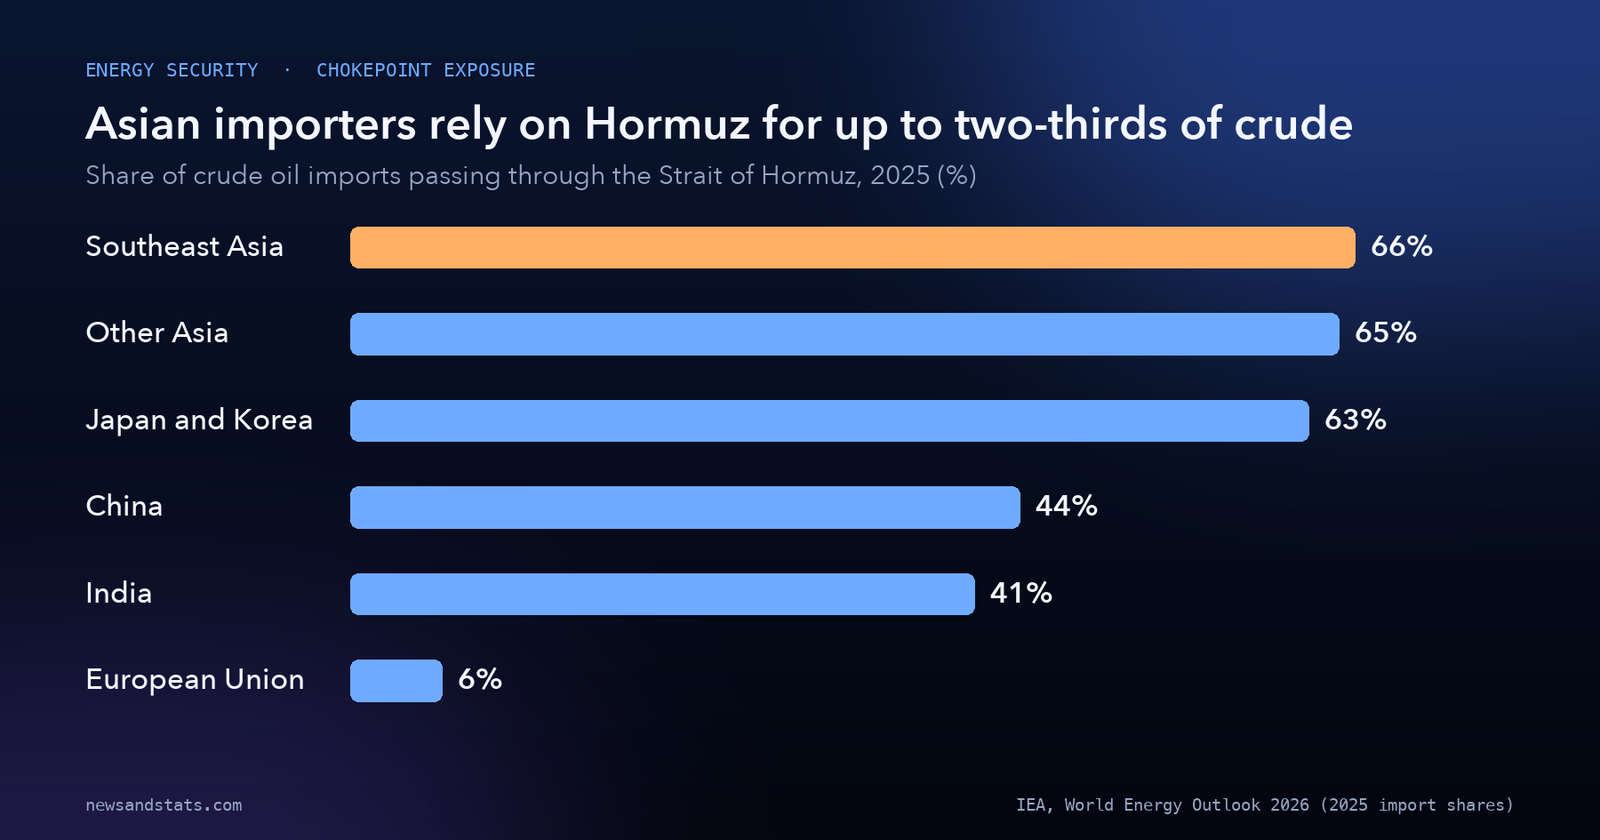
Geographic exposure to the Strait of Hormuz explains why the price shock hit Asia hardest. Three-quarters of the world’s population lives in oil- and gas-importing countries, and more than 4 billion people live in countries that depend on the Strait of Hormuz for over 30% of their oil supplies. Before the crisis, around 80% of the oil and almost 90% of the liquefied natural gas (LNG) transiting Hormuz went to Asian buyers. In Implications for Energy Security and Affordability, the IEA breaks down 2025 crude oil and LNG import dependence across six major importing regions.
Source: IEA, World Energy Outlook 2026 — Implications for energy security and affordability.
Southeast Asia relied on Hormuz for 66% of its crude oil imports and 21% of its LNG imports in 2025, while Other Asia depended on the waterway for 65% of crude and 60% of LNG. Japan and Korea sourced 63% of crude imports through Hormuz alongside 11% of LNG. China drew 44% of crude and 31% of LNG through the Strait, while India sourced 41% of its crude and 60% of its LNG via Hormuz. By contrast, the European Union relied on Hormuz for 6% of crude oil and 8% of LNG in 2025.
| Importing region | Crude oil via Hormuz (2025) | LNG via Hormuz (2025) |
|---|---|---|
| Southeast Asia | 66% | 21% |
| Other Asia | 65% | 60% |
| Japan and Korea | 63% | 11% |
| China | 44% | 31% |
| India | 41% | 60% |
| European Union | 6% | 8% |
Source: IEA, World Energy Outlook 2026 — Implications for energy security and affordability.
The immediate casualty of higher fuel prices and supply shortages is energy access in developing economies. Around 720 million people worldwide still live without electricity, and nearly 2 billion rely on polluting cooking fuels. Progress on both fronts accelerated in 2025, but the IEA warns in its official press release that 2026 price spikes and shortages threaten to reverse those recent gains.
2. Bypass pipelines and the Hormuz exit in World Energy Outlook 2026
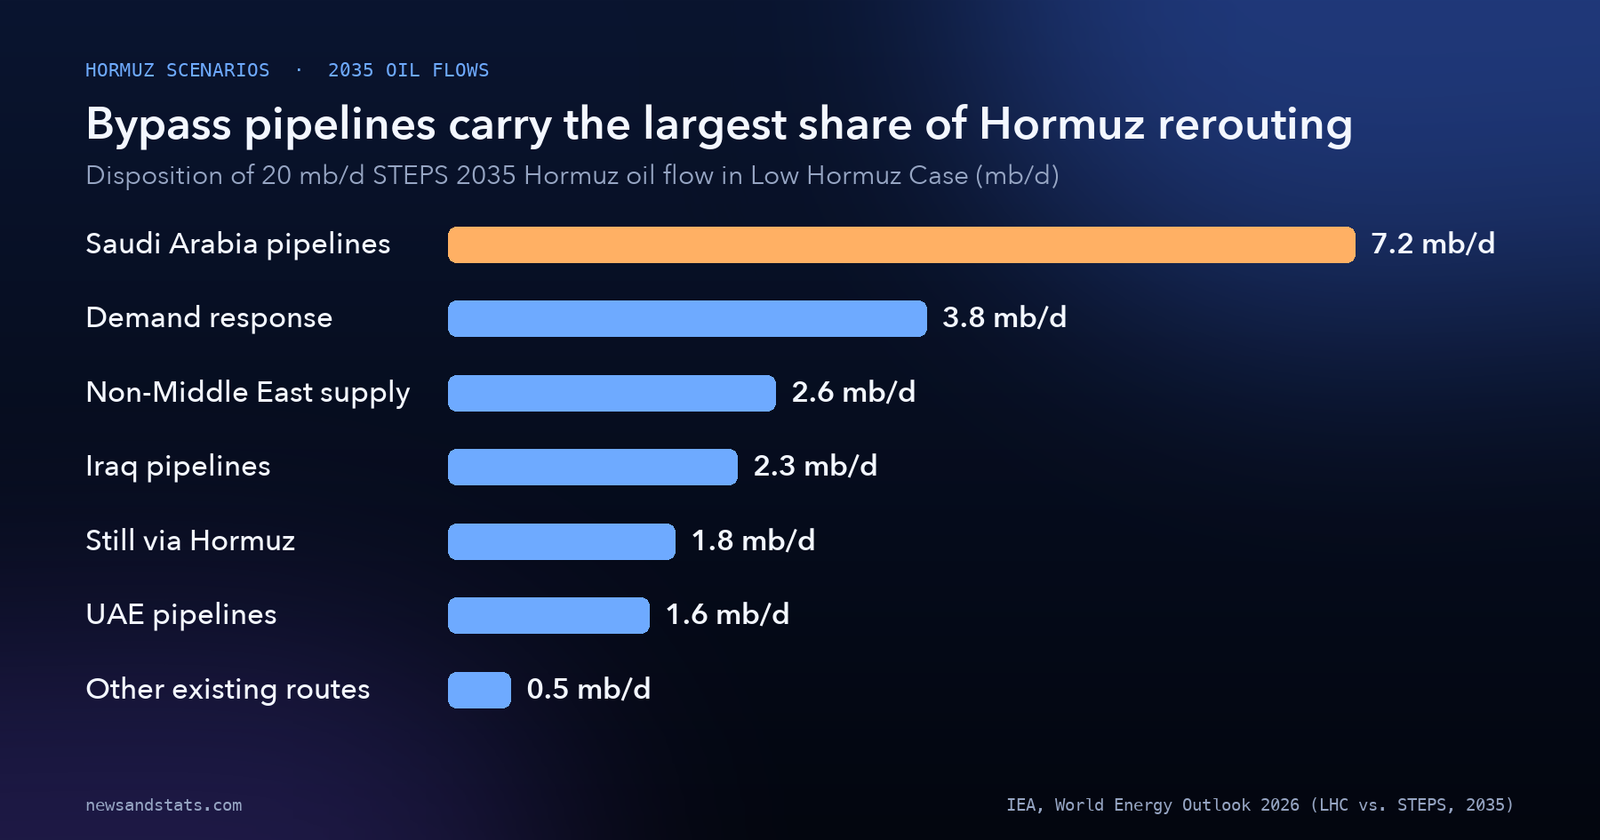
A central contribution of World Energy Outlook 2026 is testing how far exporters and importers can route around the Strait of Hormuz if maritime risks persist. In the Stated Policies Scenario (STEPS), which assumes Gulf transit stabilizes by the end of 2027, 20 million barrels per day (mb/d) of oil still crosses the Strait of Hormuz in 2035, matching the pre-crisis baseline of 20 mb/d. To model a prolonged disruption, the IEA introduces the Low Hormuz Case (LHC), in which transit through the Strait falls to 8.5 mb/d in 2030 and 1.8 mb/d (under 2 mb/d) by 2035.
In Potential Additional Responses, the IEA details every barrel of that 2035 rerouting relative to the 20 mb/d STEPS baseline. Bypass pipelines carry the heaviest load: Saudi Arabia accounts for 7.2 mb/d via the 4.2 mb/d East-West pipeline and a 3.0 mb/d Petroline expansion, Iraq accounts for 2.3 mb/d (0.3 mb/d active plus 2.0 mb/d from a proposed Kirkuk-Ceyhan route), and the United Arab Emirates accounts for 1.6 mb/d (0.8 mb/d Habshan-Fujairah active plus 0.8 mb/d under construction), alongside 0.5 mb/d on other existing routes. Combined, Saudi, Iraqi, and Emirati bypass pipelines represent 11.1 mb/d, or 61.0% of the 18.2 mb/d reduction in Hormuz oil transit (my calculation). Non-Middle East producers add 2.6 mb/d of alternative supplies—notably from the United States, Canada, Brazil, Guyana, Argentina, and Venezuela—and demand-side measures remove 3.8 mb/d. Together, the seven components listed in the IEA breakdown sum to 19.8 mb/d against the 20 mb/d STEPS baseline due to rounding (my calculation).
Source: IEA, World Energy Outlook 2026 — Potential additional responses.
Routing around Hormuz carries a clear capital price tag and structural limits. Around 7 mb/d of new bypass pipeline projects are under construction or under consideration, requiring an estimated $40 billion in capital and adding roughly $2 per barrel to Middle East export costs. Even in the Low Hormuz Case, the Middle East remains the world’s largest net oil exporter, meaning regional instability still reaches global markets even if tankers avoid the Strait. LNG faces a harder physical constraint: Gulf LNG exports have no feasible pipeline bypass routes, so importers rely instead on a global LNG supply wave led by the United States. Meanwhile, Asian energy chokepoints shift rather than vanish: flows through the Strait of Malacca rise to 23–25 mb/d of oil and 200–250 bcm of LNG by 2035 in both the Current Policies Scenario (CPS) and STEPS.
3. The Age of Electricity and the cooling milestone
While fossil fuel trade routes dominate headlines, the IEA highlights a deeper structural shift into what it calls the Age of Electricity. Electricity accounts for around 23% of final energy consumption today, yet it already powers sectors generating over 45% (46% in 2025) of global GDP, according to The Outlook for Energy Transitions. Since 2019, global electricity demand has grown 3.3% per year—outpacing global GDP growth of 2.9% per year and running more than twice as fast as total energy demand growth of 1.5% per year.
Volatile imported fuel prices have turned electrification into an energy-security policy. Twenty-five countries announced new electrification-related policies between February and November 2026, and the IEA projects electricity’s share in final energy consumption to approach 30% globally by 2035 across exploratory scenarios, and exceed 35% in the Net Zero Emissions by 2050 (NZE) Scenario. Early movers are already seeing measurable oil savings: China’s electric vehicle fleet avoids around 1.5 mb/d of oil consumption today. Under the Additional Response Case (ARC)—which models faster electrification and efficiency measures under government consideration—electric vehicles displace more than 11 mb/d of oil demand by 2035, pushing total oil demand 4.4 mb/d below STEPS in 2035 (compared with a STEPS plateau around 103 mb/d in 2030). Supporting that transition requires sustained global energy capital flows, with clean energy investment in NZE tripling to around $4.5 trillion per year over the decade to 2035.
Two specific demand drivers stand out in the 2026 data: space cooling and artificial intelligence. For the first time in energy history, global energy needs to cool buildings are overtaking energy needs to heat them, driven by rising incomes and warming temperatures after August 2026 became the hottest month globally on record. In emerging market and developing economies outside China, 85% of households are exposed to high temperatures, yet less than 20% currently own an air conditioner. At the same time, AI-driven data center electricity demand doubles to reach 1,000 terawatt-hours (TWh) by 2030 in STEPS. Even so, residential appliance efficiency gains over the past decade—totaling 600 TWh across lighting, televisions, refrigeration, and white goods—exceed annual global data center electricity use, and aligning global minimum efficiency standards would unlock another 800 TWh of savings by 2035.
4. Solar PV, nuclear power, and coal’s uneven decline
Importing economies seeking homegrown electricity are leaning first on solar photovoltaics (PV) and batteries, followed by a nuclear revival. In 2025, solar PV generation increased by 600 TWh—the third-largest single-year increase ever recorded by any energy source—and for the first time on record, solar PV supplied a larger share of total global energy demand growth than any other fuel. Global manufacturing capacity for solar PV modules and batteries stands at roughly twice 2025 deployment volumes, keeping equipment prices low as crisis-hit importers in Asia and Africa step up module and storage purchases. Across CPS and STEPS, renewables rise from 33% of global electricity generation today to 45–50% by 2035.
Nuclear power is experiencing its strongest buildout in decades. As of mid-2026, nearly 90 gigawatts (GW) of new nuclear capacity was under construction—the highest level in more than 35 years—and over 50 countries hold nuclear power plans or targets, including small modular reactors. The IEA revised nuclear generation upward compared with its 2025 outlook, led by China and the United States, pointing to an expansion from nuclear’s current 9% share of global electricity. Scaling variable renewables and firm nuclear capacity also multiplies grid balancing requirements: short-term electricity system flexibility needs grow by 2.2 times by 2035 in CPS, 2.4 times in STEPS, and 3.6 times in NZE relative to 2025, reinforcing the urgency of clearing grid connection queues.
Coal sits at the center of an energy-security tension. In STEPS, global coal-fired power generation falls around 15% by 2035 and industrial coal use declines 5%, with China—which accounts for more than half of global coal demand—shifting its coal fleet from baseload power toward peak demand and grid flexibility. In the Additional Response Case, however, fuel-importing regions turn to 105 million tonnes of coal equivalent (Mtce) more coal alongside 509 TWh more solar PV, 507 TWh more wind, and 177 TWh more nuclear in 2035 than in STEPS to displace 331 bcm of imported natural gas and 4 mb/d of oil. Gas-fired power generation in 2035 under the ARC remains constrained across importers, reaching 490 TWh in Japan and Korea, 483 TWh in China, 346 TWh in the European Union, and 78 TWh in India.
5. Critical minerals, grid resilience, and the $6.5 trillion rare earth risk
Replacing imported oil and gas with solar panels, batteries, electric motors, and high-voltage grids shifts geopolitical vulnerability from maritime oil chokepoints to mineral processing plants. China is the dominant refiner for 19 out of 20 energy-related strategic minerals, and more than half of those minerals are subject to export controls. Across key clean-energy inputs, the top supplying country holds 85% of refined magnet rare earth supply and around 75% of refined lithium and cobalt supply. Meanwhile, copper faces a projected 25% supply deficit by 2035 in STEPS relative to existing and planned mine supply.
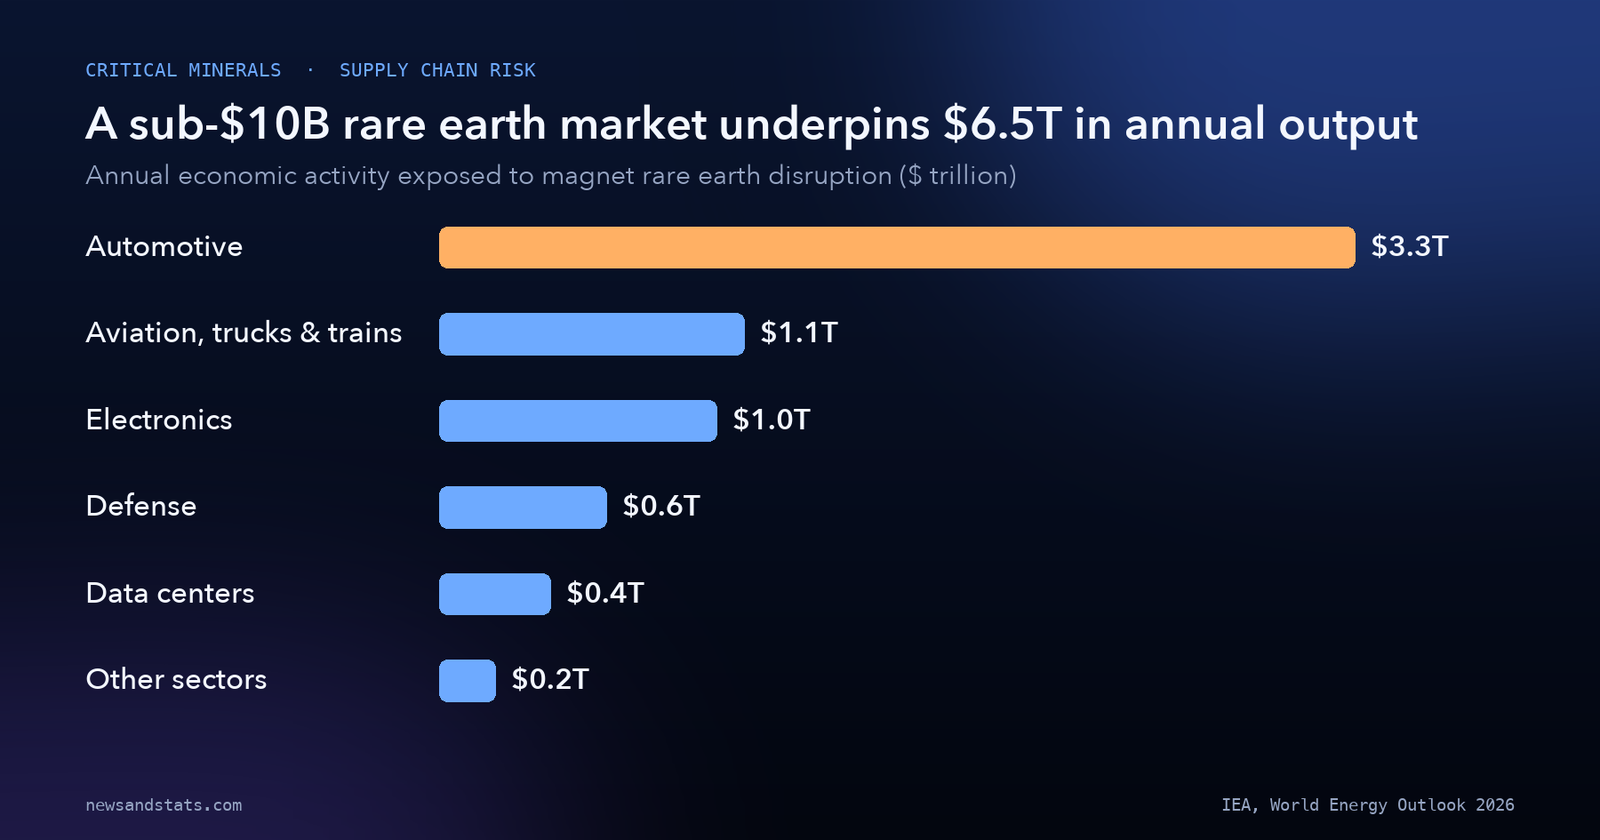
As we detailed in our analysis of the rare earth supply chain, small upstream mineral markets carry disproportionate downstream leverage. The IEA estimates the annual market for magnet rare earths at less than $10 billion, yet a supply disruption threatens $6.5 trillion in annual economic activity—a leverage ratio of at least 650 times the underlying mineral market (my calculation).
Source: IEA, World Energy Outlook 2026 — Implications for energy security and affordability.
Automotive manufacturing carries the single largest exposure at $3.3 trillion per year, followed by aviation, trucks, and trains at $1.1 trillion, and electronics at $1.0 trillion. Defense ($0.6 trillion), data centers ($0.4 trillion), and other sectors ($0.2 trillion) account for the remaining exposure; due to rounding to one decimal place, the six sector bars sum to $6.6 trillion against the IEA’s $6.5 trillion headline figure (my calculation). Physical grid resilience adds another layer of risk: an average of 190 million electricity customers experience power outages linked to natural hazards every year, a burden set to grow as global temperatures rise.
6. Five scenarios, regional divergence, and the climate gap
Regional starting points shape how governments weigh security, affordability, and decarbonization across the IEA’s Regional Insights covering countries representing about 90% of global population, GDP, and energy demand. Car ownership in advanced economies stands 6 to 9 times higher than in Southeast Asia and 15 to 20 times higher than in Africa or India, concentrating future mobility growth in emerging markets as the global population adds 650 million people and the world economy grows by one-third through 2035. In the European Union, domestic renewables and nuclear already supply 80% of electricity demand, and the European Commission has proposed a 46% end-use electrification rate by 2040 to curb fossil-fuel imports. Across all Industries, faster clean-energy transitions lower long-term fuel import bills: in NZE, global fuel import expenditures fall from around 2.3% of global GDP today to 0.6% by 2035, and average household energy bills drop by almost 10% in fuel-importing regions.
Even with crisis-driven electrification, current and stated policies fall well short of Paris Agreement temperature goals. Global economy-wide greenhouse gas emissions reached a record 54.1 gigatonnes (Gt) of carbon dioxide equivalent in 2025, with global average temperatures reaching around 1.4 °C above pre-industrial levels. Only around 30% of new Nationally Determined Contributions submitted since December 2023 reference the goal to triple global renewable capacity by 2030. Under CPS, global warming reaches 2.9 °C by 2100; under STEPS it reaches 2.5 °C; and under ARC it reaches 2.4 °C. Only the normative NZE pathway—which cuts energy-related CO2 emissions by more than half to under 19 Gt by 2035 and lifts low-emissions power from 42% today to almost 90%—peaks warming just below 1.7 °C (overshooting 1.6 °C for nearly 40 years) before returning below 1.5 °C by 2100.
What to watch
- Strait of Hormuz transit volumes through late 2027: Both CPS and STEPS assume unimpeded Hormuz transit resumes by the end of 2027; prolonged shipping restrictions push global investment toward the Low Hormuz Case’s $40 billion bypass pipeline buildout.
- Petroline and Kirkuk-Ceyhan pipeline FIDs: Watch whether Saudi Arabia’s 3.0 mb/d Petroline expansion and Iraq’s proposed 2.0 mb/d Kirkuk-Ceyhan link move from planning to construction, locking in the $2/barrel routing premium.
- Data center grid connections toward 1,000 TWh: Track whether grid upgrades and battery storage keep pace as AI data center electricity demand doubles by 2030 and short-term flexibility needs more than double by 2035.
- Copper mine project approvals: With STEPS showing a 25% copper deficit by 2035, new smelting and mining investments will determine whether grid expansion and EV adoption face rising hardware costs.
- Second Global Stocktake submissions: Late-2026 climate stocktake negotiations will test whether countries convert crisis-driven electrification into formal policies closing the gap between 2.4–2.9 °C trajectories and 1.5 °C.
The bottom line
World Energy Outlook 2026 shows that the 2.8-billion-barrel Hormuz shock has permanently altered how importing nations price energy risk, even if Gulf tankers eventually resume normal transit. Bypass pipelines can cut Hormuz dependence from 20 mb/d to 1.8 mb/d by 2035 only at a $40 billion capital cost and without eliminating Middle East export dominance. As a result, domestic electricity—led by 600 TWh annual solar PV additions, nearly 90 GW of nuclear construction, and rapid EV adoption—has become the primary security hedge for importing economies. Yet replacing imported oil and gas with electrified hardware trades maritime chokepoints for a 25% copper deficit and magnet rare earth supply chains where a sub-$10 billion market underpins $6.5 trillion in annual global output.
Related reading
- Who pays for the 2026 energy shock? The numbers, country by country: How the first six months of the 2026 crisis raised fossil-fuel import bills across major buyers.
- The Oil Market Straightens Out: Inside the IEA’s November 2026 Report: Monthly refinery throughput, diesel margins, and near-term crude balances behind the 2026 shock.
- The Global LNG Supply Wave Is Still Coming, but the Gulf Outage Has Delayed Its Relief: Why non-Middle East liquefaction projects matter when Gulf LNG has no pipeline bypass.
- Data Center Power Demand Is Set to Double by 2030. The Grid Is the Bottleneck.: A closer look at how AI compute growth collides with transmission queues.