Two separate numbers about artificial intelligence are rising at different speeds, and that gap is the story. Global data centers’ electricity use is projected to roughly double by 2030. AI’s water footprint, the water tied to that electricity and calculated by a United Nations University team, is set to do the same for the whole data center industry, but AI’s own slice of it is projected to more than quadruple. The reason is simple: AI is a small but fast-growing share of a large and already-growing industry, and water, unlike electricity, has few substitutes once a region runs short. Here is what the numbers show, and what they do not, as part of our continuing AI & Work coverage of what artificial intelligence actually costs to run.
1. 448 to 945 terawatt-hours: the data center baseline
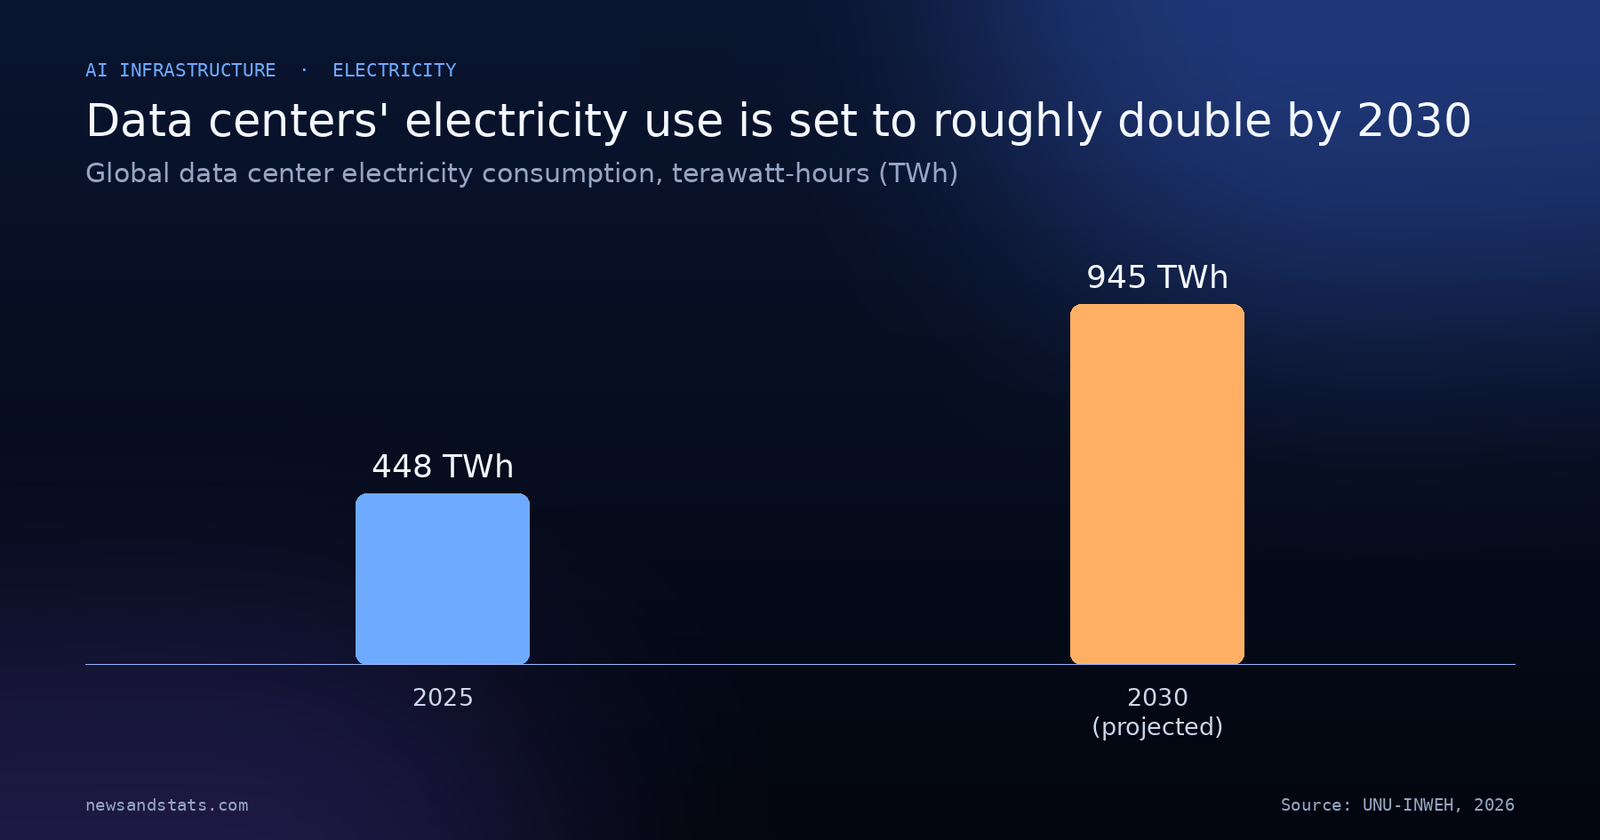
In 2025, the world’s data centers consumed an estimated 448 terawatt-hours (TWh) of electricity, according to a 2026 report from the United Nations University Institute for Water, Environment and Health (UNU-INWEH). If data centers’ electricity use were counted as a country, the report says, it would rank 11th globally by consumption. By 2030, UNU-INWEH projects that figure could roughly double to 945 TWh, which it estimates at about 3% of projected global electricity use that year. This is the same industry, and a similar order of magnitude, covered in our look at data center power demand, which drew on separate IEA figures; the two reports use different baselines and should not be added together or treated as the same measurement.
Source: UNU-INWEH, “Environmental Cost of AI’s Energy Use: Carbon, Water and Land Footprints”, executive summary.
2. AI’s own slice is growing faster than the industry around it
Not all of that electricity runs AI. UNU-INWEH estimates that AI workloads made up roughly 20% of total data center electricity use in 2025, about 93 TWh, and projects that share will grow to about 40% by 2030, which at the same total would put AI’s own electricity use at 378 TWh. Doing the arithmetic on those two AI-only figures (93 TWh in 2025 and 378 TWh in 2030) shows AI’s own electricity use is on track to grow about 4.1 times, versus roughly 2.1 times for data centers as a whole. In other words, every other use of data center capacity is growing too, just more slowly than the AI workloads sitting inside it. That growth gap is why the spending detailed in our coverage of the $750 billion AI bet on infrastructure keeps accelerating even as overall data center demand growth looks comparatively steady.
3. AI’s water footprint: what “footprint” means here
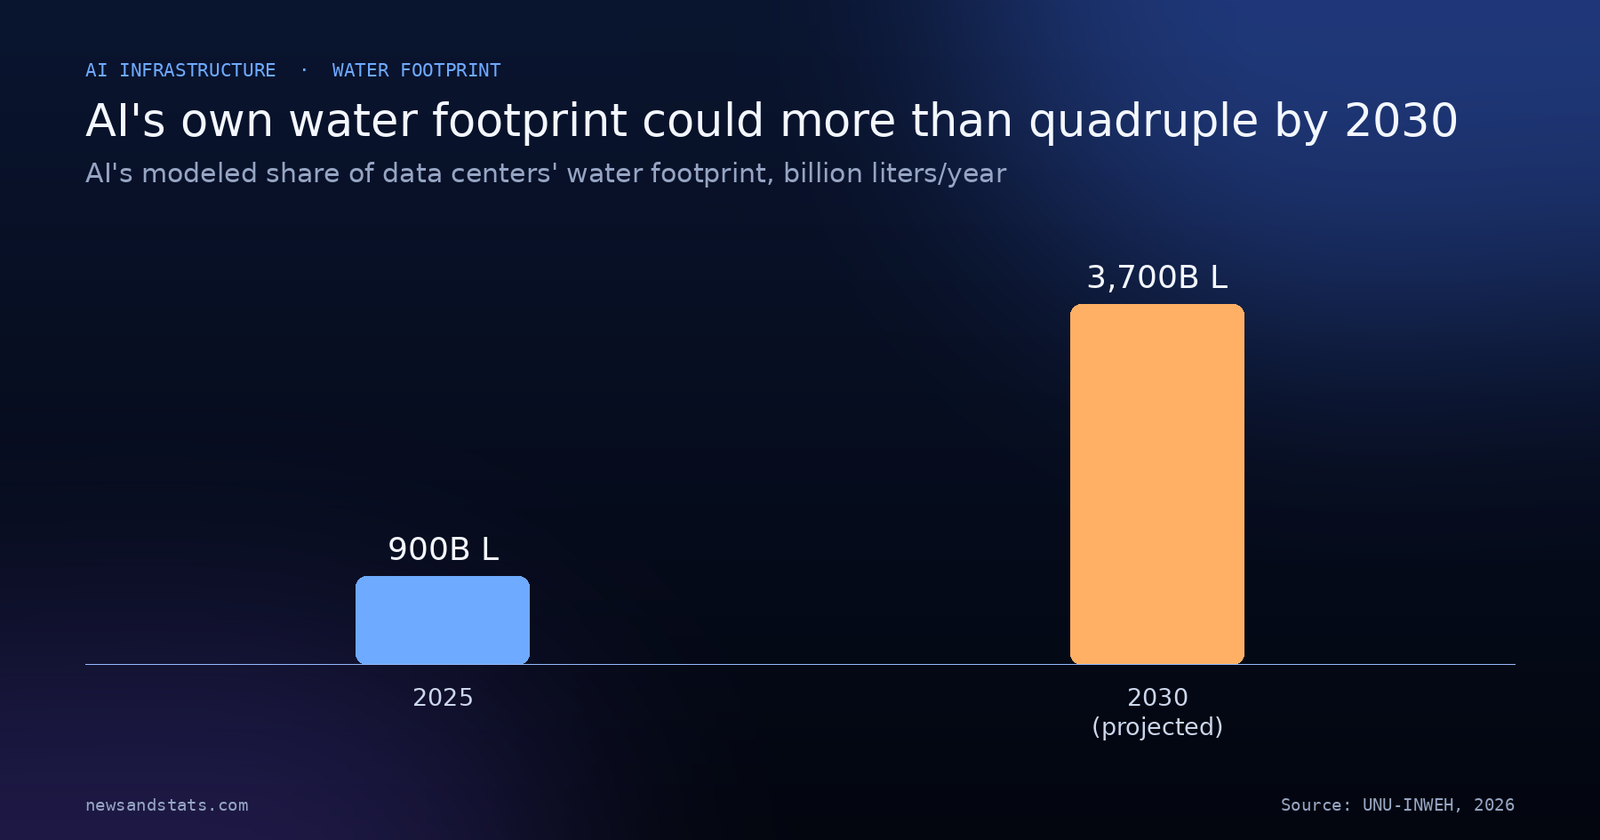
Electricity generation uses water, mostly to cool thermoelectric power plants, and UNU-INWEH converts data centers’ projected electricity use into a water footprint using global average intensity factors. By that method, 2025’s 448 TWh of data center electricity implies a water footprint of about 4.5 trillion liters; by 2030, 945 TWh implies about 9.3 trillion liters. For AI’s own slice specifically, the same method gives over 900 billion liters in 2025, rising to about 3.7 trillion liters in 2030, a figure UNU-INWEH says would be equivalent to the minimum annual domestic water needs of all 1.3 billion residents of Sub-Saharan Africa, for the data center industry’s total footprint (not AI’s slice of it) in that same year. AI’s own 2030 water footprint is more than quadruple its 2025 level on the same basis, tracking its faster-growing electricity use.
Source: UNU-INWEH, “Environmental Cost of AI’s Energy Use: Carbon, Water and Land Footprints”, Section 2.5.
This is an indirect, calculated footprint, not a measured onsite figure, and later sections (6 and 8) look at what measured, onsite water use actually looks like, which is a different and much smaller number.
4. One site, 2,200 swimming pools
To make 5.5 million cubic meters of water a year concrete: that is the volume a water permit allows Google’s Mesa, Arizona data center to use annually, according to the UNU-INWEH report, which is enough to fill about 2,200 Olympic-sized swimming pools. The same report calculates that volume could meet the basic annual water needs of about 753,000 people in Sub-Saharan Africa, at a baseline of 20 liters per person per day. A single large facility’s permitted allowance, in other words, can be sized for a small country’s drinking-water needs, even though a permit is a ceiling, not a measurement of what was actually used.
5. Carbon and land ride along with the electricity
The same electricity-to-footprint method that produces the water figures also produces carbon and land estimates. UNU-INWEH puts data centers’ 2025 carbon footprint at about 189 million tonnes of CO2-equivalent, rising to about 399 million tonnes by 2030, and their land footprint (for power plants, transmission corridors, and fuel extraction tied to that electricity) at about 6,900 square kilometers in 2025, growing to more than 14,500 square kilometers by 2030. The report separately estimates that AI infrastructure could generate up to 2.5 million metric tons of electronic waste a year by 2030, a theme our deeper look at global electronic waste covers at the scale of the whole electronics industry.
6. A quarter of the world’s data centers already sit where water is tight
A separate 2026 study, published by its authors Lorenzo Rosa and Matteo Sangiorgio of the Carnegie Institution for Science and Stanford University through the World Economic Forum, mapped 9,347 data centers worldwide against monthly gaps between renewable water availability and water consumption in their local area. The study finds that 25% of the world’s data centers sit in places with at least one month of water scarcity a year today, a share the authors say could rise to about one in three “as soon as the 2040s” in a warming world. Within that total, 15% of the data centers studied sit in areas with five months or more of scarcity a year, and 6% sit in areas with nine months or more. The United States, which the study says hosts 39% of the world’s data centers, has a similar pattern internally: slightly more than a fifth of US data centers sit in areas with at least one month of scarcity, and 14% sit in areas with five or more months.
7. Just two countries, most of the capacity
The water and siting questions compound a separate concentration problem. As of late 2025, only 32 countries, about 16% of the world’s roughly 195 nations, hosted AI-specialized data centers with the chips and cooling systems advanced AI workloads require, UNU-INWEH reports, and more than 90% of that capacity sat in just two of them, the United States and China. More than 150 countries had little or no sovereign AI computing capacity at all. That concentration sits alongside a different kind of gap we covered in our look at the global digital divide: one is about who can get online, the other about who hosts the infrastructure behind the AI those connections increasingly reach. It also underlines how narrow the base of today’s AI buildout is, a point our Stanford AI Index coverage found echoed in private AI investment data.
8. What facilities actually pump: a different, smaller number
The trillions-of-liters figures above are a calculated footprint from electricity, not a measurement of what individual facilities draw from a tap or a river. The Pacific Institute, a water policy research organization, assembled onsite withdrawal and consumption data for a sample of large data center facilities, drawn from Google’s 2025 Environmental Report, Microsoft’s 2026 Data Center Fact Sheet, and a 2026 academic estimate, covering 65 facilities for withdrawal and 36 for consumption and discharge.
| Measure | Average | Median | Minimum | Maximum |
|---|---|---|---|---|
| Annual water withdrawal (million gallons) | 159 | 44.3 | 0.10 | 1,410 |
| Annual water consumption (million gallons) | 123 | 32.1 | 0.01 | 1,010 |
| Annual water discharge (million gallons) | 56.1 | 22.6 | 0.10 | 400 |
Source: Pacific Institute, “How Much Water Do Data Centers Use? And Why Does It Matter?”, Table 1.
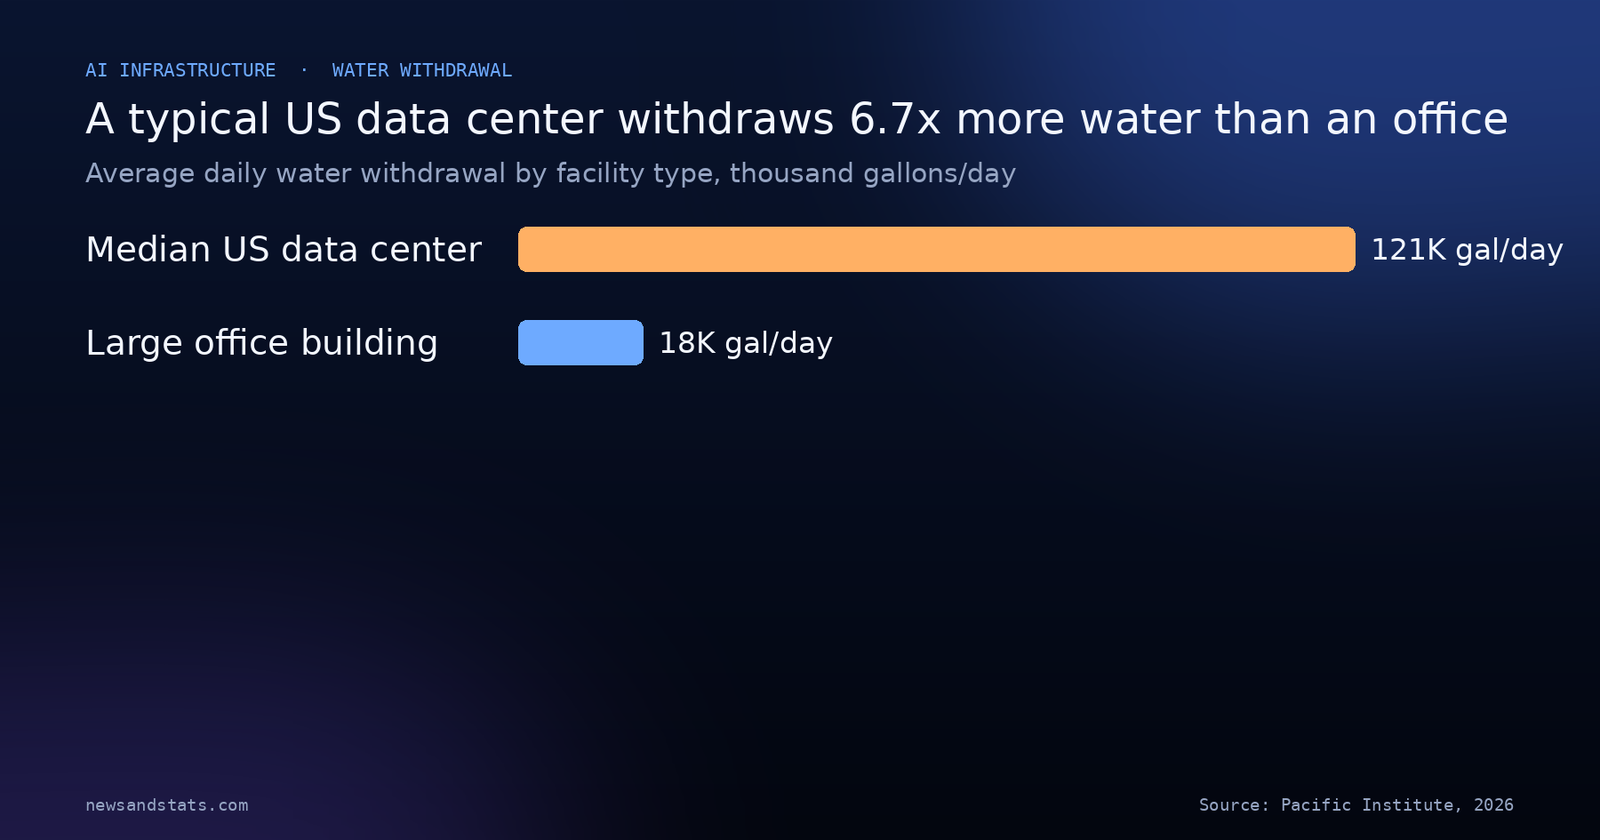
Converted to a daily basis, the Pacific Institute puts the median facility’s withdrawal at about 121,000 gallons a day. For comparison, a large commercial office building averages about 18,000 gallons a day, based on the US Energy Information Administration’s most recent water-use survey of commercial buildings, cited in the same brief. That puts the median data center’s withdrawal at about 6.7 times a typical office building’s, and the brief finds 91% of the 65 facilities withdrew more water than a typical office building. The three most water-intensive facilities in the sample averaged about 3.1 million gallons a day, or about 172 times a large office building, according to the brief’s own comparison.
Source: Pacific Institute, “How Much Water Do Data Centers Use? And Why Does It Matter?”, Section 2.
Separately, among the facilities the Pacific Institute tracked for consumption, 10% to 94% of the water withdrawn was actually consumed (not returned to its source), with a median of 74%. Across all 65 facilities, the brief estimates roughly 11 billion gallons were withdrawn in total, of which about 76% was potable water and 24% was non-potable water, including recycled water and seawater.
9. The United States’ own direct-versus-indirect split
For the US specifically, a July 2026 report from the Information Technology and Innovation Foundation (ITIF) cites the Lawrence Berkeley National Laboratory’s 2024 data center energy usage report to put US data centers’ direct onsite water consumption at 17.4 billion gallons in 2023, and the indirect water consumption used to generate the electricity that powers them at 211 billion gallons, about 12 times the direct figure. ITIF notes that combined, those two figures are less than 1% of total US water consumption, based on the US Geological Survey’s national water-use assessment. That 12-to-1 ratio of indirect to direct water use is the same kind of split the UNU-INWEH global footprint captures, just measured a different way and for a different, narrower geography.
10. How this number gets misread
Three different groups have now published three different kinds of water number about data centers and AI, and conflating them is the most common mistake in coverage of this topic. UNU-INWEH’s 9.3-trillion-liter 2030 figure is a global, indirect, electricity-based footprint for all data centers; its 3.7-trillion-liter figure is the same method applied only to AI’s modeled share. The World Economic Forum commentary by Rosa and Sangiorgio separately estimates that global data centers’ own direct, onsite water consumption could reach about 1.2 billion cubic meters (1.2 trillion liters) by 2030, which the authors say is still only about 0.1% of global water consumption and about 1/800th of what irrigated agriculture uses worldwide. And the Pacific Institute and ITIF figures above are measured, present-day, facility- or country-level onsite numbers, not projections. None of these four figures describes the same thing, and none should be added to another or treated as replacing it. Read in isolation, a figure like “9.3 trillion liters” sounds catastrophic; read alongside the 0.1%-of-global-consumption estimate, the same AI buildout looks like a rounding error next to agriculture. Both framings use real, sourced numbers. The honest picture needs both: AI’s water footprint is a small share of the world’s water use today, and it is also one of the fastest-growing slices of that use, concentrated in a small number of places, some of which are already short on water.
What to watch
- Whether UNU-INWEH’s assumption that AI reaches 40% of data center electricity by 2030 holds up as hyperscalers report their own workload mixes.
- Whether more of the 32 countries that currently host AI-specialized data centers are joined by others, narrowing the US-China concentration, as sovereign AI compute programs expand.
- Whether water-permit disclosures, like Google’s Mesa, Arizona allowance, become standard for new large facilities, making onsite comparisons easier.
- Whether grid operators follow Ireland’s lead in pausing or capping new data center electricity connections over local resource limits, as our coverage of IEA’s renewables build-out suggests will matter more as both power and water constraints tighten.
- Whether the share of data centers sited in water-scarce basins rises toward the one-in-three level the Rosa and Sangiorgio study projects for the 2040s, or whether siting shifts to avoid it.
The bottom line
AI’s water footprint is still a small fraction of global water use, by every primary estimate in this article. But it is growing roughly twice as fast as the data center industry that hosts it, concentrated in just two countries for most of its specialized capacity, and increasingly sited in places already short on water some months of the year. The trillions-of-liters headline numbers are a real, calculated footprint of AI’s electricity use, not a measurement of what a single facility pumps from a well, and both kinds of number matter for different reasons. Watching the share of AI’s own slice, not just the industry total, is the number worth tracking as this buildout continues.
Related reading
- Data Center Power Demand Is Set to Double by 2030. The Grid Is the Bottleneck.: the electricity side of the same infrastructure boom, with IEA and grid-connection figures.
- The $750 billion AI bet: who spends it, and who pays: who is funding the data center buildout behind these electricity and water projections.
- Global Electronic Waste in 8 Numbers: The 62-Million-Tonne Mountain and $62 Billion Lost: the waste side of the same hardware boom.
- The Global Digital Divide in 8 Numbers: 2 Billion Still Offline: a different kind of AI-era gap, over who can get online at all.