The commercial race for artificial intelligence has entered a phase of massive capital concentration and tightening technical competition. According to the Stanford Institute for Human-Centered AI (HAI) in its landmark Inside the AI Index: 12 Takeaways from the 2026 Report, the artificial intelligence landscape is defined by a central paradox: technical capabilities and private capital are breaking historical records, but the geographic leads that once defined the industry are rapidly evaporating.
Produced annually since 2017 by an independent steering committee of academic and industry researchers, the Stanford AI Index provides the most comprehensive empirical assessment of the AI sector. The 2026 edition documents an explosion in corporate spending, a near-quadrupling in autonomous agent capabilities, and a dramatic acceleration in consumer adoption. Yet it also uncovers escalating environmental costs, rising model opacity, and severe labor market contractions targeting young professionals. Here are the eight numbers from the Stanford AI Index 2026 that explain where artificial intelligence stands today.
1. $344.7 billion: Private AI investment surges by 127.5%
The financial scale of artificial intelligence deployment reached unprecedented territory in 2025. According to Stanford HAI, global private investment in AI reached $344.7 billion, representing an increase of 127.5% over 2024 levels.
When broader mergers, acquisitions, and public offerings are included, total global corporate AI investments hit $581.7 billion in 2025, up 130% from the previous year. This capital influx reflects a structural realignment of corporate balance sheets, as enterprises transition from speculative exploratory trials to full-scale infrastructure deployments.
This private funding surge operates in tandem with the hyperscaler capital expenditure boom, where technology conglomerates are deploying hundreds of billions of dollars annually into data center hardware, networking fabric, and custom silicon. Rather than retreating under macroeconomic uncertainty, institutional capital has concentrated intensely on frontier foundation model labs and compute clusters.
2. 23.1 to 1: The United States private capital chasm
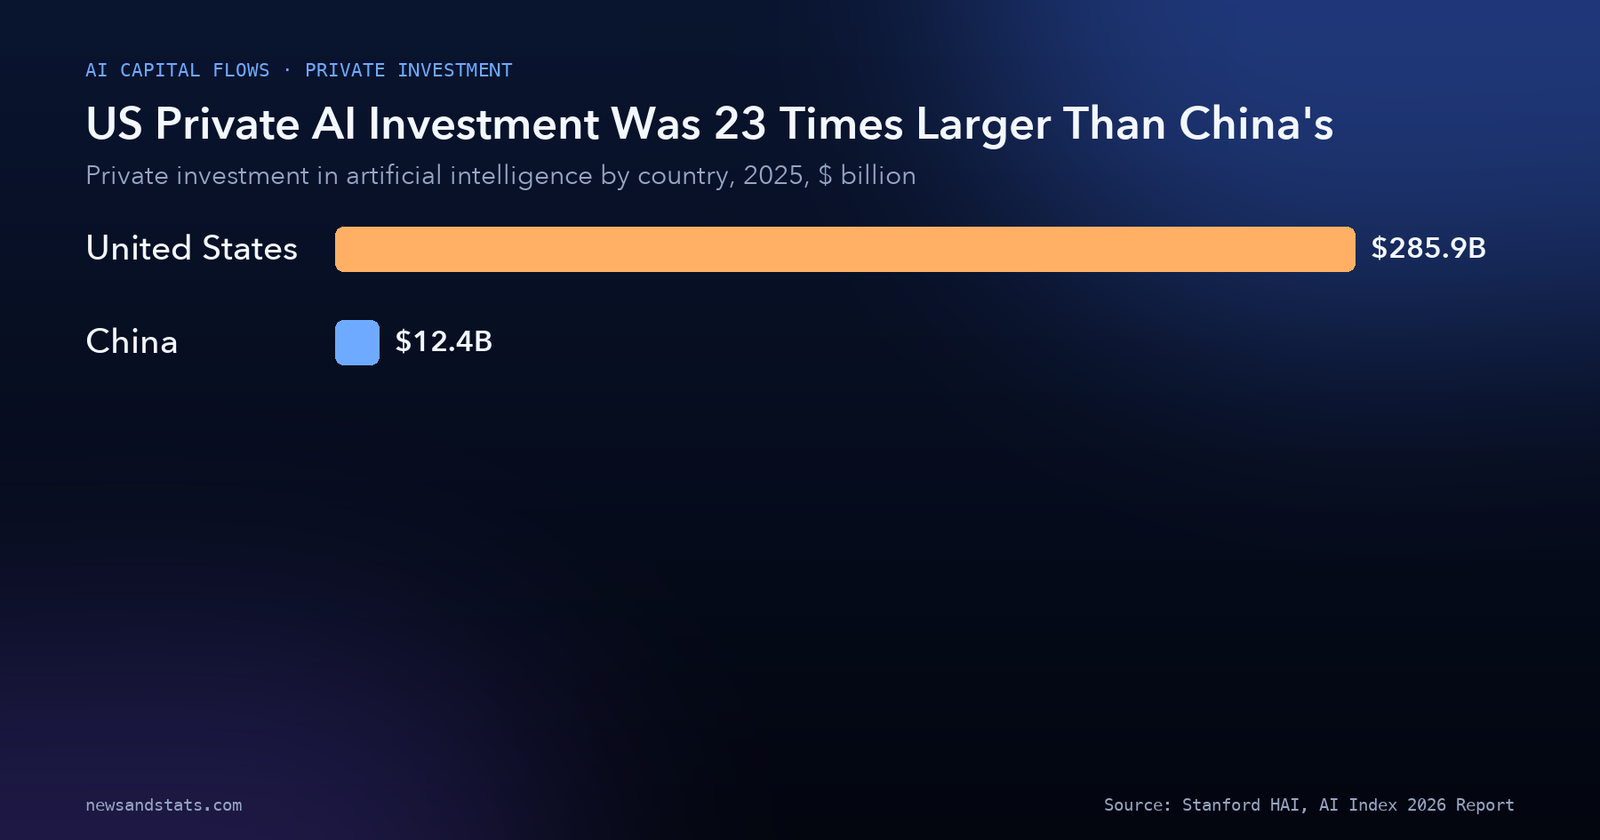
Geographically, private equity and venture capital dollars remain heavily centralized in North America. The United States led all nations in private AI funding, deploying $285.9 billion in 2025.
By contrast, China—the world’s second-largest recipient of private AI capital—recorded $12.4 billion in private investment. Our calculation: US private AI investment was 23.1 times greater than China’s in 2025, representing a funding gap of $273.5 billion within a single calendar year.
Source: Stanford HAI, Inside the AI Index: 12 Takeaways from the 2026 Report.
However, Stanford researchers emphasize that private investment metrics alone understate China’s total capital mobilization. While American innovation relies predominantly on private venture equity, the Chinese government channels funding through state-initiated government guidance funds. Between 2000 and 2023, an estimated $912 billion was deployed across strategic industries through these mechanisms, providing state-backed capital for semiconductor fabrication, robotics, and foundation models. As examined in our comparison of the economic gap between India and China, state industrial financing allows Chinese technology firms to compete aggressively on domestic scale even with smaller private venture rounds.
3. 2.7%: The evaporating performance lead over China
Despite America’s 23-to-1 private funding advantage, the technical performance gap between leading American and Chinese foundation models has shrunk to a razor-thin margin.
Stanford HAI reports that after years of decisive American supremacy across model size, technical benchmarks, and academic citations, China has emerged as a peer counterweight. Leading American and Chinese models have repeatedly traded places at the top of technical benchmark rankings since early 2025. In February 2025, China’s DeepSeek-R1 briefly matched the top US model. As of March 2026, Anthropic’s top frontier model held an overall performance lead of just 2.7% over China’s leading model.
This technical compression demonstrates that algorithmic innovations, open-weight model architectures, and efficient post-training optimization allow well-resourced engineering teams to achieve frontier parity with significantly less training compute. While the United States continues to lead in producing top-tier foundation models and high-impact patents, China now leads the world in total AI publication volume, academic citations, patent output, and industrial automation.
4. 29.6 gigawatts: The physical power and environmental toll
The escalating capabilities of frontier intelligence carry an immense physical footprint. Stanford HAI reports that global AI data center power capacity reached 29.6 GW in 2025.
To put 29.6 GW in perspective: it equals the peak electrical demand of the entire state of New York, while the cumulative power demand of all active AI systems is now comparable to the national electricity consumption of Switzerland or Austria. This physical demand intersects directly with power grid bottlenecks and transmission constraints, where utilities struggle to interconnect multi-gigawatt compute campuses without displacing manufacturing and municipal loads.
The carbon and resource intensity of frontier training runs has expanded in parallel:
- Training Grok 4 produced an estimated 72,816 tons of carbon dioxide equivalent, roughly equal to the emissions generated by driving 17,000 gasoline cars for an entire year.
- Annual inference water use for GPT-4o alone—water consumed to cool server racks or evaporated in hydroelectric generation—may exceed the total drinking water requirements of 1.2 million people.
5. 89%: The dramatic collapse in America’s international talent draw
While the United States remains home to the largest absolute population of AI researchers and developers, its ability to attract global scholars has experienced a severe decline.
According to Stanford HAI, the inflow of international AI scholars moving to the United States has dropped by 89% since 2017. Furthermore, this contraction has accelerated dramatically, plunging by 80% in the last year alone.
This talent drain marks a profound vulnerability for the American technology ecosystem, which has historically relied on international graduate students and foreign-born researchers to staff industrial laboratories. Stricter visa scrutiny, administrative backlogs, geopolitical tensions, and expanding domestic research funding in Europe and East Asia have diverted top graduate talent to competing hubs in Canada, the United Kingdom, Singapore, and China.
6. 20%: The entry-level employment contraction
Workforce disruption from artificial intelligence has transitioned from a theoretical forecasting exercise into measured reality, with junior workers bearing the initial brunt.
The Stanford AI Index reveals that employment among software developers aged 22 to 25 has plummeted nearly 20% since 2024. Remarkably, this contraction occurred even as overall employment headcount for older, senior software engineers continued to grow.
This selective labor squeeze mirrors dynamics in other exposed service occupations, such as customer service and clerical data manipulation. Corporate surveys cited by Stanford indicate that executives expect this trend to accelerate, with planned headcount reductions outpacing recent hiring freezes. As examined in our empirical review of labor market impacts on entry-level jobs, generative AI allows experienced senior developers to double their individual output, diminishing the traditional corporate economic rationale for hiring and mentoring large entry-level junior cohorts.
7. 77.3% vs 20%: The breakthrough in agentic real-world execution
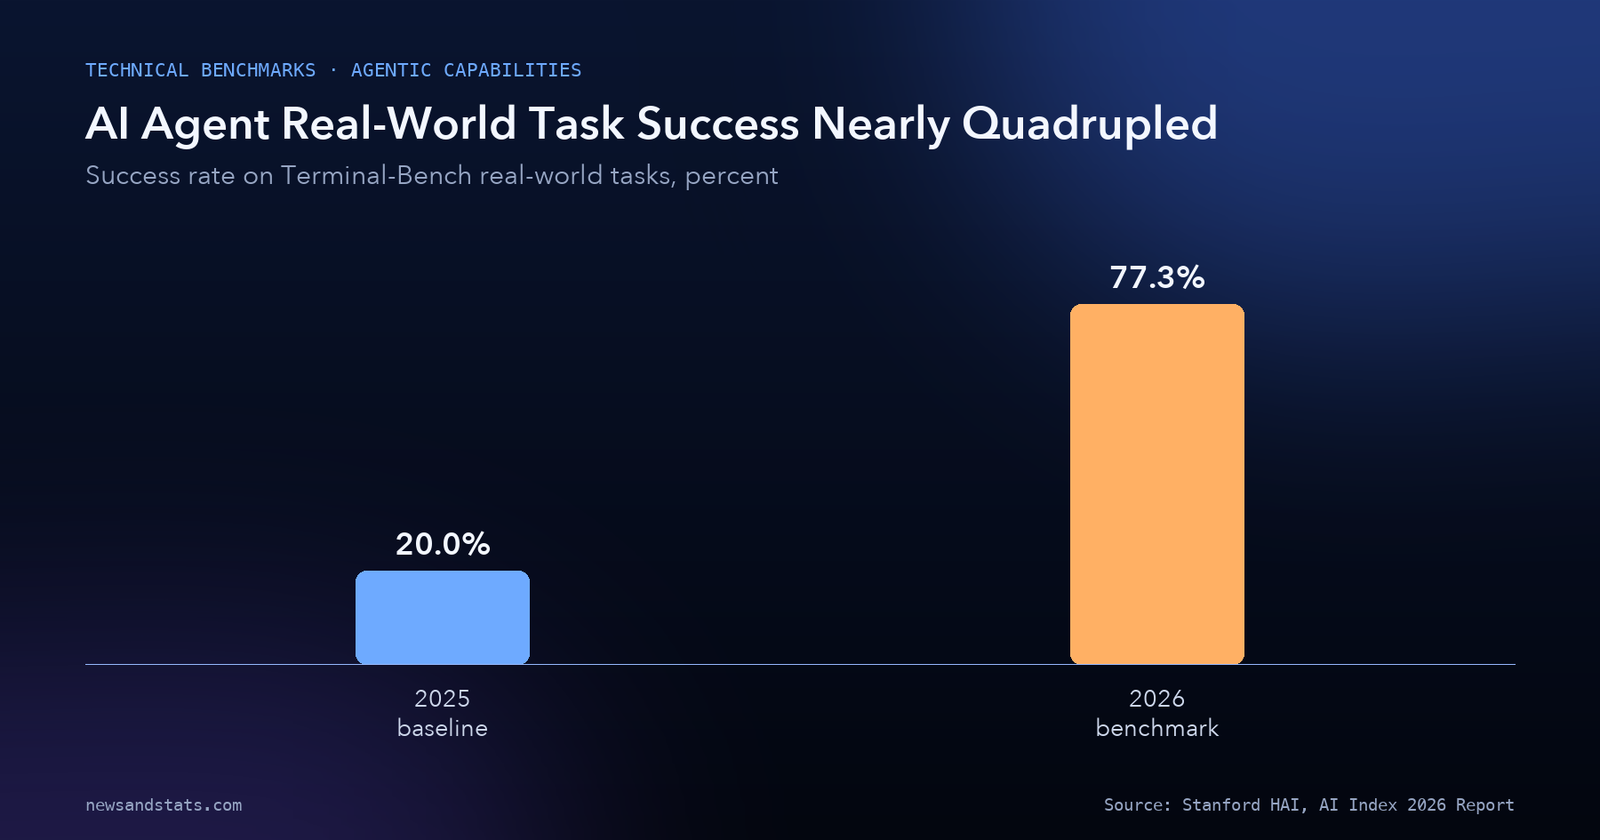
While labor markets adjust, the technical capabilities of autonomous software agents have expanded at a staggering pace. On Terminal-Bench—a rigorous technical benchmark evaluating an agent’s ability to execute complex, multi-step tasks in real computer environments—the success rate surged from 20.0% in 2025 to 77.3% in 2026.
Our calculation: autonomous agent task success on Terminal-Bench nearly quadrupled within twelve months, expanding by 3.86 times (a 286.5% relative increase).
Source: Stanford HAI, Inside the AI Index: 12 Takeaways from the 2026 Report.
Similar performance leaps appeared in cybersecurity, where automated AI agents successfully solved vulnerability and security challenges 93% of the time, compared to just 15% in 2024. In clinical medicine, automated ambient documentation tools reduced physician time spent writing clinical notes by up to 83%, providing substantial relief against administrative burnout.
These software advances contrast sharply with physical robotics, where models still struggle with basic multi-step planning and tactile manipulation. Stanford reports that domestic robots succeed in only 12% of basic household chores, such as washing dishes or folding clothing, illustrating the enduring gap between digital processing and physical embodiment.
Scaling these advanced agentic systems relies on high-throughput compute infrastructure, intersecting with advanced compute and memory hardware bottlenecks where memory bandwidth governs real-time inference latency.
8. 53%: Consumer adoption outpaces the personal computer and internet
On a consumer level, generative artificial intelligence has spread faster than any general-purpose technology in modern history. The Stanford AI Index reports that generative AI reached 53% population adoption within three years of public availability, outpacing the historical adoption trajectories of both the personal computer and the internet.
However, adoption rates vary significantly across geographies and correlate strongly with GDP per capita. Advanced digital economies recorded the highest penetration:
- Singapore leads the world with a 61.0% population adoption rate.
- The United Arab Emirates ranks second globally with a 54.0% adoption rate.
- The United States ranks 24th globally with an adoption rate of 28.3%.

Source: Stanford HAI, Inside the AI Index: 12 Takeaways from the 2026 Report.
Despite lower overall population penetration compared to city-state hubs, the economic surplus generated for American consumers is immense. Stanford estimates that the total economic value of generative AI tools to United States consumers reached $172 billion annually by early 2026, with the median perceived value per user tripling between 2025 and 2026.
Yet this rapid consumer diffusion coincides with declining corporate transparency. The Foundation Model Transparency Index—which tracks whether major AI developers disclose training data, compute scale, and safety evaluations—saw its average industry score plummet from 58 points to 40 points, as leading frontier labs increasingly treat model parameters and training architectures as proprietary commercial secrets.
How to read the Stanford AI Index numbers
Interpreting the Stanford AI Index requires recognizing five critical analytical nuances:
- Private venture funding differs from state capital mobilization. US private investment of $285.9 billion represents venture capital, private equity, and corporate rounds. China’s private total of $12.4 billion excludes the massive state guidance funds ($912 billion historically deployed), understating total Chinese state-directed resource allocation.
- Benchmark parity does not imply architectural symmetry. A 2.7% performance gap between Anthropic and top Chinese models indicates similar outputs on standardized test sets, but underlying compute training efficiency, inference costs, and model architectures may differ fundamentally.
- Agent benchmark success measures specialized environments. A 77.3% success rate on Terminal-Bench evaluates software terminal execution, coding scripts, and API calls. It does not mean autonomous agents can manage open-ended human organizations or multi-stakeholder business negotiation.
- Data center capacity is nameplate potential. A 29.6 GW data center capacity figure measures total connected electrical infrastructure. Actual continuous power draw fluctuates based on model training cycles and real-time user query volumes.
- Entry-level labor contractions reflect hiring pauses, not mass firings. The 20% headcount reduction among software developers aged 22 to 25 reflects reduced campus hiring and delayed recruitment cycles as firms leverage AI tools to increase senior productivity, rather than large-scale pink slips for existing staff.
The global AI landscape at a glance
The following table summarizes the primary metrics established in the Stanford AI Index 2026 across capital investment, technical benchmarks, infrastructure footprints, and labor market shifts.
| Metric | Measured value | Reference timeframe | Key institutional or technical driver | Source |
|---|---|---|---|---|
| Global private AI investment | $344.7 billion | Calendar 2025 | Surged 127.5% year-on-year; corporate hit $581.7B | Stanford HAI AI Index 2026 |
| United States private AI investment | $285.9 billion | Calendar 2025 | 23.1 times greater than China ($12.4 billion) | Stanford HAI AI Index 2026 |
| Chinese state guidance fund deployment | $912 billion | 2000-2023 cumulative | State-backed financing across strategic tech | Stanford HAI AI Index 2026 |
| US-China top model performance gap | 2.7% lead for Anthropic | As of March 2026 | DeepSeek-R1 briefly matched top US model in 2025 | Stanford HAI AI Index 2026 |
| AI data center power capacity | 29.6 gigawatts | 2025 status | Equals peak electrical demand of New York State | Stanford HAI AI Index 2026 |
| Grok 4 training carbon emissions | 72,816 tons CO2e | Training benchmark | Equals driving 17,000 gasoline cars for one year | Stanford HAI AI Index 2026 |
| GPT-4o inference water consumption | 1.2 million people | Annual estimate | Server cooling and hydroelectric evaporation | Stanford HAI AI Index 2026 |
| Foreign AI scholar inflow to the US | 89% total drop | Since 2017 baseline | Accelerated with an 80% decline in the last year | Stanford HAI AI Index 2026 |
| Junior software developer employment | 20% headcount drop | Since 2024 baseline | Concentrated in developers aged 22 to 25 | Stanford HAI AI Index 2026 |
| Terminal-Bench agent task success | 77.3% success rate | 2026 benchmark | Nearly quadrupled from 20.0% in 2025 | Stanford HAI AI Index 2026 |
| Agent cybersecurity problem solving | 93% success rate | 2026 benchmark | Dramatic increase from 15% in 2024 | Stanford HAI AI Index 2026 |
| Robotic household chore success | 12% success rate | Physical benchmark | Demonstrates enduring digital vs physical gap | Stanford HAI AI Index 2026 |
| Global GenAI population adoption | 53% adoption rate | 3-year milestone | Faster adoption than personal computer or internet | Stanford HAI AI Index 2026 |
| Singapore GenAI population adoption | 61.0% adoption rate | 2026 penetration | Highest national adoption rate in the world | Stanford HAI AI Index 2026 |
| United States GenAI adoption | 28.3% adoption rate | 2026 penetration | 24th globally; generates $172B consumer value | Stanford HAI AI Index 2026 |
| Foundation Model Transparency Index | 40 points average | 2026 index | Dropped from 58 points as proprietary secrecy rose | Stanford HAI AI Index 2026 |
| Clinical documentation time reduction | Up to 83% time saved | Hospital trials | Automated clinical notes reduce physician burnout | Stanford HAI AI Index 2026 |
Source: Stanford Institute for Human-Centered AI (HAI), Inside the AI Index: 12 Takeaways from the 2026 Report.
What to watch
- Whether private AI investment sustains its rapid expansion pace in 2026 or experiences a cyclical cooling as venture capital funds demand commercial profitability.
- The performance trajectory of next-generation Chinese foundation models, monitoring whether open-weight architectures overtake proprietary American systems on multi-modal benchmarks.
- United States immigration and visa policy reforms, assessing whether federal initiatives reverse the 89% collapse in international AI researcher migration.
- Campus hiring and computer science graduate employment in 2026, observing whether corporate junior developer headcount stabilizes.
- The commercial scaling of agentic operating systems in enterprise workflows following the 77.3% success benchmark on Terminal-Bench.
- Power utility regulatory proceedings in Virginia, Texas, and Ireland regarding grid connection priority for multi-gigawatt artificial intelligence data centers.
The bottom line
The 2026 Stanford AI Index documents an industry operating at peak velocity: private investment surged 127.5% to $344.7 billion, consumer adoption crossed 53% in three years, and agentic task success jumped from 20% to 77.3%. Yet the technological landscape has fundamentally shifted: despite America’s 23-to-1 private funding lead, China has closed the performance gap to just 2.7%, while the United States confronts an 89% drop in foreign talent inflows and an accelerating 20% employment contraction among junior software engineers. As AI data centers demand 29.6 GW of electrical capacity and model transparency falls, artificial intelligence is no longer an isolated technical domain—it is a physical, geopolitical, and economic contest reshaping the global division of labor. For the broader macroeconomic environment framing these investments, explore our review of the macroeconomic environment from the IMF, and visit our AI & Work section for continuing analysis of workplace transformation.
Related reading
- Is AI hurting entry-level jobs? Two studies, two answers: junior technology employment, career apprenticeships, and hiring freezes.
- Five Million Robots in Factories: The Global Automation Surge in 8 Numbers: physical robotics, operational factory fleets, and global manufacturing automation.
- Data Center Power Demand Is Set to Double by 2030. The Grid Is the Bottleneck.: utility capacity, substation delays, and the energy footprint of digital infrastructure.