
Euro area inflation accelerated to 4.0% in October 2026, up from 3.8% in September and nearly double the 2.1% rate recorded in October 2025. According to Eurostat’s Euro indicators release published on 18 November 2026, European Union annual inflation also reached 4.0%, rising from 3.8% in September and 2.5% a year earlier. Month over month, prices rose 0.5% in the euro area and 0.4% across the EU. Behind the headline number lies a sharp split: surging energy bills connected to the global energy import shock accounted for nearly half of all annual euro area inflation, while core prices excluding energy stayed flat at 2.3%.
1. Energy Drove 47.3% of Euro Area Inflation
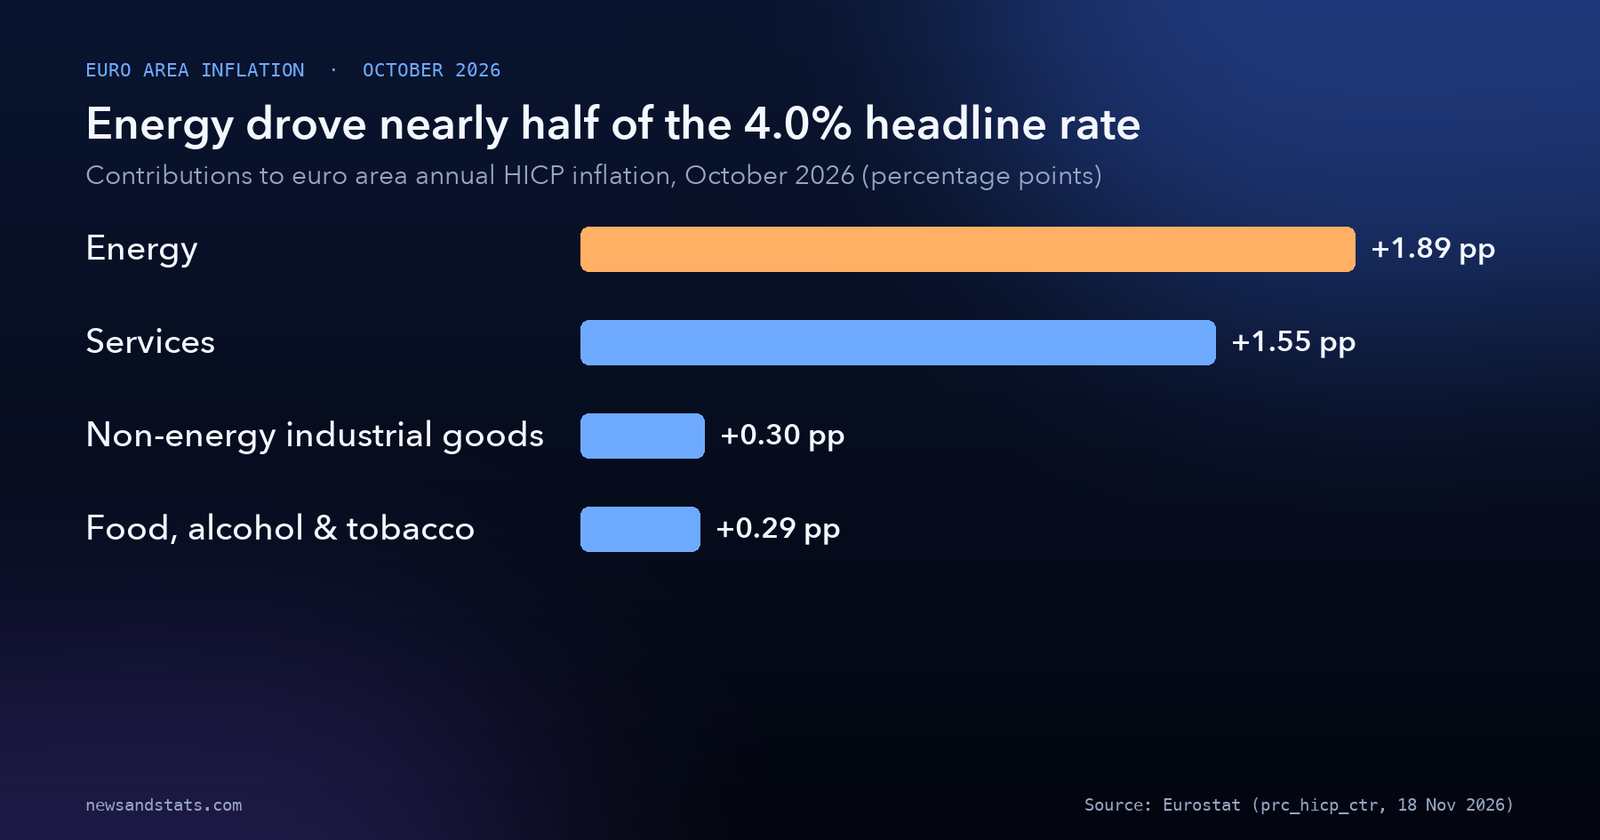
Breaking the 4.0% headline figure into its four main components shows how concentrated the price surge has become. In October 2026, energy contributed +1.89 percentage points to the annual euro area inflation rate, followed by services at +1.55 percentage points. Non-energy industrial goods added +0.30 percentage points, and food, alcohol, and tobacco added +0.29 percentage points.
My calculation shows that energy alone accounted for 47.3% of the 4.0% headline rate (+1.89 divided by 4.0). Combined, energy and services contributed +3.44 percentage points, or 86.0% of total euro area inflation (+3.44 divided by 4.0). That concentration stands out even more when compared against household spending weights: in the 2026 Harmonised Index of Consumer Prices (HICP) basket, energy carries a weight of 90.3 parts per thousand, or 9.03% of total household consumption, whereas services carry a weight of 468.2 parts per thousand.
Source: Eurostat, Annual inflation up to 4.0% in the euro area, Contributions table (prc_hicp_ctr).
2. Energy Jumped 21.0% While Core Inflation Held at 2.3%
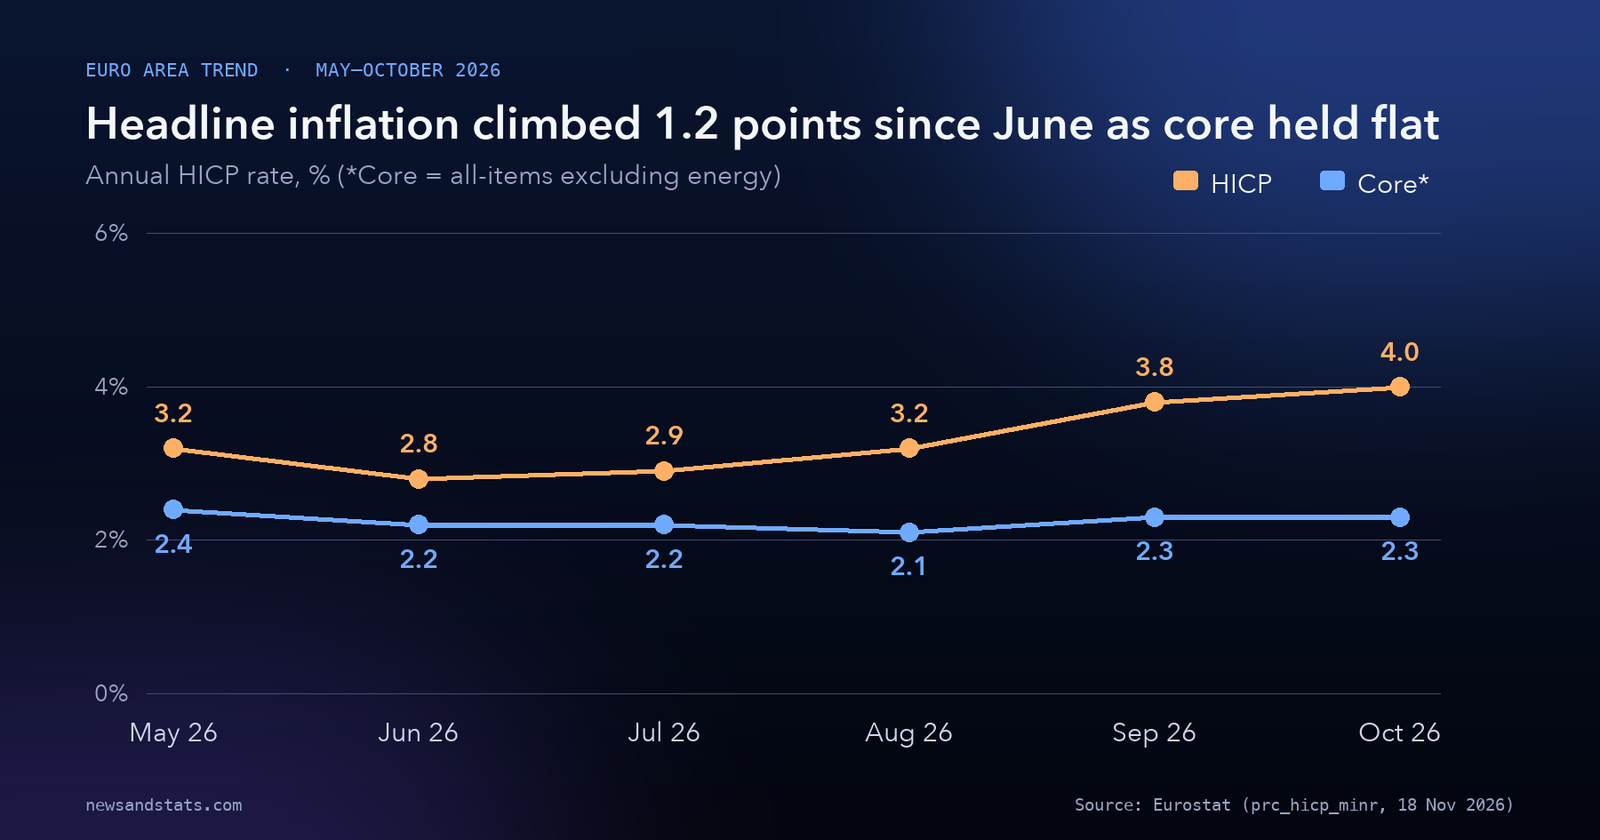
The gap between headline inflation and underlying price trends widened steadily across the second half of 2026. In June 2026, euro area annual inflation sat at 2.8%. Over the next four months, headline inflation climbed by 1.2 percentage points (my calculation: 4.0% minus 2.8%), reaching 2.9% in July, 3.2% in August, 3.8% in September, and 4.0% in October.
Energy drove virtually all of that acceleration. In October 2025, euro area energy prices were falling at -0.9% year-over-year. By May 2026, energy inflation reached 10.8%, eased to 8.5% in June, and then surged to 10.3% in July, 14.3% in August, 19.0% (revised) in September, and 21.0% in October 2026, including a 1.5% monthly jump in October alone. That energy climb coincided with tightening European oil market pressures and delays to the global LNG supply wave.
Outside energy, price pressures remained steady. All-items inflation excluding energy stood at 2.3% in October 2026, unchanged from 2.3% in September and lower than the 2.4% recorded in October 2025. Narrower core measures showed the same stability: all-items excluding energy, food, alcohol, and tobacco stood at 2.6% (compared with 2.4% a year earlier and 2.5% in September), while all-items excluding energy and unprocessed food held at 2.2%. My calculation puts the spread between headline inflation (4.0%) and inflation excluding energy (2.3%) at 1.7 percentage points.
Source: Eurostat, Annual inflation up to 4.0% in the euro area, Selected aggregates table (prc_hicp_minr and prc_hicp_iw).
3. A 6.4-Point Spread Across EU Member States
Across the 27 European Union member states, consumer inflation diverged sharply in October 2026. Compared with September 2026, annual inflation rose in 16 member states, remained stable in 2 (Lithuania at 6.1% and Denmark at 2.1%), and fell in 9 member states.
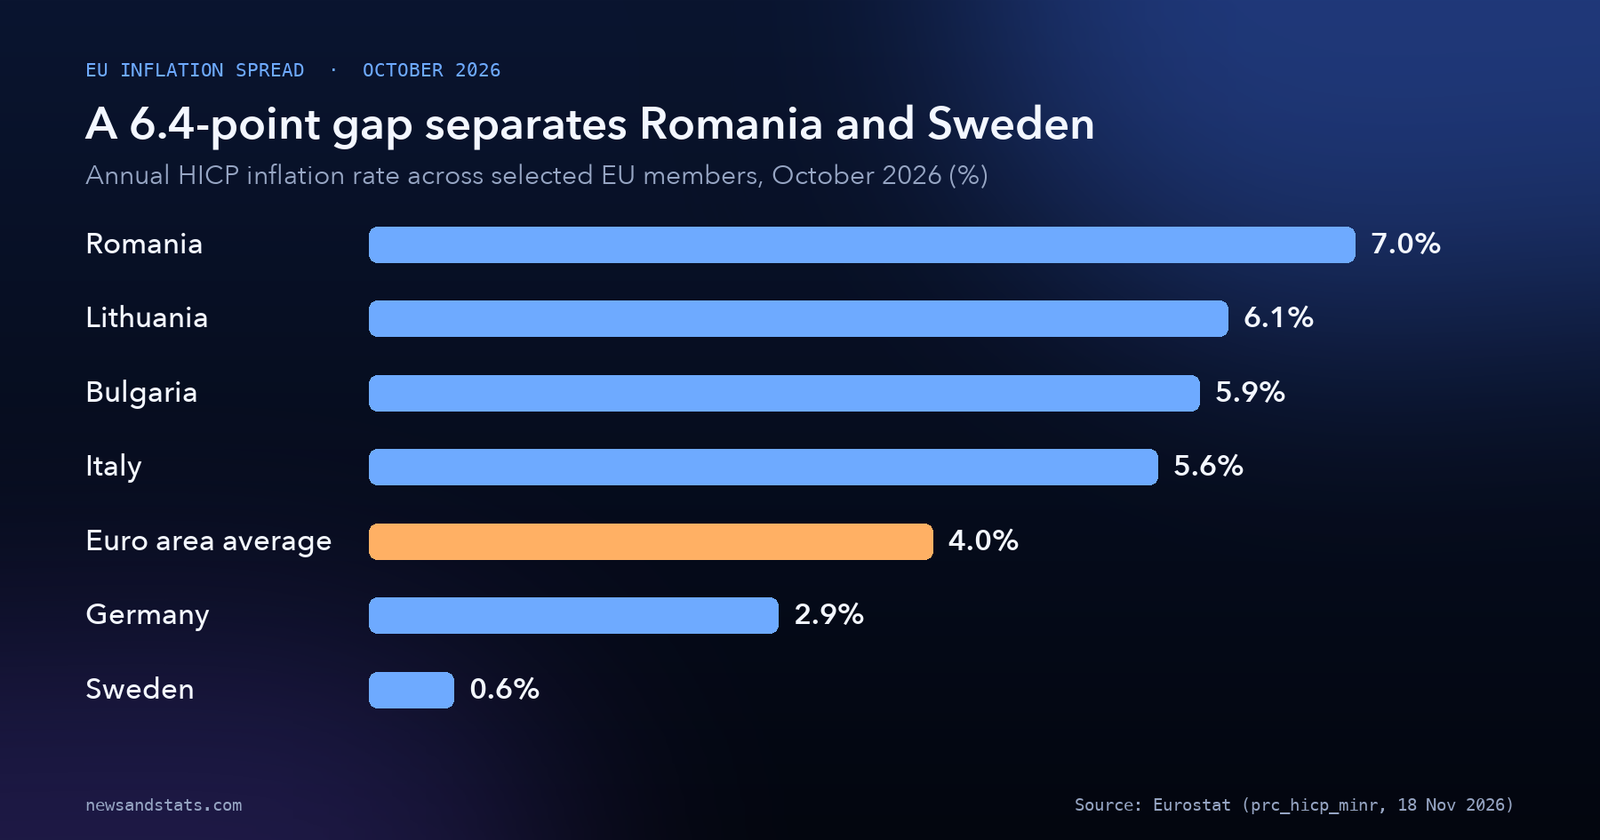
Romania recorded the highest annual inflation rate in the EU at 7.0%, up from 6.5% in September 2026, though still below its 8.4% rate in October 2025. Lithuania ranked second at 6.1%, and Bulgaria—which joined the euro area on 1 January 2026—ranked third at 5.9%. Greece (5.7%), Italy (5.6%), Cyprus (5.4%), and Belgium (5.2%) also posted annual rates above 5.0%.
At the other end of the bloc, Sweden registered the lowest annual inflation rate at 0.6%, down from 1.0% in September and 3.1% a year earlier. Czechia and Denmark tied for second-lowest at 2.1%, followed by Malta at 2.3% and Hungary at 2.4%. My calculation puts the spread between Romania (7.0%) and Sweden (0.6%) at 6.4 percentage points. Among the four largest euro area economies, Italy (5.6%) and Spain (4.9%) sat well above the 4.0% euro area average, while France (3.7%) and Germany (2.9%) remained below it.
Source: Eurostat, Annual inflation up to 4.0% in the euro area, Country HICP table (prc_hicp_minr).
The table below compares October 2026 annual and monthly HICP rates across the euro area, the EU, selected member states, and non-EU European neighbors.
| Country or aggregate | Oct 2025 annual | Sept 2026 annual | Oct 2026 annual | Oct 2026 monthly |
|---|---|---|---|---|
| Romania | 8.4% | 6.5% | 7.0% | 1.0% |
| Lithuania | 3.7% | 6.1% | 6.1% | 0.1% |
| Bulgaria | 3.8% | 5.6% | 5.9% | 0.7% |
| Greece | 1.6% | 5.1% | 5.7% | 0.4% |
| Italy | 1.3% | 4.2% | 5.6% | 1.2% |
| Spain | 3.2% | 5.0% | 4.9% | 0.5% |
| Euro area | 2.1% | 3.8% | 4.0% | 0.5% |
| EU | 2.5% | 3.8% | 4.0% | 0.4% |
| France | 0.8% | 3.4% | 3.7% | 0.4% |
| Germany | 2.3% | 3.3% | 2.9% | -0.1% |
| Denmark | 2.1% | 2.1% | 2.1% | 0.5% |
| Sweden | 3.1% | 1.0% | 0.6% | 0.0% |
| Norway | 2.9% | 3.4% | 3.5% | 0.2% |
| Switzerland | 0.1% | 1.2% | 1.6% | 0.4% |
Source: Eurostat, Annual inflation up to 4.0% in the euro area, Inflation rates (%) measured by the HICP (prc_hicp_minr).
4. Food, Services, and Goods: Where Prices Stayed Contained
Outside the energy sector, euro area consumer inflation showed restrained momentum in October 2026. Services inflation—the largest single category in the HICP basket with a weight of 468.2 parts per thousand—rose 3.3% year-over-year, up slightly from 3.2% in September 2026 but lower than the 3.4% pace recorded in October 2025. Because services account for nearly half of household consumption, their +1.55 percentage-point contribution remained substantial, matching October 2025’s +1.55 percentage-point contribution.
Non-energy industrial goods (weight 252.2 parts per thousand) rose 1.2% year-over-year in October 2026, contributing +0.30 percentage points to the headline rate. Food, alcohol, and tobacco (weight 189.4 parts per thousand) rose 1.5% annually, down from 2.5% in October 2025, contributing +0.29 percentage points. Within food, processed food, alcohol, and tobacco slowed to 0.4% year-over-year (contributing +0.06 percentage points), whereas unprocessed food accelerated to 4.6% (contributing +0.23 percentage points).
5. How Euro Area Inflation Data Get Misread
Three methodological details in the Eurostat October 2026 release explain why headline rates sometimes mislead casual readers tracking the global economic outlook.
First, the euro area expanded on 1 January 2026 when Bulgaria joined, shifting the official series from EA20 (20 countries) to EA21 (21 countries). Eurostat links the two series using a chain index formula, so October 2025 historical rates reflect EA20 while 2026 rates reflect EA21. Second, revisions matter: Germany revised its September 2026 data for natural gas through networks, pushing euro area September energy inflation from 18.9% to 19.0% and lifting energy’s contribution from +1.71 to +1.72 percentage points. Meanwhile, final October energy inflation settled at 21.0%, above the 20.8% flash estimate published on 4 November 2026. Third, energy’s +1.89 percentage-point contribution reflects a 21.0% annual price jump on a 9.03% basket share, meaning energy swings can move headline inflation sharply even when 90.97% of the basket stays stable at 2.3%.
6. Western vs. Eastern Europe and Non-EU Neighbors
Regional comparisons inside and outside the European Union underscore how unevenly energy and services inflation hit European economies in October 2026. Among the EU’s four largest economies, monthly price movements diverged sharply: Italy posted a 1.2% monthly rise that lifted its annual rate from 4.2% in September to 5.6% in October, while France rose 0.4% monthly to 3.7% annually and Spain rose 0.5% monthly to 4.9% annually. Germany moved in the opposite direction, recording a -0.1% monthly decline that lowered its annual rate from 3.3% to 2.9%.
Outside the EU, European Free Trade Association comparators showed a similar split. Switzerland recorded just 1.6% annual inflation in October 2026 (up from 1.2% in September and 0.1% a year earlier), while Norway registered 3.5% and Iceland matched Greece at 5.7% despite a -0.2% monthly dip. Across the EU, 16 member states saw higher annual inflation in October than in September, showing that price acceleration extended well beyond a handful of outliers.
7. Euro Area Components and Core Measures in Full
Eurostat’s full component breakdown illustrates why monetary policymakers separate volatile energy prices from underlying domestic inflation. In the 2026 euro area HICP basket of 1,000.0 parts per thousand, services account for 468.2 parts per thousand, non-energy industrial goods represent 252.2 parts per thousand, and food, alcohol, and tobacco make up 189.4 parts per thousand (split between 137.9 parts per thousand for processed items and 51.4 parts per thousand for unprocessed food). Energy carries the smallest major weight at 90.3 parts per thousand, yet its 21.0% annual surge outweighed every other category.
Monthly price moves in October 2026 reinforced that divergence. Energy rose 1.5% in October alone and unprocessed food climbed 1.0%, whereas services edged up 0.2% and processed food, alcohol, and tobacco rose 0.1%. Non-energy industrial goods increased 0.6% on the month. Across all three standard core measures—all-items excluding energy (909.7 parts per thousand), all-items excluding energy and unprocessed food (858.3 parts per thousand), and all-items excluding energy, food, alcohol, and tobacco (720.4 parts per thousand)—monthly inflation held steady at 0.3%.
| HICP aggregate | 2026 weight (‰) | Oct 2025 annual | Sept 2026 annual | Oct 2026 annual | Oct 2026 monthly |
|---|---|---|---|---|---|
| All-items HICP | 1000.0 | 2.1% | 3.8% | 4.0% | 0.5% |
| All-items excl. energy | 909.7 | 2.4% | 2.3% | 2.3% | 0.3% |
| All-items excl. energy & unprocessed food | 858.3 | 2.4% | 2.2% | 2.2% | 0.3% |
| All-items excl. energy, food, alcohol & tobacco | 720.4 | 2.4% | 2.5% | 2.6% | 0.3% |
| Energy | 90.3 | -0.9% | 19.0% | 21.0% | 1.5% |
| Services | 468.2 | 3.4% | 3.2% | 3.3% | 0.2% |
| Non-energy industrial goods | 252.2 | 0.6% | 1.1% | 1.2% | 0.6% |
| Food, alcohol & tobacco | 189.4 | 2.5% | 1.3% | 1.5% | 0.4% |
| Processed food, alcohol & tobacco | 137.9 | 2.4% | 0.4% | 0.4% | 0.1% |
| Unprocessed food | 51.4 | 2.7% | 4.0% | 4.6% | 1.0% |
Source: Eurostat, Annual inflation up to 4.0% in the euro area, Selected aggregates table (prc_hicp_minr and prc_hicp_iw).
What to watch
- 1 December 2026 flash estimate: Eurostat will release the November 2026 euro area flash estimate on 1 December 2026, testing whether energy inflation stays above 20%.
- 17 December 2026 full HICP release: Complete November 2026 member-state and component data arrive on 17 December 2026, showing whether core inflation excluding energy breaks above 2.3%.
- Energy vs. services gap: Energy (+1.89 pp) and services (+1.55 pp) supplied 86.0% of October’s headline rate; any cooling in wholesale fuel or gas prices will show up rapidly in the energy sub-index.
- Unprocessed food acceleration: Unprocessed food inflation rose from 2.4% in July to 4.6% in October 2026; watch whether retail food prices feed back into processed food.
- Germany vs. Italy divergence: Germany fell to 2.9% while Italy jumped to 5.6%, widening the spread among major euro area economies to 2.7 percentage points.
The bottom line
Euro area inflation reached 4.0% in October 2026, climbing 1.2 percentage points since June as energy prices surged 21.0% year-over-year. Yet inflation excluding energy remained completely flat at 2.3%, demonstrating that the autumn price acceleration came overwhelmingly from energy rather than broad-based overheating in goods or processed food. Across the EU, annual rates spanned a 6.4-percentage-point gap from 0.6% in Sweden to 7.0% in Romania, with 16 member states posting increases over September. Upcoming December releases will determine whether energy’s pass-through spills into core prices or recedes as winter demand unfolds.
Related reading
- Who pays for the 2026 energy shock? The numbers, country by country: How global fossil-fuel import bills translate into domestic inflation pressures.
- The Global LNG Supply Wave Is Still Coming, but the Gulf Outage Has Delayed Its Relief: Why European natural gas costs stayed elevated through late 2026.
- The world economy in 8 numbers: what the IMF’s October 2026 outlook says: How global growth and inflation projections frame late-2026 price trends.