Global air logistics is operating under a dramatic divergence between volume expansion and operating profitability.
According to the official global air cargo market analysis published by the International Air Transport Association on 29 October 2026, worldwide demand for air freight expanded by 7.7% year-on-year in September 2026. Titled North American Cargo Growth Gains Momentum, the report details how international manufacturing export orders, semiconductor shipments, and maritime port delays propelled freight volumes across trans-Pacific and trans-Atlantic trade corridors.
Industry-wide cargo tonne-kilometers (CTK) rose by 7.7% compared to September 2025, accelerating sharply from the 4.4% annual growth rate recorded in August. International traffic—which represents 87.9% of total commercial air freight—performed even more strongly, expanding by 8.6% year-on-year.
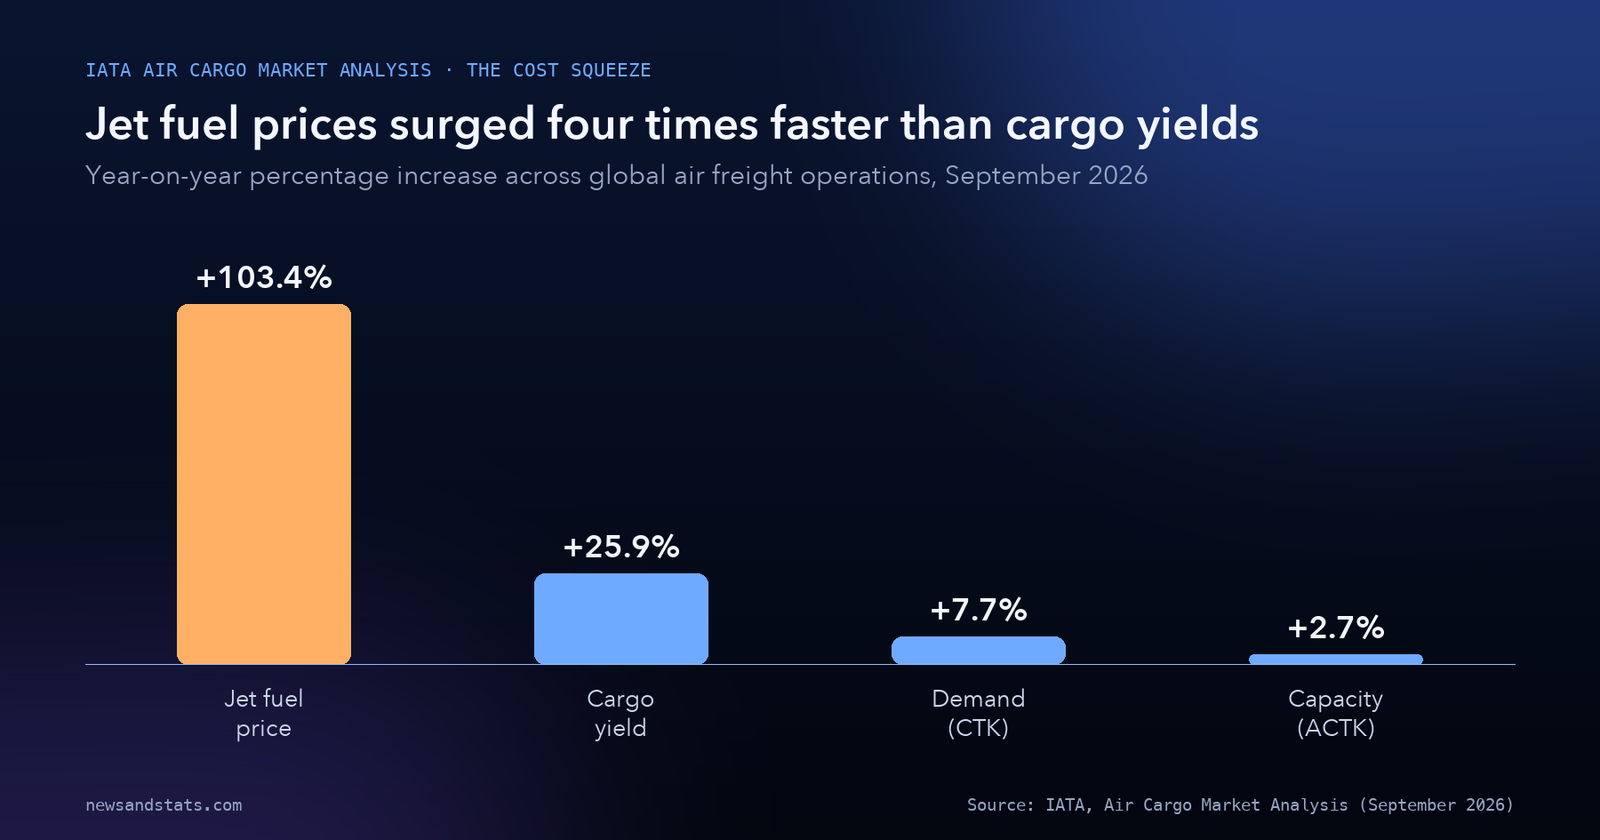
Yet beneath these robust shipping volumes lies an acute commercial margin squeeze. Driven by persistent energy infrastructure disruptions in the Middle East and Russia, international jet fuel prices surged by 103.4% year-on-year in September, more than doubling over twelve months. By comparison, airline cargo yields—the revenue earned per tonne-kilometer transported—rose by only 25.9%. With jet fuel inflating nearly four times faster than freight rates, cargo operators face severe cost friction heading into the fourth-quarter peak shipping season.
1. The 7.7% demand acceleration: global freight breaks out
The 7.7% year-on-year increase in global cargo tonne-kilometers marks the strongest monthly growth acceleration of 2026.
After expanding at a modest 4.4% pace in August, commercial air cargo demand surged across all world carrier regions in September. Over the first nine months of 2026 (January through September), industry-wide CTK expanded by 5.0% compared to the same period in 2025, while international freight grew by 5.5%.
Source: IATA, Air Cargo Market Analysis, Global CTK expansion overview.
Several structural factors explain this sudden autumn freight surge:
- Maritime container diversion: Continued security risks in the Red Sea and naval skirmishes near the Strait of Hormuz forced container ocean liners into lengthy circumnavigations around the Cape of Good Hope. As analyzed in our study of global maritime trade chokepoints, maritime delays of two to three weeks prompted electronics, pharmaceutical, and high-value industrial manufacturers to shift urgent freight onto dedicated air cargo freighters.
- Pre-holiday e-commerce front-loading: Cross-border direct-to-consumer e-commerce platforms in East Asia booked chartered air capacity early to bypass impending regulatory adjustments in Western customs clearances.
- Factory production momentum: Global manufacturing export orders climbed to five-year highs in September, stimulating cross-border flows of specialized industrial machinery components and sub-assemblies.
The 3.3-percentage-point acceleration between August’s 4.4% growth rate and September’s 7.7% rate (my calculation) demonstrates how quickly supply chains pivot to air transport when surface routes face congestion.
2. The cost disconnect: 103.4% fuel surge versus 25.9% yield gain
While freight volume metrics reflect robust commercial health, the economic reality inside airline cargo operations is characterized by extreme fuel cost pressure.
In September 2026, the global benchmark price of aviation jet fuel stood 103.4% above its September 2025 level. Fuel represents an airline’s single largest variable operating expenditure, typically accounting for 30% to 40% of total operating costs on long-haul freighter routes.
Source: IATA, Air Cargo Market Analysis, Fuel cost and yield comparison section.
However, cargo operators were unable to pass these fuel expenses fully onto shippers:
- Cargo yields increased by 25.9%: While an annual yield gain of nearly 26% is historically strong, it lagged far behind the 103.4% fuel spike.
- The margin gap: Subtracting the 25.9% yield gain from the 103.4% jet fuel price increase reveals an immense 77.5-percentage-point cost divergence (my calculation).
- The cost ratio: Jet fuel prices increased 3.99 times faster than freight yields (my calculation).
This operational squeeze mirrors the broader macroeconomic dynamics examined in our report on who pays for the 2026 energy shock. When refined middle distillates (such as diesel and jet fuel) become decoupled from crude oil prices due to refinery damage and transport bottlenecks, energy-intensive transportation networks absorb direct margin erosion.
Speaking from Geneva, Marie Owens Thomsen, IATA’s Senior Vice President of Sustainability and Chief Economist, summarized the dilemma:
“Air cargo demand rose 7.7% year-on-year in September, with growth across all regions. The challenge is cost. Jet fuel prices have more than doubled compared with a year ago, and yields have not kept pace.”
To protect profitability, commercial carriers are aggressively enforcing dynamic fuel surcharges, leaving freight forwarders and shippers to negotiate volatile spot surcharges heading into peak winter logistics.
3. Two regions drive 77% of growth: North America and Asia Pacific
The geographical distribution of air freight expansion in September was heavily concentrated across the Pacific rim.
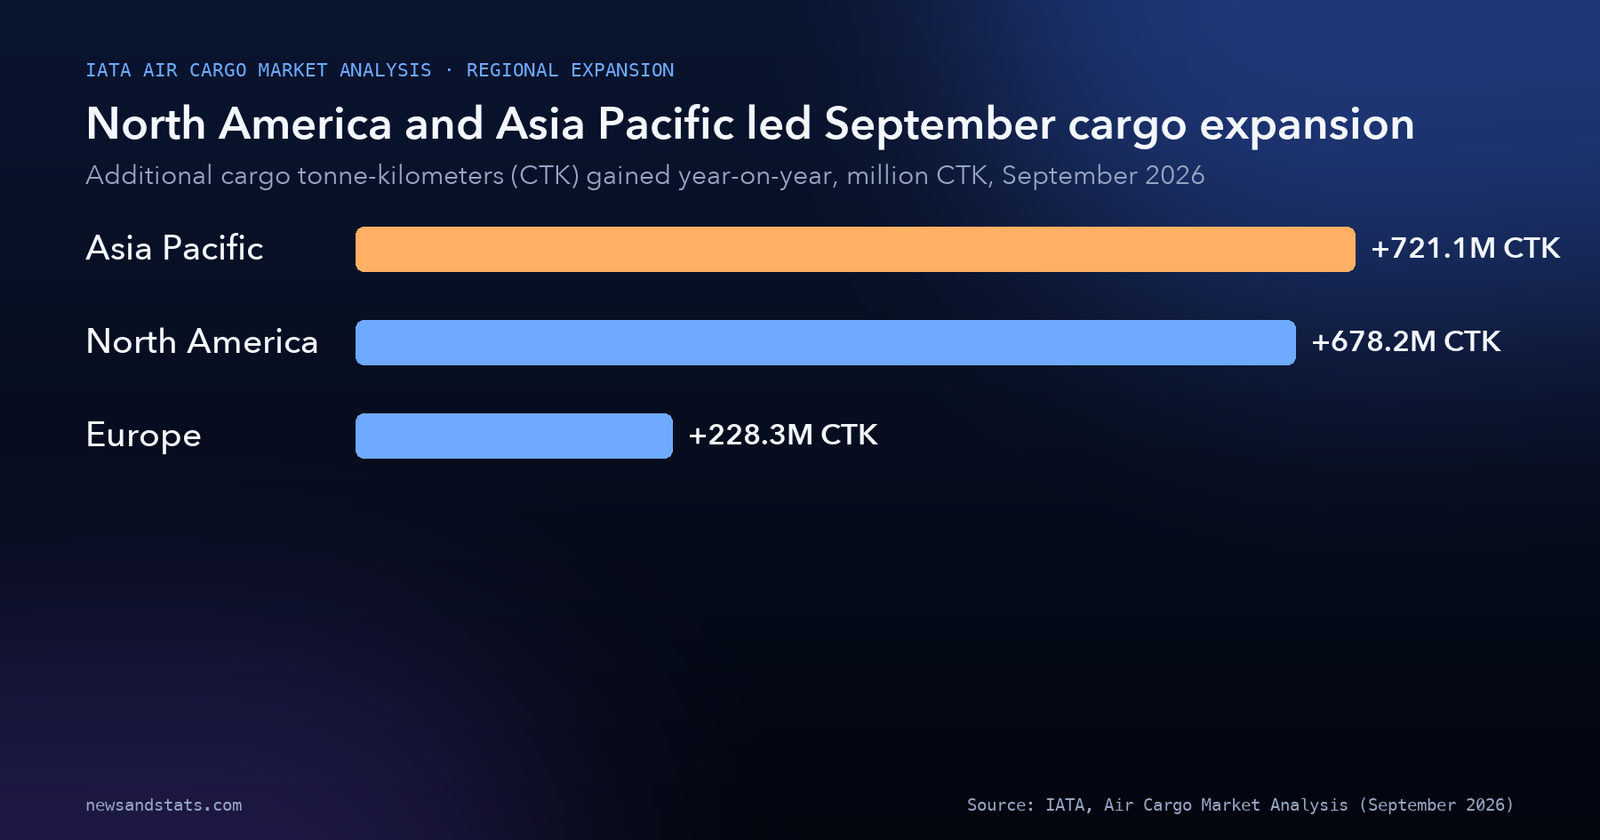
Airlines registered in the Asia Pacific and North America jointly generated 77.0% of total industry year-on-year volume growth in September 2026:
- Asia Pacific carriers: Added 721.1 million CTK, expanding traffic by a substantial margin as manufacturing hubs in China, Taiwan, South Korea, and Southeast Asia ramped outbound shipments.
- North American carriers: Added 678.2 million CTK, driven by domestic network demand and transatlantic trade.
- European carriers: Contributed 228.3 million CTK, representing 12.6% of total global industry growth.
Summing the 721.1 million CTK from Asia Pacific and 678.2 million CTK from North America yields 1,399.3 million CTK (my calculation). Adding Europe’s 228.3 million CTK brings the combined volume gained across these three dominant carrier regions to 1,627.6 million CTK (my calculation).
This freight concentration directly reflects the industrial electronics boom documented in our coverage of the global semiconductor sales surge. High-value graphic processing units, high-bandwidth memory modules, and AI server components are almost exclusively transported via air freight across trans-Pacific flight corridors. Because high-density AI chips represent immense capital value relative to their physical weight, semiconductor manufacturers absorb high air freight tariffs to eliminate the two-week transit penalty of ocean shipping.
4. Route divergence: trans-Atlantic strength versus Middle East contraction
Analyzing air cargo by specific flight corridor reveals acute geopolitical divergence across global shipping lanes.
While trans-oceanic lanes connecting advanced consumer markets experienced robust expansion, corridors touching the Middle East suffered severe operational contraction:
- Europe to North America: International CTK expanded by 9.3% year-on-year in September. This corridor represents 13.5% of the total international air cargo market.
- Asia to North America: Remained the single largest air freight market globally, accounting for 21.5% of all international traffic.
- Middle East to Asia: Contracted by 10.2% year-on-year, marking its seventh consecutive month of negative annual growth.
- Europe to Middle East: Plunged by 18.0% year-on-year, also contracting for a seventh consecutive month.
Subtracting the 10.2% contraction on Middle East-Asia from the 9.3% expansion on Europe-North America highlights a 19.5-percentage-point corridor performance spread (my calculation).
The persistent contraction across Middle East corridors stems from airspace closures, elevated war-risk insurance premiums, and commercial rerouting around conflict zones. While Middle Eastern carriers restored their own registered aircraft operations—expanding their capacity by 7.0% in September—the physical airspace corridor remains impaired for transit traffic, forcing long-haul cargo flights between Europe and Asia to make costly southern or northern detours.
| Carrier region / market segment | Market focus | CTK volume contribution | ACTK capacity change (YoY) | Key operational dynamic |
|---|---|---|---|---|
| Total Global Market | Entire industry | +7.7% YoY growth | +2.7% | Load factor at 47.9% (+2.2 percentage points) |
| International Segments | 87.9% of world cargo | +8.6% YoY growth | +3.3% | Load factor at 52.9% (+2.6 percentage points) |
| Asia Pacific carriers | Pacific & Asia corridors | Added 721.1 million CTK | +4.9% | Supplied 59.6% of net global capacity |
| North American carriers | Trans-Pacific & domestic | Added 678.2 million CTK | +0.8% | Rebounded from August contraction |
| European carriers | Trans-Atlantic & regional | Added 228.3 million CTK | -1.6% | Delivered 12.6% of total global growth |
| Middle East carriers | Gulf hubs & transit | Airspace transit disrupted | +7.0% | Supplied 34.9% of net global capacity |
| Latin American carriers | Americas connectivity | Regional freight growth | +7.6% | Strong regional capacity expansion |
| African carriers | Intra-Africa & intercontinental | Regional freight growth | -1.2% | Fleet and schedule capacity contraction |
Source: IATA, Air Cargo Market Analysis, Table 1: Air cargo market in detail (September 2026).
5. Capacity constraints: why load factors climbed to 52.9%
A key driver of rising freight rates is the tightening balance between available belly-hold cargo space and shipper demand.
Across the global airline industry, capacity—measured in available cargo tonne-kilometers (ACTK)—grew by just 2.7% year-on-year in September 2026 (rising 3.3% on international routes). Over the full first nine months of the year, industry capacity grew by only 1.7%:
- Demand outpaces supply: Because demand (+7.7%) grew nearly three times faster than capacity (+2.7%), aircraft flew with significantly fuller cargo holds.
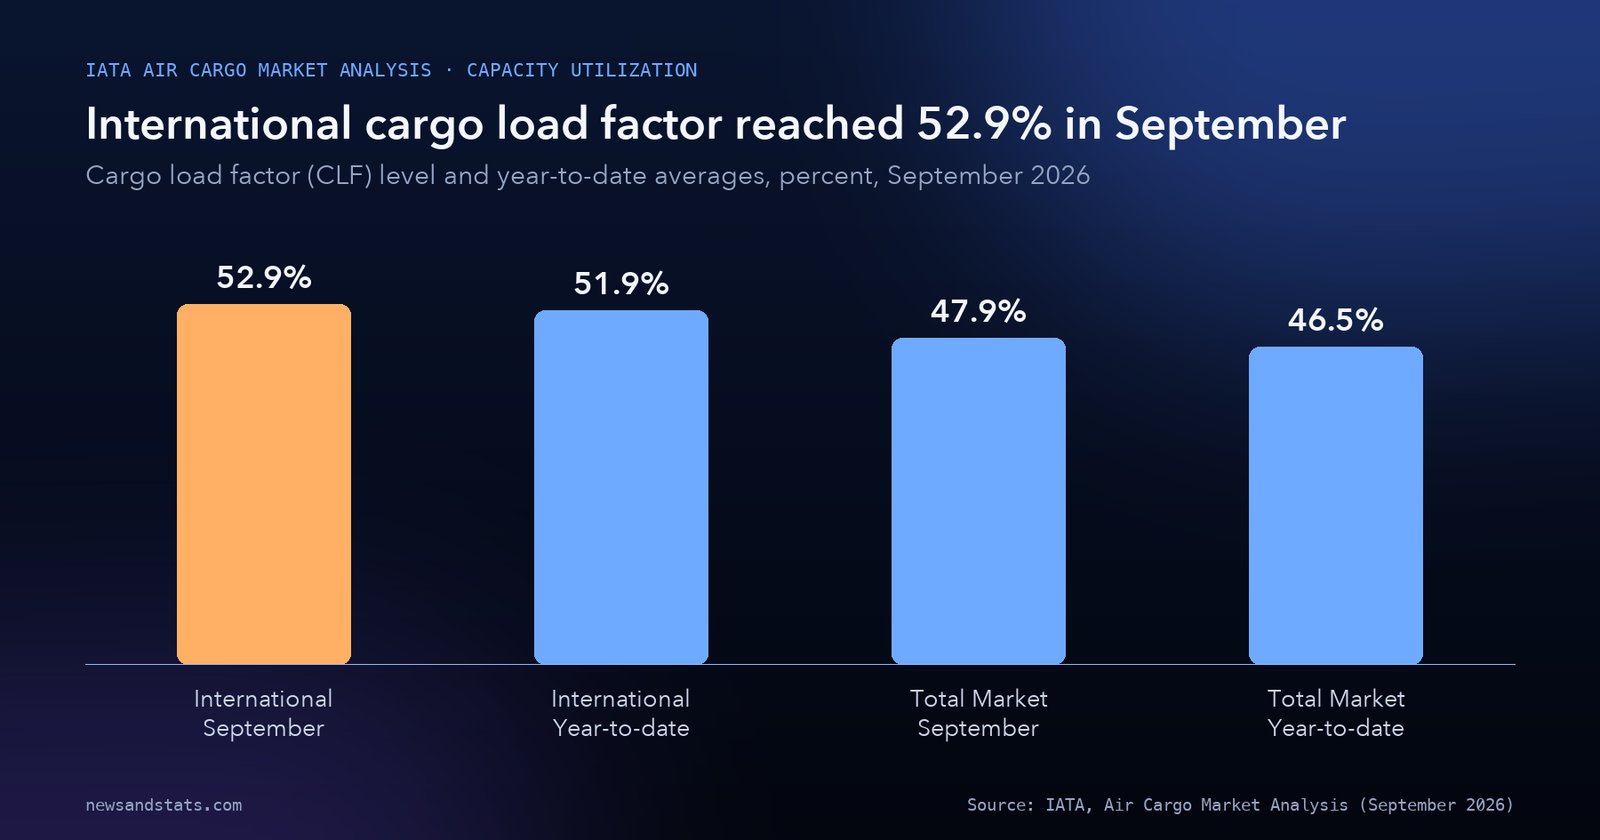
- Rising load factors: The global cargo load factor (CLF) climbed by 2.2 percentage points to reach 47.9%.
- International utilization: On international long-haul routes, the cargo load factor rose by 2.6 percentage points to reach 52.9%.
- Year-to-date benchmarks: Over the January–September period, global CLF averaged 46.5% (+1.5 percentage points), while international CLF averaged 51.9% (+1.7 percentage points).
Source: IATA, Air Cargo Market Analysis, Capacity and load factor metrics.
Capacity additions were distributed unevenly across regional carrier fleets:
- Asia Pacific and Middle East: Carriers in these two regions provided almost all additional lift, contributing 59.6% and 34.9% of net industry capacity growth, respectively. Summing these two figures reveals that Asia Pacific and Middle East airlines supplied 94.5% of all new cargo capacity added to the global market in September (my calculation).
- North America: Capacity grew by a modest 0.8%, recovering from an annual contraction in August.
- Europe: European carriers actively reduced capacity by 1.6% year-on-year, exercising supply restraint in a growing demand market.
- Latin America vs Africa: Latin American airlines expanded capacity by 7.6%, whereas African carriers contracted available lift by 1.2%.
As observed in our examination of the global tourism slowdown, passenger airline schedules dictate roughly half of global air cargo capacity via wide-body passenger belly holds. When international passenger route networks stagnate or trim flights due to rising jet fuel surcharges, belly-hold freight capacity is automatically removed from the market, tightening the supply available to industrial freight forwarders.
6. The macroeconomic tailwind: export orders and factory output
The surge in global air freight is anchored in solid real-economy manufacturing data rather than temporary inventory hoarding.
According to global purchasing managers’ index (PMI) telemetry cited in the IEA report:
- Five-year survey highs: Global manufacturing output and new export-order indexes both climbed to their highest levels in more than five years in September.
- Sustained industrial expansion: Global factory production expanded by 3.6% above its year-earlier level, marking the 42nd consecutive month of continuous industrial growth.
- Cross-border trade growth: The CPB World Trade Monitor recorded its fifth consecutive monthly volume increase in August, standing 6.9% above year-earlier levels with monthly volume gains of 0.6%.
This macroeconomic strength aligns with the findings in our analysis of the global trade outlook and merchandise expansion, which demonstrated that high-value merchandise trade has exhibited remarkable resilience against geopolitical friction. When global factory output expands at a 3.6% annual clip, just-in-time supply chains rely on air cargo networks to prevent factory assembly line shutdowns.
What to watch
- The Q4 holiday peak freight rate spike: Monitor whether dynamic jet fuel surcharges push trans-Pacific spot air cargo rates to new calendar-year records during the November-December retail peak.
- Middle East airspace corridor normalization: Track whether commercial airlines restore direct routing through Gulf flight corridors or maintain costly oceanic bypasses heading into early 2027.
- Trans-Pacific belly-hold capacity: Watch whether passenger carriers add seasonal trans-Pacific capacity, relieving pressure on dedicated freighter fleets.
- Airline third-quarter financial disclosures: Follow financial earnings releases from major cargo operators (FedEx, UPS, Atlas Air, Lufthansa Cargo, Cathay Cargo) to evaluate whether yield gains offset the 103.4% jet fuel cost surge.
- Manufacturing PMI export order persistence: Observe whether global new export orders maintain their five-year highs into the first quarter of 2027 or soften as interest rate cycles mature.
The bottom line
The global air freight sector concluded the third quarter of 2026 on a trajectory of rapid volume expansion, propelled by an 8.6% surge in international traffic, strong semiconductor demand across the Pacific, and maritime supply chain diversions. However, this 7.7% volume boom is unfolding against severe operational headwinds: aviation jet fuel costs surged 103.4% over twelve months, outstripping cargo yield gains (+25.9%) by nearly four to one. With international cargo load factors reaching 52.9% and Middle East transit corridors remaining impaired, air freight enters the fourth-quarter peak under immense margin pressure. For continuous analysis of international transportation and supply chain infrastructure, explore our Industries coverage.
Related reading
- Global Maritime Trade in 8 Numbers: How Chokepoint Rerouting Reshapes Shipping: container shipping rates, Cape of Good Hope diversions, and ocean ton-mile expansion.
- Global Trade Outlook 2026: AI Beats the War: WTO multilateral trade forecasts, services expansion, and cross-border merchandise resilience.
- Who pays for the 2026 energy shock? The numbers, country by country: energy market volatility, refining crack spreads, and fuel subsidy costs.
- The Global Tourism Slowdown of 2026, in 8 Numbers: passenger travel demand, international airline capacity, and cross-border mobility.
- Global Chip Sales Near $1.6 Trillion in 2026: semiconductor trade flows, high-value electronics logistics, and AI server manufacturing.