Global trade hit a record $35 trillion in 2025, yet the path that once allowed developing nations to industrialize and catch up is narrowing. According to UN Trade and Development’s Trade and Development Report 2026, published on 9 October 2026, world output growth is projected to slow from 2.9% in 2025 to 2.6% in 2026, while growth across developing economies decelerates from 4.7% to 4%. Beneath those headline averages, governments are deploying export controls, subsidies, and investment screening to secure semiconductors, artificial intelligence infrastructure, and clean-energy supply chains. Together, the report’s figures map the geoeconomics of development: a world where Asia still drives 59% of global growth, but most of the Global South risks being locked into low-margin raw-material extraction while rich nations capture around 70% of strategic investment.
1. Global Growth Slows to 2.6%, With Asia Driving 59%
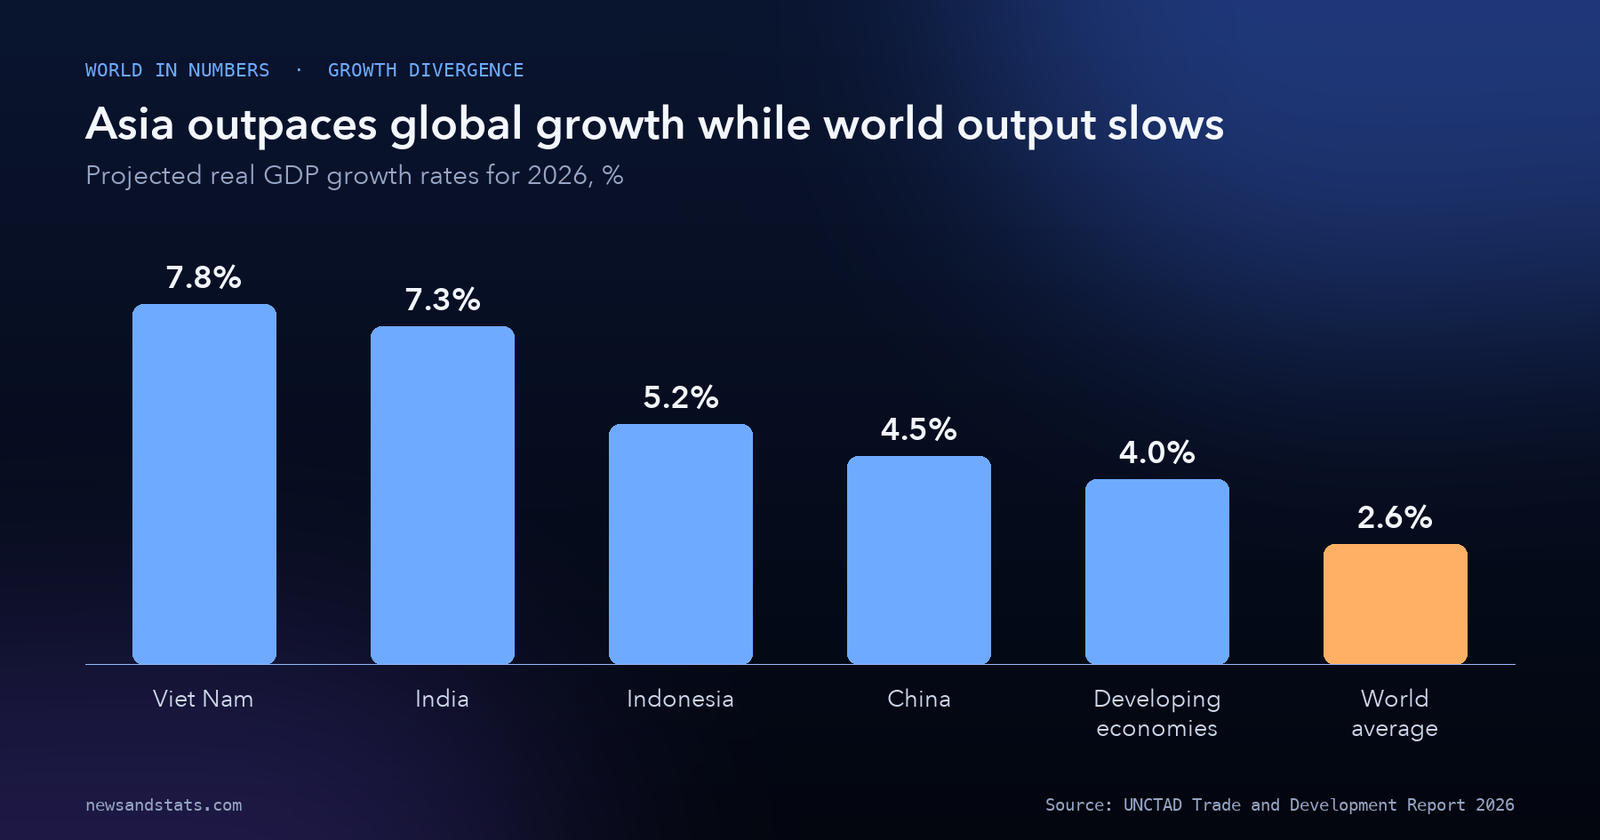
Headline resilience masks sharp geographic divergence. In its official press release, UNCTAD projects global output growth at 2.6% in 2026, down 0.3 percentage points from 2.9% in 2025 (my calculation), before edging up to 2.7% in 2027. Developing economies as a group are forecast to grow 4% in 2026, down from 4.7% in 2025. That slower global trajectory aligns with the broader macro picture across World in Numbers, where energy costs and trade friction weigh heavily on non-Asian importers, echoing themes from the IMF’s October 2026 outlook.
Source: UNCTAD, Trade and Development Report 2026, Resilience and its limits.
Asia accounts for 59% of global growth in 2026. Among the region’s largest economies, UNCTAD projects India to expand by 7.3%, Indonesia by 5.2%, and China by 4.5%. Several smaller and mid-sized Asian economies post even faster projected rates, including Kyrgyzstan (8.8%), Uzbekistan (7.9%), Viet Nam (7.8%), Mongolia (7%), and Tajikistan (6.6%).
2. Eight Asian Economies Outpace the Developing World 2-to-1
The gap between Asia’s manufacturing hubs and the rest of the developing world has been widening for more than three decades. In a companion UNCTAD analysis published on 16 October 2026, economists tracked a group of eight Asian economies—China, India, Indonesia, Malaysia, Singapore, Viet Nam, Hong Kong SAR (China), and Taiwan Province of China—against all other developing economies. In the early 1990s, the eight Asian economies averaged output per person of about 4% of the developed-economy average, compared with about 10% for the remaining developing economies.
By 2026, those positions have reversed. The Asian group’s average output per person is projected to reach 18% of the developed-economy average, while the rest of the developing world has edged down to about 9%—leaving the Asian group roughly twice as high per person. Even during the 2003–2013 commodity boom, when both groups narrowed the income gap, the eight Asian economies closed it almost four times as fast. Since the mid-2010s, convergence has stalled across most of the developing world, reinforcing the structural dynamics we tracked when comparing India versus China.
3. Developed Economies Capture 70% of Strategic FDI
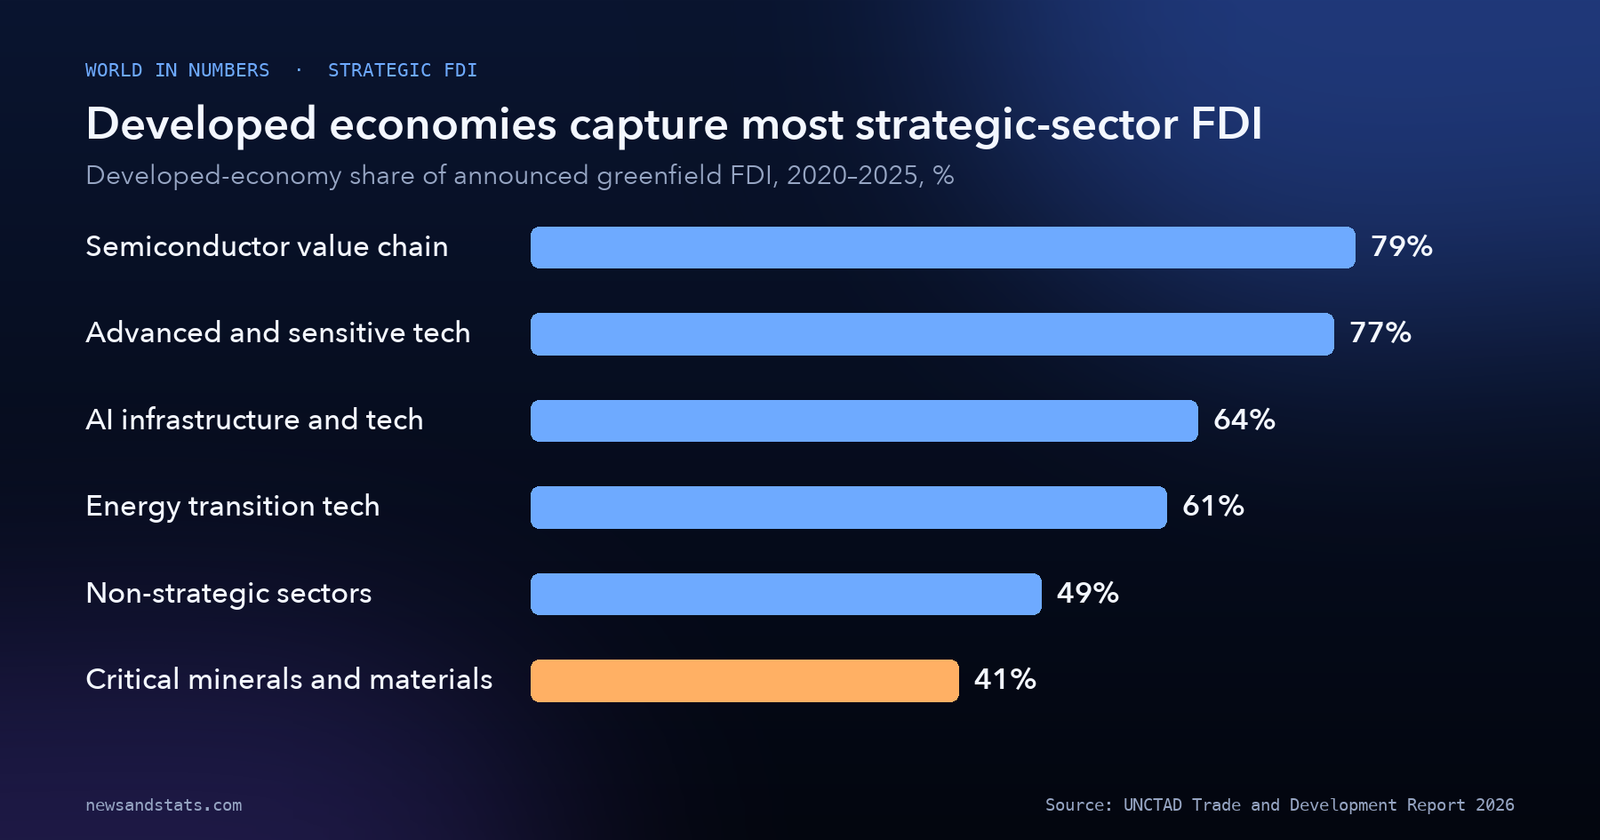
The geoeconomics of development is clearest in where multinational companies are building new factories and facilities. Between 2020 and 2025, strategic sectors—semiconductors, AI infrastructure, clean-energy technologies, and advanced sensitive tech—rose from 16% of announced greenfield foreign direct investment (FDI) in 2020 to 44% in 2025. In non-strategic industries, new projects are split almost evenly: 49% go to developed economies and 51% to developing economies.
Source: UNCTAD, Trade and Development Report 2026, Development in the age of geoeconomics.
In strategic sectors, however, developed economies capture around 70% of announced greenfield investment value. They attract 79% of FDI in the semiconductor value chain, 77% in advanced and sensitive technologies, 64% in AI infrastructure and related technologies, and 61% in energy-transition technologies and services. Developing economies lead in only one strategic category: critical minerals and strategic materials, where they capture 59% of announced FDI (with developed economies at 41%). Even within the Global South, strategic-sector FDI is lopsided: Asia captured $561 billion between 2020 and 2025—roughly three-quarters of the developing-economy total—compared with $126 billion for Latin America and $71 billion for Africa. In Africa and Latin America, critical minerals and energy-transition projects accounted for 54% of strategic greenfield FDI, versus 38% in developing Asia, where semiconductors alone drew 20% alongside surging global chip sales.
4. Global Manufacturing Tariffs More Than Doubled to 4.7%
Trade in goods and services grew 4.4% in real terms in 2025 and is projected to expand by about 4% at constant prices in 2026, yet market access is growing more expensive and politically selective. UNCTAD’s report overview shows that the global trade-weighted average tariff on manufactured goods more than doubled from 1.9% in 2024 to 4.7% in 2025. Over the same period, agricultural tariffs rose from 5.7% to 6.7%, while natural-resource tariffs held flat at 0.8%.
| Trade or policy indicator | Prior period | Latest period | Direction |
|---|---|---|---|
| Global average manufacturing tariff | 1.9% (2024) | 4.7% (2025) | +2.8 percentage points |
| Global average agriculture tariff | 5.7% (2024) | 6.7% (2025) | +1.0 percentage point |
| Global average natural-resource tariff | 0.8% (2024) | 0.8% (2025) | Unchanged |
| China–United States bilateral trade | 2024 baseline | >20% lower (2026) | Contracted |
| Non-Asia South–South trade growth | 8% annual (2019–2024) | 2.5% (2025) | Slowed |
| Africa-to-Europe active export links | 2019 baseline | +83 links (2025) | Expanded |
Source: UNCTAD, Trade and Development Report 2026, Selective fragmentation: The new geography of trade.
Geography is shifting alongside tariffs. Bilateral trade between China and the United States has fallen by more than 20% since 2024, while East Asia has expanded trade with both China and North America. Outside Asia, trade growth among developing economies slowed sharply from 8% a year in 2019–2024 to 2.5% in 2025. Still, new corridors are opening: from 2019 to 2025, Africa added 83 active bilateral merchandise export relationships (flows above $1 million) with Europe—the largest corridor gain worldwide—and 74 within Africa, reinforcing patterns seen in the global trade outlook.
5. AI Hardware Drives 42% of Goods Trade Growth, but Profit Takes 68%
AI-related hardware has become the primary engine of merchandise trade. UNCTAD finds that AI-related goods—including chips and data-center servers—accounted for roughly one-sixth of global goods trade by value in 2025 and drove 42% of its growth. That narrow base creates financial vulnerability if AI capital spending cools, and it concentrates economic returns far more tightly than traditional manufacturing.
Source: UNCTAD, Trade and Development Report 2026, Resilience and its limits.
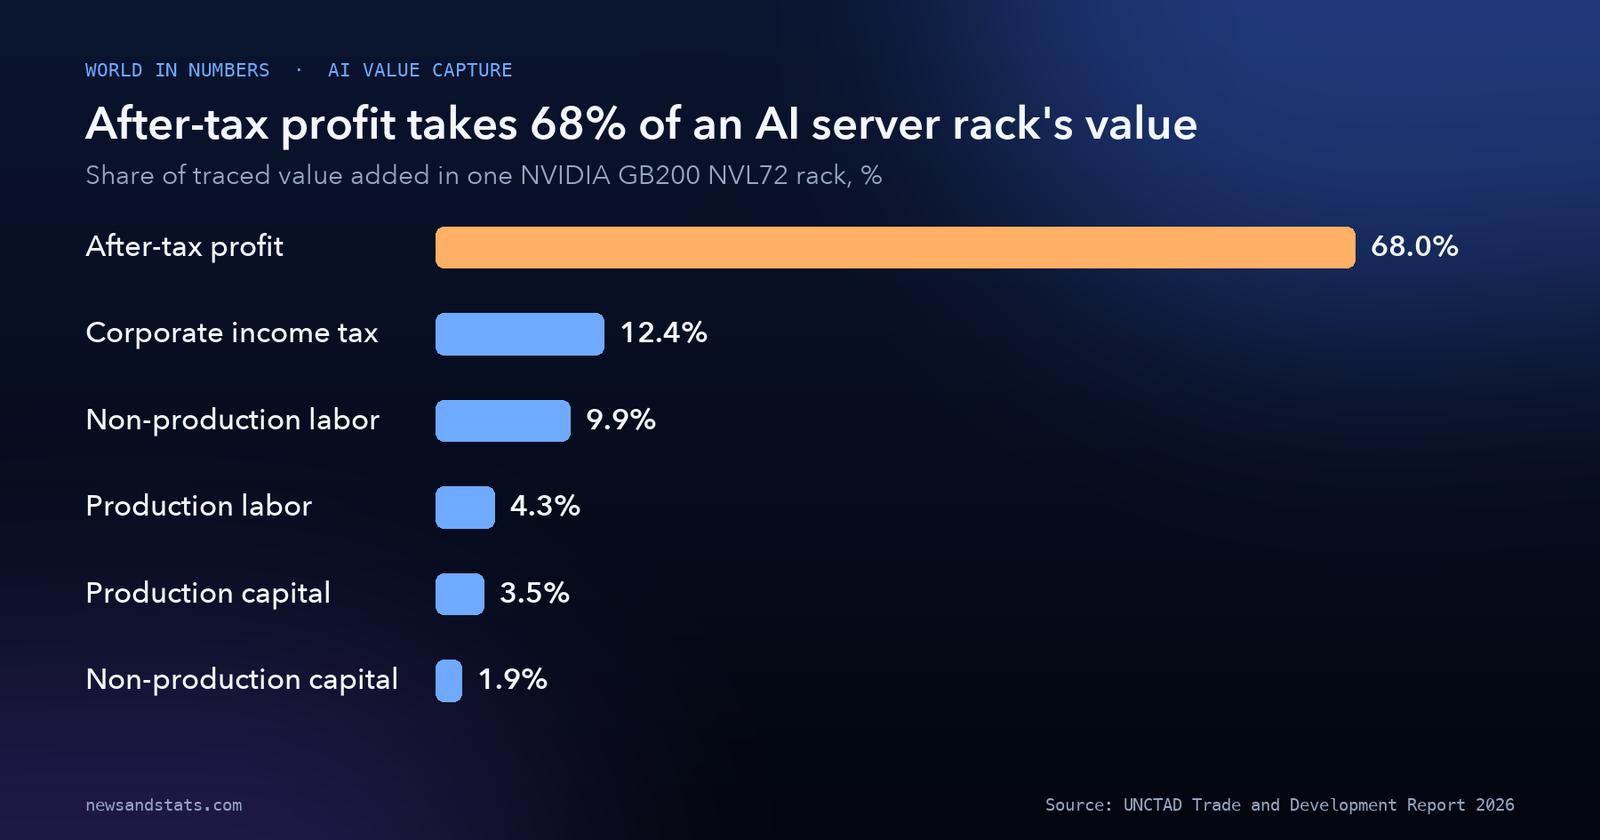
To measure who actually benefits, UNCTAD traced more than 87% of the total value added—about $3.3 million—in a single NVIDIA GB200 NVL72 AI server rack. After-tax profit accounts for 68.0% of traced value added, with one chip designer capturing most of it, and four supplier groups capture 82% of total value. Corporate income tax accounts for 12.4%, non-production capital 1.9%, and production capital 3.5%. Production workers receive just 4.3%, while non-production workers such as engineers and managers receive 9.9%—meaning all workers combined receive less than 15% (14.2%, my calculation). For developing economies, assembling hardware without owning intellectual property yields only thin margins.
6. Africa Mines 73% of Cobalt Yet Retains Less Than 1% of Green Value
Raw-material extraction shows the same value-capture gap. The Democratic Republic of the Congo produced about 73% of the world’s mined cobalt in 2025, yet domestically owned producers accounted for just 1% of its output, down from 9% in 2020 and 20% in 2022, with multinational firms accounting for the remaining 99% in 2025. Across green supply chains as a whole, Africa retains less than 1% of total value.
Even countries that have moved into electronics assembly face steep domestic value-added limits. UNCTAD reports that Mexico’s technology and electronics exports more than doubled from $45 billion in 2000 to $110 billion in 2025, yet 70.7% of that value was created abroad. Malaysia has built a major semiconductor hub where electrical and electronic shipments make up 44.3% of merchandise exports, but the highest-value design and fabrication stages remain concentrated in established powerhouses. As seen in the rare earth supply chain, upstream resource concentration rarely translates into downstream pricing power without domestic industrial depth.
7. Brent Crude Jumped Past $110, Hitting Import-Dependent Nations Hardest
Geoeconomic fragmentation collided with a sharp energy shock in 2026. Following the outbreak of conflict in the Middle East, Brent crude jumped from $70 to over $110 per barrel within weeks. Between 23 February and 31 August 2026, domestic dollar-denominated diesel prices surged 82.7% in Nigeria, 73.6% in Lebanon, 66.7% in Peru, and 66.3% in Guatemala, while gasoline prices climbed 50.7% in Myanmar and 49.8% in the United Arab Emirates.
Net energy importers carry the heaviest macroeconomic burden. Using UN Comtrade data for 2023, UNCTAD notes that net imports of mineral fuels, oils, and distillates equaled 25.1% of GDP in Cabo Verde, 19.1% in Lebanon, 16.1% in Mauritania, and 15.7% in Liberia—leaving little fiscal room when global prices spike, a vulnerability detailed in our breakdown of the 2026 energy shock. At the same time, UNCTAD highlights a structural shift in power economics: since 2024, renewables have been cheaper than the least expensive newly installed fossil-fuel alternative in more than 90% of cases, strengthening the case for domestic clean power to curb import bills.
8. Development Aid Drops 6.9% as Portfolio Volatility Doubles
Shrinking external finance compounds the pressure on developing-country budgets. UNCTAD projects net official development assistance (ODA) from OECD Development Assistance Committee donors to fall 6.9% in 2026—a third consecutive annual decline—pushing aid toward 0.23% of donor gross national income, far below the 0.7% target. Meanwhile, the estimated annual financing gap for the Sustainable Development Goals stands at $4.3 trillion.
Private capital has grown less predictable at the same time. Volatility in non-resident portfolio flows doubled in 2026 compared with the 2014–2025 average, raising borrowing costs when investors pull back. Industrial policy responses reflect those financial constraints: in 2022–2025, developing economies excluding China relied on trade policy for 64% of their industrial policy measures and financial policy for 19%. By contrast, financial policy tools—such as grants and state loans—accounted for 89% of industrial policy measures in China and 85% in the European Union.
What to watch
- AI hardware demand durability: Whether AI-related goods sustain their 42% contribution to global goods trade growth or slow down if hyperscaler capital spending moderates.
- Strategic FDI diversification: Whether developing regions outside Asia increase their share of non-mineral strategic greenfield investment beyond the current $126 billion in Latin America and $71 billion in Africa.
- Regional payment and trade pacts: Whether the Pan-African Payment and Settlement System connects its target of 42 currencies and whether full AfCFTA implementation stays on track toward its projected 7% regional income gain and 30 million poverty-reduction estimate by 2035.
- Donor aid budgets in 2027: Whether OECD DAC members stabilize ODA after three straight annual declines culminating in the 6.9% drop projected for 2026.
- Portfolio flow stability: Whether non-resident capital-flow volatility retreats from double its 2014–2025 average as energy prices normalize.
The bottom line
UNCTAD’s Trade and Development Report 2026 shows that global trade volume is still expanding at 4%, yet the geoeconomics of development is sorting economies into winners and price-takers. Eight Asian economies are pulling ahead at twice the per-capita income ratio of the rest of the developing world, while developed economies capture around 70% of strategic greenfield FDI and corporate profits take 68.0% of traced AI server value. With manufacturing tariffs more than doubling to 4.7%, development aid falling 6.9%, and capital-flow volatility doubling, raw-material exports alone will not close the gap. Building local suppliers, domestic clean energy, and regional payment networks will determine which developing economies climb the value chain and which remain stuck at the bottom.
Related reading
- Global Trade Outlook 2026: AI Beats the War: Tracks how AI-enabling goods offset geopolitical trade disruptions in 2026.
- India vs China: the economic gap in 10 numbers: Compares Asia’s two largest economies across growth, manufacturing, and demographics.
- Who pays for the 2026 energy shock? The numbers, country by country: Breaks down fuel import bills and inflation exposure across major economies.