Global innovation spending is back in expansion mode, yet the divide between top-tier hubs and emerging economies is hardening. According to the World Intellectual Property Organization’s Global Innovation Index 2026, which ranks 139 economies and maps the world’s top 100 science and technology clusters, Switzerland holds first place for a 16th consecutive year with a score of 66.7. Beneath that continuity at the top, venture capital has concentrated heavily into artificial intelligence—rising from 53% of global deal value in 2025 to 77% in the first half of 2026—while middle-income climbers face what WIPO calls an innovation “glass ceiling” around the top 40.
1. Switzerland Leads 139 Economies for a 16th Year
Stability defines the upper tier of the Global Innovation Index 2026. Switzerland (66.7), Sweden (63.2), and the United States (62.3) remain the top three innovation economies, followed by the Republic of Korea (61.4) and Singapore (61.0). In WIPO’s GII 2026 results, no new economy entered the top 15 this year, and Europe accounts for 14 of the top 25 leaders, with the Kingdom of the Netherlands rising to 7th (58.4) and Austria advancing to 18th (50.2).
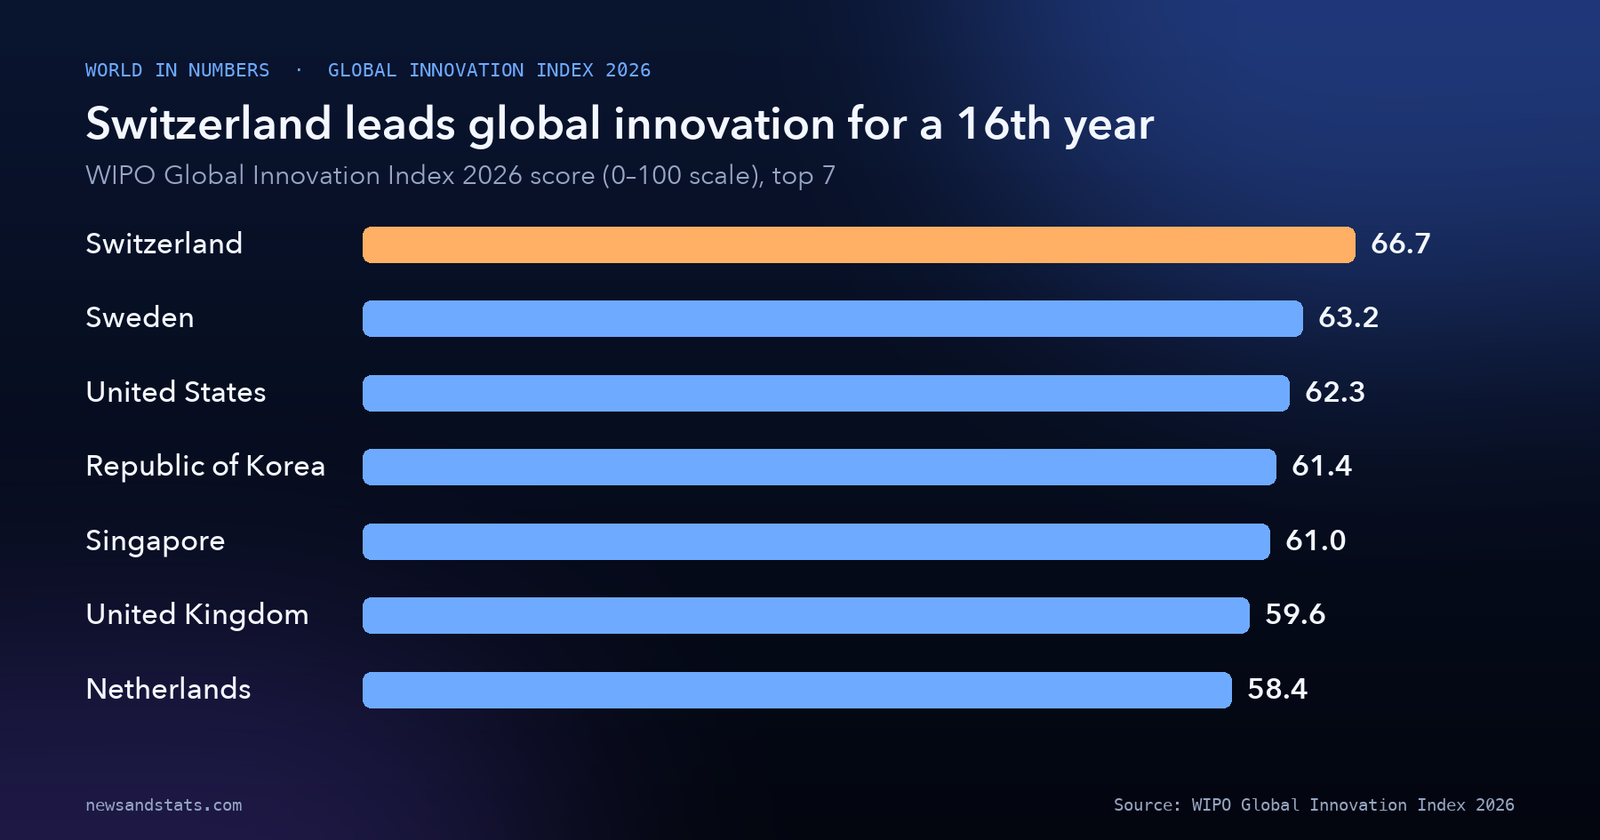
Source: WIPO, Global Innovation Index 2026, Global Innovation Index 2026 rankings.
Asia holds five spots in the top 25: the Republic of Korea (4th), Singapore (5th), China (10th), Japan (12th), and Hong Kong, China (14th). Just below the top 15, mature systems staged notable rebounds, with Canada rising to 16th (51.1), Australia returning to the top 20 at 20th (49.6), and New Zealand climbing to 24th (46.4), while the United Arab Emirates entered the top 25 at 25th (46.4). Across World in Numbers, few global scorecards show this level of persistence at the frontier: over 80% of GII 2026 data points reflect 2024–2026 performance.
2. Only One Middle-Income Economy Breaks Into the Top 30
Middle-income economies have climbed steadily since 2013, yet almost all hit a structural ceiling before reaching the top tier. China ranks 10th overall with a score of 57.0 and remains the only middle-income economy inside the top 30. Malaysia ranks 34th (41.8), India leads lower middle-income economies at 38th (40.1), and Viet Nam (43rd, 37.7), Thailand (44th, 37.6), Türkiye (45th, 37.5), the Philippines (52nd, 33.8), Morocco (54th, 32.8), and Indonesia (55th, 32.7) follow in the upper half of the index.
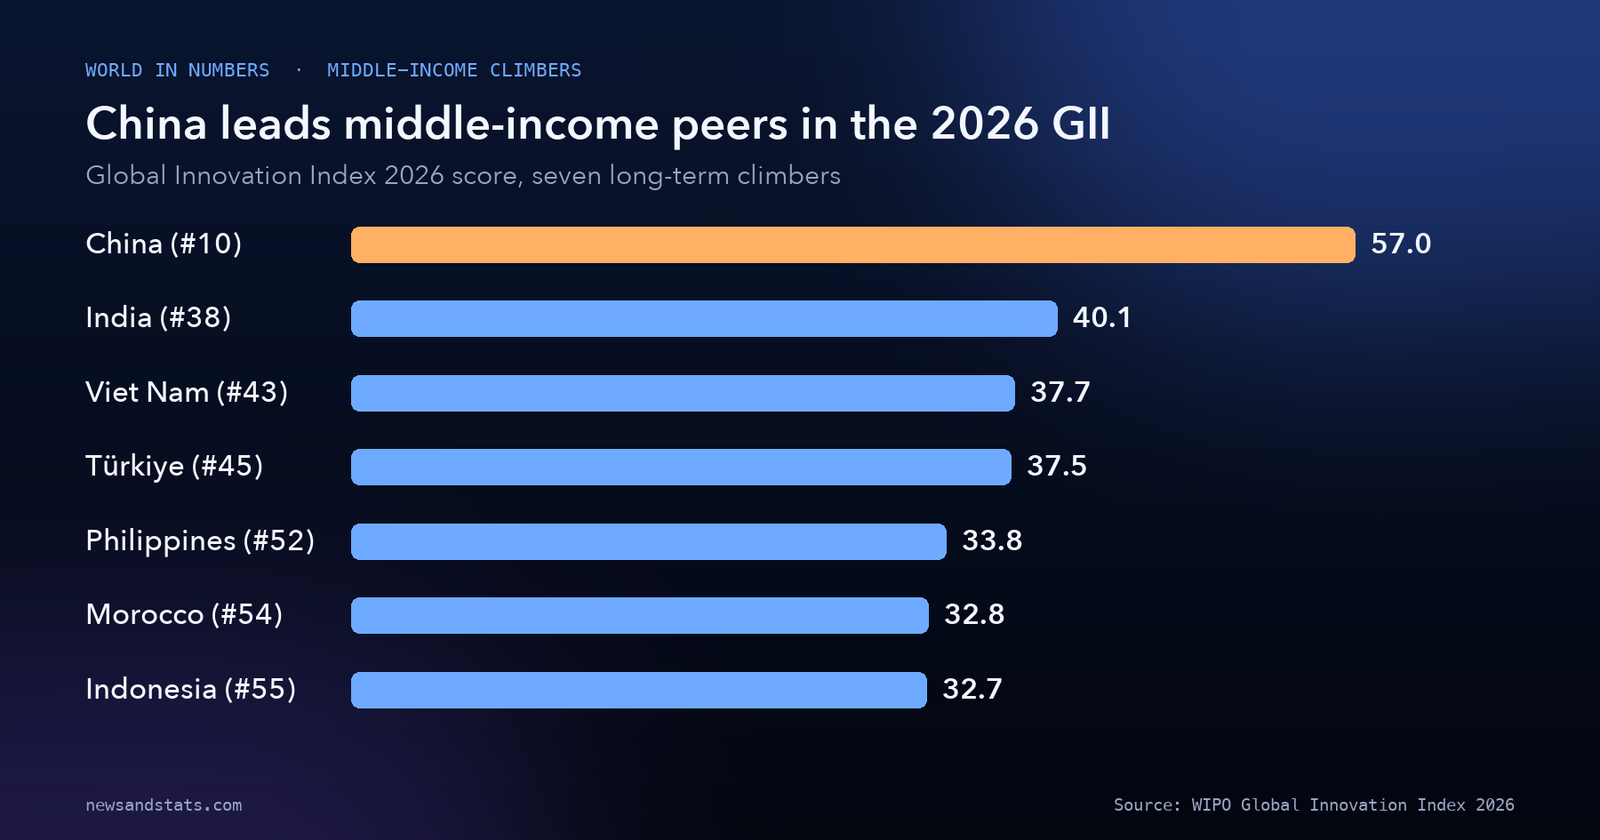
Source: WIPO, Global Innovation Index 2026, Who is gaining momentum?
WIPO benchmarks the seven long-term middle-income climbers against high-income medians across 25 indicators. China reaches high-income levels in 21 of 25 indicators and ranks 5th in innovation outputs versus 22nd in inputs. The other six climbers—India (25th in outputs vs. 49th in inputs), Viet Nam (35th vs. 54th), Türkiye, the Philippines (49th vs. 69th), Morocco (46th vs. 76th), and Indonesia—converge fastest in startup finance, exports, and intellectual property, while trailing in university research, scientific articles, and business R&D. Indonesia, for instance, ranks 12th in startup and scaleup finance yet spent just 0.3% of GDP on R&D in its latest available data (2020), with only 0.02% of GDP performed by business. That contrast highlights the structural gap seen when comparing India versus China across industrial and research capacity.
| Economy | Overall GII rank | GII score | Income group | Years as overperformer (2011–2026) |
|---|---|---|---|---|
| China | 10 | 57.0 | Upper middle-income | Not listed (top 10) |
| India | 38 | 40.1 | Lower middle-income | 16 |
| Viet Nam | 43 | 37.7 | Lower middle-income | 16 |
| Thailand | 44 | 37.6 | Upper middle-income | 12 |
| Philippines | 52 | 33.8 | Lower middle-income | 8 |
| Brazil | 53 | 33.5 | Upper middle-income | 6 |
| Morocco | 54 | 32.8 | Lower middle-income | 8 |
| Indonesia | 55 | 32.7 | Upper middle-income | 5 |
Source: WIPO, Global Innovation Index 2026, Table 1 and Table 2.
Even below the top 30, 21 economies innovate above expectations for their GDP per capita, four more than in 2025. India and Viet Nam hold the longest streak at 16 consecutive years, followed by the Republic of Moldova (15 years, returning at 68th), Rwanda (14 years, 96th), and Ukraine (14 years, 67th). Bhutan joined the index for the first time at 74th (28.9) and immediately qualified as an overperformer, while 39 economies performed below expectations, including 14 in Latin America and the Caribbean.
3. Global R&D Reaches $3.4 Trillion as AI Captures 77% of VC
Research spending and risk capital tell two different stories in 2026. Global R&D expenditure grew 4.7% in real terms in 2024—the year China’s total R&D spending moved slightly ahead of the United States—and WIPO projects global R&D to reach $3.4 trillion in 2026 (in PPP-adjusted constant 2020 prices), holding near 2% of GDP after growing 3.3% in 2025 and a projected 3.6% in 2026. Top corporate R&D spenders hit a record $1.5 trillion in 2025, up 5.8% in real terms from 2024, while global scientific publications topped 2.4 million articles, up 6.9%.
Venture capital, by contrast, is surging in dollars while narrowing in breadth. Total VC deal value jumped 27.9% in 2025 to $510 billion, its strongest annual gain since 2021, even as global VC deal counts fell 1.4%—a fourth consecutive annual decline. AI accounted for 53% of global VC deal value in 2025 and surged to 77% in the first half of 2026 (as of July 2026 PitchBook data). Regionally, Northern America is estimated to capture 72.6% of global VC deal value in 2026, compared with 15.9% for Asia, 9.9% for Europe, and 1.6% for the rest of the world, though African startups still raised about $3.2 billion in 2025, up roughly 40% from 2024. That concentration mirrors the OECD AI divide, where capital and compute cluster in a small set of ecosystems.
4. Deep Science Startups Reach $7.6 Trillion in Value
This year’s special theme in the GII 2026 results introduces the Dealroom–WIPO Deep Science Startup Tracker, mapping ventures in life sciences, semiconductors, robotics, space, energy, and advanced materials. Since 2000, more than 30,000 deep science startups have been founded—9.5 times the 2010 count, representing about 16% compound annual growth. Their share of all venture-backed startups hit a 15-year high of 16% in 2025, and their combined valuation reached $7.6 trillion, up 23% from 2024.
Funding is shifting toward hardware-heavy frontier fields. Deep science ventures attracted $122 billion in VC in 2025; excluding megadeals above $250 million, they captured 36.5% of global VC funding, nearly double their 2015 share, with momentum tilting from life sciences toward semiconductors and robotics. The United States leads with 12,752 deep science firms, ahead of China (3,466) and the United Kingdom (2,133), though China’s cohort grew 138% between 2020 and 2025 versus 30% for the United States, and Estonia grew fastest overall at 313%. Universities remain the primary launchpad: over 40% of energy and life sciences ventures founded since 2010 spun out of academic research, and US institutions including Harvard, MIT, and Stanford account for 15 of the top 20 spinouts. Still, scaling bottlenecks persist outside core hubs: in Latin America, 72% of science-intensive startups stall at seed stage and only 19% reach Series A, echoing capital-concentration trends highlighted in the Stanford AI Index 2026.
5. Deep Science Startups Patent at 3.2 Times the Rate of Peers
Because deep science ventures often spend years in laboratories before generating sales, intellectual property serves as their primary verifiable asset. WIPO finds that 50% of deep science startups hold patents, compared with 15.4% of other startups—a ratio of 3.2 times (my calculation) that has widened over the past decade. Patent adoption climbs with venture maturity, rising from about 43% at seed stage to 69% at late stage, with the Republic of Korea, Finland, and Japan posting the highest national adoption rates.
In middle-income economies, a handful of frontier firms account for large patent portfolios. Across East Asia’s top 20 deep science patent holders, 19 are Chinese entities, led by ChangXin Memory Technologies (launched in 2016) with 8,311 patent families. Elsewhere in the middle-income world, Malaysia’s Lemonex holds 49 patent families, India’s Qure AI holds 37, El Salvador’s Axonne holds 13, and Brazil’s HiLab and South Africa’s LIQID Medical hold 10 each. Meanwhile, international patent applications filed under the Patent Cooperation Treaty (PCT) rose just 0.7% globally in 2024–2025, a second year of modest growth compared with the surge in specialized domains tracked in our look at generative AI patents.
6. China and the US Host 45 of the Top 100 Innovation Clusters
Metropolitan density continues to anchor global invention. WIPO’s 2026 ranking of the world’s top 100 innovation clusters—measured by inventor filings, scientific authors, and venture capital deals—places Shenzhen–Hong Kong–Guangzhou first for a second consecutive year, followed by Tokyo–Yokohama (2nd), San Jose–San Francisco (3rd), Beijing (4th), and Seoul (5th). China hosts 25 of the top 100 clusters and the United States hosts 20, giving the two countries 45 clusters combined (my calculation) and marking a fourth straight year at the top of the cluster count. Germany ranks third with 7 clusters (led by Munich at 28th), followed by India (led by Bengaluru at 25th) and the United Kingdom (led by London at 8th) with 4 clusters each.
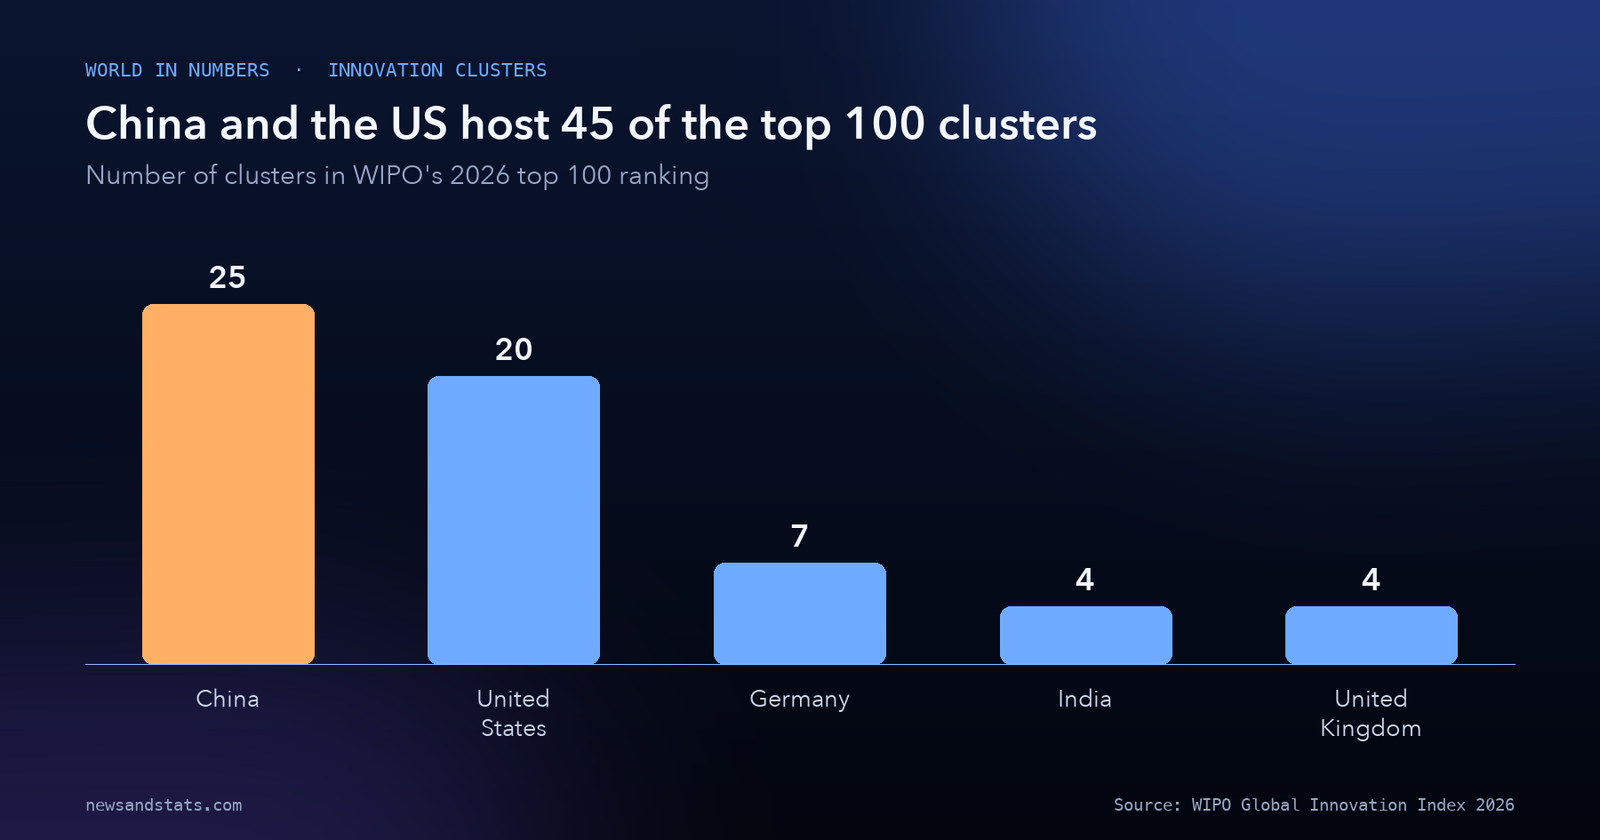
Source: WIPO, Global Innovation Index 2026, GII 2026 Ranking of World’s Top 100 Innovation Clusters.
Measuring innovation intensity per capita reshuffles the list. San Jose–San Francisco (1st) and Cambridge, United Kingdom (2nd) lead in intensity, while Ningde, China jumped 24 places in overall rank (from 99th to 75th) and reached 3rd globally in intensity, driven by battery maker CATL. Boston–Cambridge (4th) and Oxford (5th) complete the top five by intensity, and only San Jose–San Francisco and Boston–Cambridge sit in the global top 10 on both scale and intensity. Riyadh entered the top 100 at 92nd, joining middle-income hubs such as São Paulo (49th), Istanbul (56th), Tehran (65th), Mexico City (82nd), Cairo (86th), and Kuala Lumpur (90th), reinforcing the metropolitan pull examined in the global AI talent race.
7. Ten Countries Attract 58% of Greenfield R&D and High-Tech FDI
To track forward-looking cross-border investment rather than backward-looking mergers, WIPO introduced a new indicator in 2026: greenfield R&D and high-tech foreign direct investment (FDI), built with FT Locations fDi Markets. In 2025, companies announced nearly 6,000 such projects worldwide—1,201 R&D projects and 4,769 high-tech projects—representing roughly one-third of all 16,500 greenfield projects recorded globally.
That capital flows through tight corridors. The top 10 destination economies attracted 58% of all R&D and high-tech greenfield projects, led by the United States, India, and the United Arab Emirates. On the outward side, the top 10 source economies generated 70% of all announcements, led by the United States (originating one in four projects worldwide), Germany, and the United Kingdom. Sixteen economies qualify as “global investment hubs” above the world average on both inflows and outflows—14 high-income economies plus China and India—while 14 “investment magnets” draw heavy inflows with minimal outflows, led by Mexico (188 inbound vs. 6 outbound projects), Saudi Arabia (149 vs. 19), Poland (119 vs. 19), and Brazil (111 vs. 36).
8. Technology Costs Keep Falling, Even as Renewables Tick Up
Beneath national rankings, WIPO’s Global Innovation Tracker shows technology adoption expanding across every measured category in 2025, though mostly slower than its 10-year trend. Global electric vehicle (EV) stock reached 75 million, with electric cars representing roughly a quarter of new car sales (up 33.9% in 2024–2025). Industrial robot deployment rose 8.9% to 4.7 million units in 2024, 5G networks now cover 55% of the global population, and high-speed rail networks reached 67,723 kilometers.
Costs and socioeconomic metrics show mixed signals. Average global electric battery prices fell 8.5% to a record low of $108 per kWh (and $84 per kWh in China), while genome sequencing costs dropped 12.1% a year over 2023–2025. By contrast, solar photovoltaic and wind power costs rose for the first time since 2014 (up 0.6% and 2.7% in 2023–2024), a shift with direct implications for clean energy innovation. Meanwhile, global labor productivity rose 2.7% in 2024–2025—exceeding its 10-year trend—the share of the world population living below $3 per day fell to about 10%, and life expectancy reached 73.5 years, even as global warming reached +1.19 degrees Celsius in 2025.
What to watch
- AI share of venture capital in late 2026: Whether AI sustains its 77% share of global VC deal value from H1 2026 or broadens back toward other sectors as deal counts recover from a 1.4% drop.
- Middle-income R&D depth: Whether climbers such as India (38th), Viet Nam (43rd), and Indonesia (55th) raise domestic business R&D and researcher density enough to cross into the top 30.
- Gulf input-to-output conversion: Whether the United Arab Emirates (12th in inputs vs. 42nd in outputs), Saudi Arabia (30th vs. 62nd), and Qatar (33rd vs. 67th) convert infrastructure spending into patents and high-tech exports.
- Deep science graduation rates: Whether emerging ecosystems reduce the 72% seed-stage stall rate seen in Latin America through proof-of-concept and Series A/B funding.
- Clean-tech cost trajectory: Whether solar PV (+0.6%) and wind (+2.7%) cost increases reverse in 2026–2027 as battery prices fall below $108 per kWh.
The bottom line
The Global Innovation Index 2026 shows an innovation economy expanding in total scale—with $3.4 trillion in R&D, $510 billion in venture capital, and $7.6 trillion in deep science startup value—while concentrating sharply by geography and sector. Switzerland leads 139 economies for a 16th year, China and the United States host 45 of the top 100 clusters, and AI captured 77% of venture funding in the first half of 2026. For middle-income climbers and Gulf investors alike, breaking through the top-40 glass ceiling now depends less on assembling exports or buying hardware, and more on building deep university-to-industry research pipelines.
Related reading
- Clean Energy Innovation in 8 Numbers: The Patent Race, Battery Dominance, and the $55 Billion Squeeze: Tracks clean-tech R&D, battery patents, and venture funding pressures.
- Global Generative AI Patents in 8 Numbers: China’s 6-to-1 Lead and the Surge to 37,000 Inventions: Breaks down patent leadership across frontier AI models and firms.
- The OECD AI Divide: Inside the 2026 Digital Economy and Society Outlook: Examines how AI venture capital and firm adoption concentrate across OECD economies.