The geopolitical struggle for leadership in artificial intelligence is frequently framed around specialized semiconductors, power grids, and foundation model training clusters. Yet the ultimate constraint shaping frontier capability is not physical capital—it is the concentration of elite human minds capable of inventing new model architectures, optimizing inference efficiency, and steering autonomous agent systems. According to a landmark empirical investigation by the Carnegie Endowment for International Peace titled Who’s Ahead in the Global AI Talent Race?, the global balance of top machine learning research talent has undergone a historic realignment.
Building upon the pioneering methodology of MacroPolo’s Global AI Talent Tracker, researchers Damien Ma and Binyi Yang analyzed the career trajectories of authors accepted at the prestigious Neural Information Processing Systems (NeurIPS) conference. Evaluating a primary dataset of 10,280 researchers with verified three-stage career histories (undergraduate origin, graduate training, and current employment), the study reveals that China has established a commanding lead as the primary producer of elite AI talent, while the United States continues to rely overwhelmingly on imported foreign-born scientists. Here are the eight numbers that explain the structural shifts across global AI research labs, the changing patterns of brain drain, and the emerging hubs of technical excellence.
1. 57%: China commands the majority of elite undergraduate AI talent
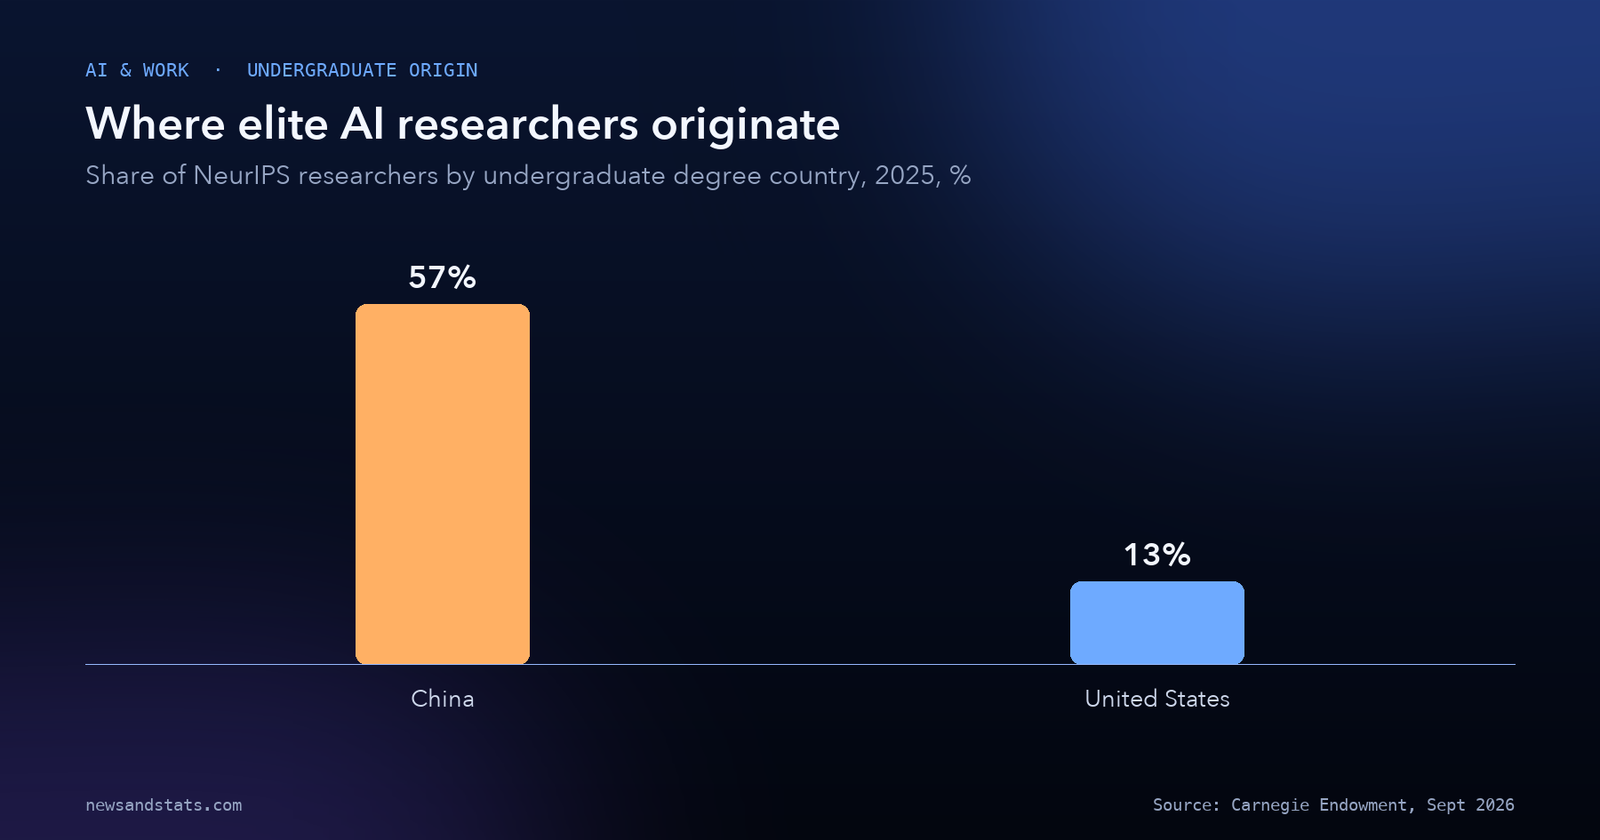
The foundational pipeline of global artificial intelligence expertise is undergraduate STEM education. In the 2025 NeurIPS research cohort, Chinese universities produced 57% of the world’s top machine learning researchers, measured by where authors completed their undergraduate degrees.
This represents an extraordinary demographic surge over a three-year period. In 2022, Chinese undergraduate institutions accounted for 46% of elite AI talent. Between 2022 and 2025, China’s share of undergraduate talent expanded by 11 percentage points.
Source: Carnegie Endowment for International Peace, Who’s Ahead in the Global AI Talent Race?.
By contrast, the domestic American educational pipeline contracted in relative terms. The share of top AI researchers originating from United States undergraduate programs fell to 13% in 2025.
Our calculation: China’s elite undergraduate production in artificial intelligence is now more than four times larger than that of the United States (57% versus 13%).
This educational dominance reflects deliberate, long-term state investments in quantitative STEM curricula, elite computer science academies, and high-performance laboratory funding across Chinese universities. While American institutions dominate foundation model evaluation benchmarks, the underlying mathematical and engineering talent driving those publications is increasingly originating within Chinese borders.
2. 41%: China surpasses the United States as the leading workplace for top researchers
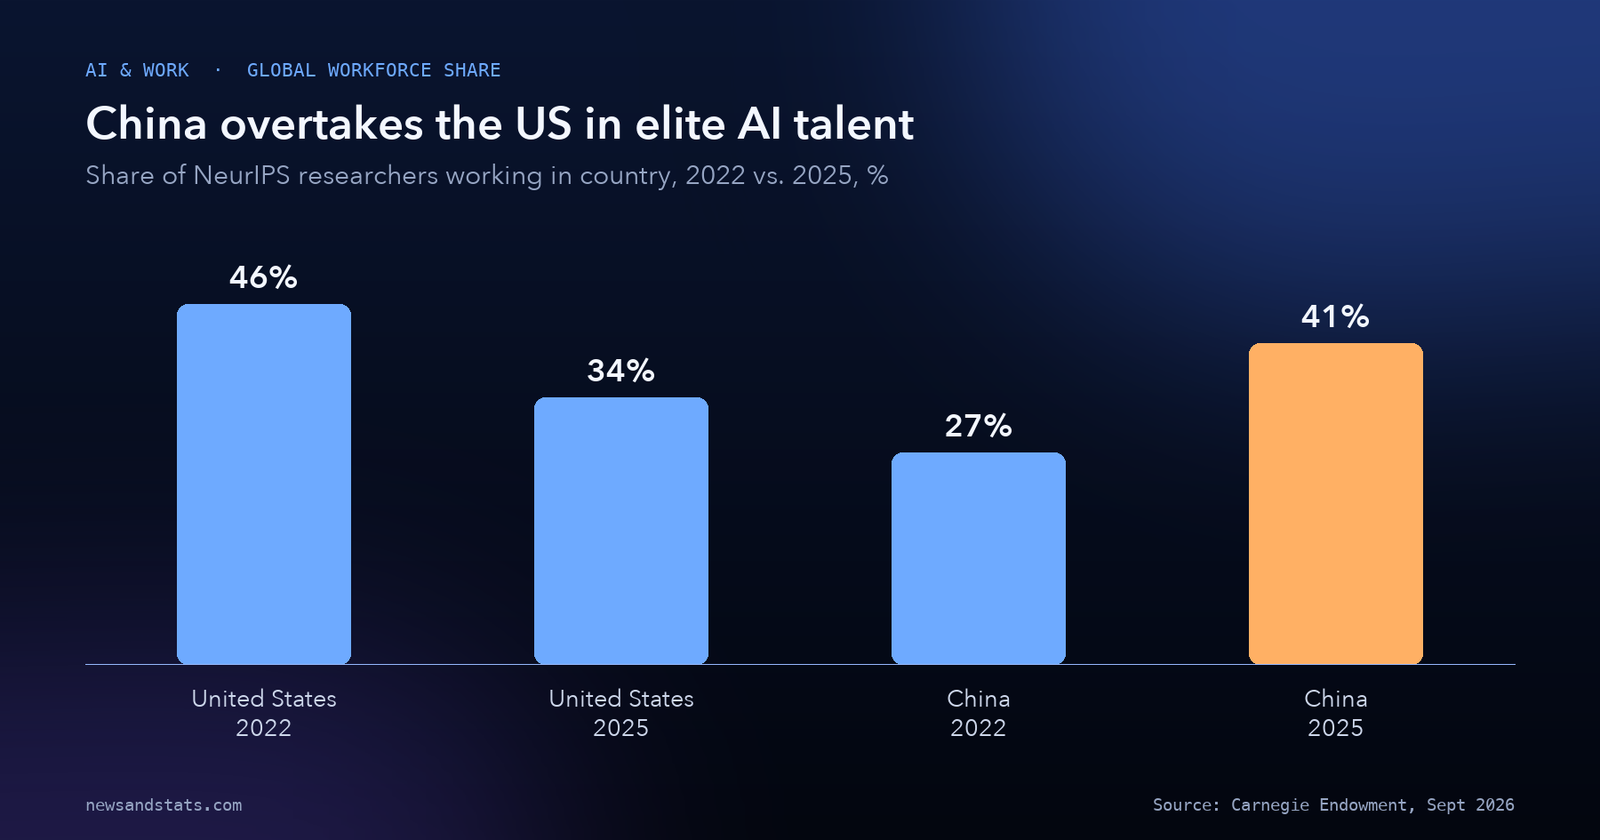
The most consequential inflection point uncovered in the Carnegie study is the location of active employment. In 2025, China surpassed the United States as the single largest national work destination for elite AI researchers, employing 41% of the global cohort.
This milestone marks a complete structural reversal of historical patterns:
- In 2022, the United States employed 46% of top AI researchers, while China employed 27%.
- By 2025, the United States share dropped by twelve percentage points to 34%.
- Over the same window, China’s share of employed researchers climbed by fourteen percentage points from 27% to 41%.
Source: Carnegie Endowment for International Peace, Who’s Ahead in the Global AI Talent Race?.
Our calculation: the seven percentage point lead that China established in 2025 (41% versus 34%) represents a total net shift of 26 percentage points in relative employment concentration since 2022.
This employment flip does not indicate an absolute decline in American research activity, but rather the rapid scaling of domestic Chinese research infrastructure. A booming domestic ecosystem—anchored by corporate labs at Alibaba, Tencent, Baidu, and ByteDance, alongside state-backed institutes—now provides elite graduates with competitive compensation, compute access, and career mobility without requiring relocation abroad. Building on the demographic and educational divergence between India and China, China’s ability to absorb its own scientific graduates is creating a self-sustaining domestic research cluster.
3. +2,145 researchers: The United States remains the world’s primary talent magnet
Despite the contraction in its relative employment share, the United States maintains an unchallenged structural advantage: it remains the world’s preeminent destination for foreign-born scientific talent. In the 2025 cohort, the United States recorded a net talent gain of +2,145 researchers.
To measure international migration flows, Carnegie evaluated “brain gain” versus “brain drain” by calculating the difference between where researchers completed undergraduate studies and where they currently work:
- The United States welcomed 2,300 foreign-educated researchers while losing only 155 American-educated researchers abroad, generating a net gain of +2,145 scientists.
- China experienced a net loss of -1,729 researchers (1,847 left China, while 118 foreign-educated researchers arrived).
- India recorded a net loss of -367 researchers (370 left India, while only 3 foreign-educated researchers arrived).
Other advanced democracies also registered net positive talent inflows, albeit on a much smaller scale. Singapore recorded a net gain of +218 researchers (31 left, 249 arrived), the United Kingdom gained +96 researchers (114 left, 210 arrived), Canada gained +56 researchers (122 left, 178 arrived), Europe recorded a net gain of +44 researchers (264 left, 308 arrived), and Australia gained +34 researchers (31 left, 65 arrived).
Crucially, America’s AI research supremacy remains heavily dependent on Chinese-educated scientists. Despite intensifying geopolitical friction and export controls, the share of researchers working in the United States who hold undergraduate degrees from China rose by 4 percentage points between 2022 and 2025. American technological dominance is sustained not by domestic undergraduate production alone, but by the open attraction of international researchers.
4. 68.7%: China’s domestic talent retention climbs by twelve percentage points
While China remains a major net exporter of scientific talent, a decisive structural shift is taking place: an increasing majority of Chinese AI graduates are choosing to remain at home.
According to the Carnegie dataset, China’s domestic talent retention rate climbed to 68.7% in 2025, up from 57% in 2022. Among the 5,903 researchers in the cohort who completed undergraduate degrees in China, 4,056 remained working within Chinese borders.
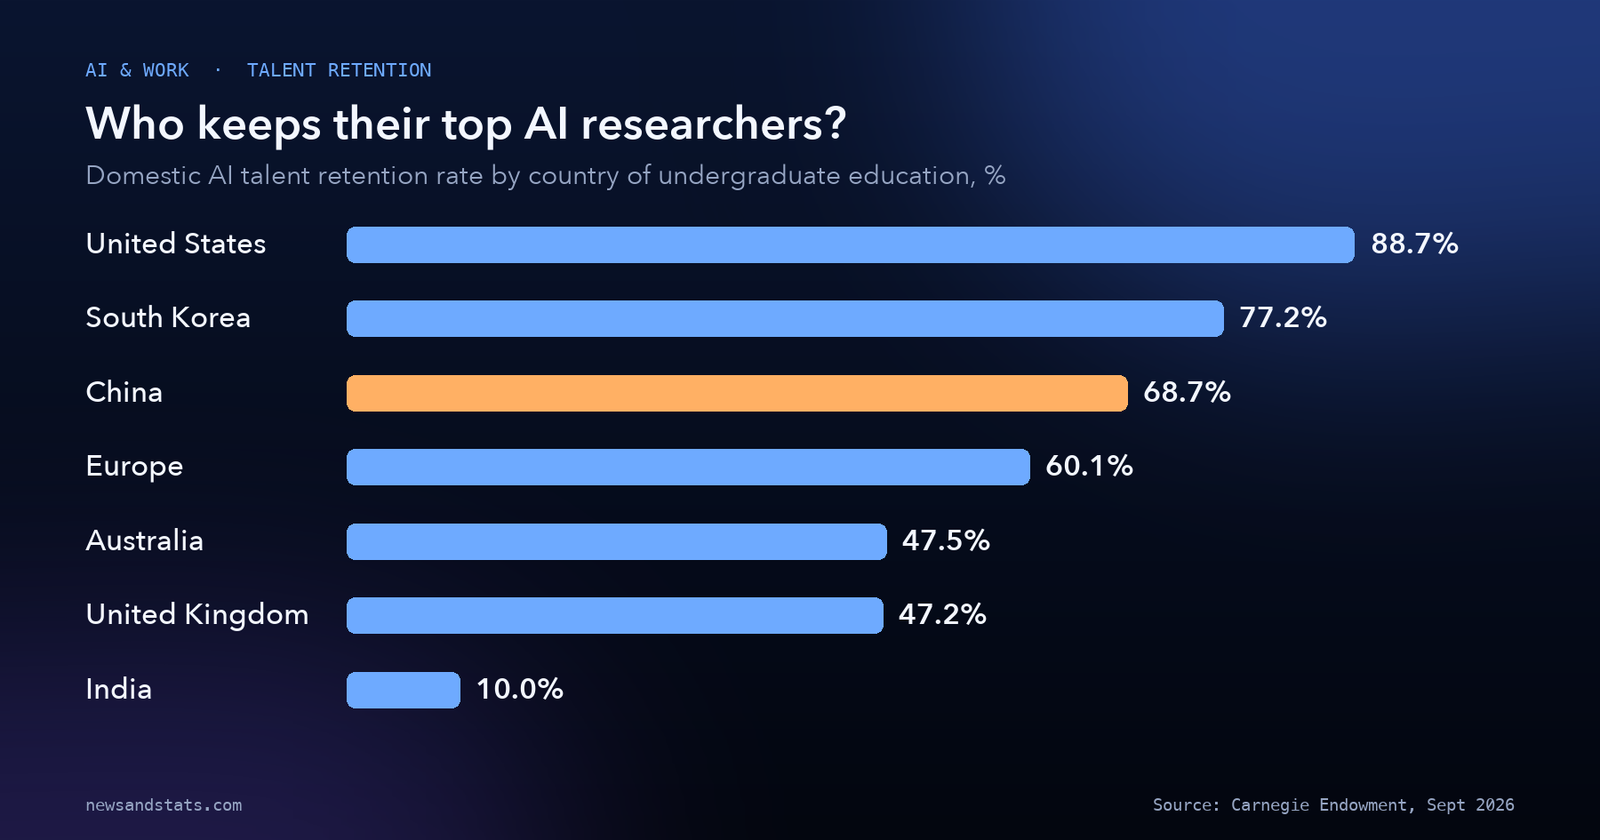
Source: Carnegie Endowment for International Peace, Who’s Ahead in the Global AI Talent Race?.
Our calculation: China’s domestic retention rate jumped by 11.7 percentage points between 2022 and 2025, closing nearly half of its historical retention gap with the United States.
Carnegie identifies two compounding drivers behind this retention surge:
- Domestic career opportunities: China’s expanding commercial AI sector offers high-status research posts and abundant computing resources, reducing the economic incentive to emigrate.
- Western immigration headwinds: Tighter visa scrutiny in the United States—particularly under STEM security screening policies—has made securing graduate admissions and work authorizations significantly more arduous for Chinese nationals.
While China’s 68.7% retention rate still trails the United States (which leads the world at 88.7% retention), it has officially surpassed Europe (60.1%), the United Kingdom (47.2%), and Canada (40.5%). As examined in our coverage of the rapid expansion of AI coding agents, domestic Chinese research clusters are retaining the human capital required to build autonomous software stacks independently.
5. 30 to 1: The lopsided bilateral talent flow between the US and China
The physical movement of researchers between the world’s two technological superpowers remains overwhelmingly unidirectional. In 2025, the bilateral balance of talent flows stood at 30 to 1 in favor of the United States.
This metric compares the volume of Chinese-origin researchers working in the United States against American-origin researchers working in China:
- In 2022, the ratio stood at 46 to 1 (46 Chinese-educated researchers working in the United States for every single American-educated researcher working in China).
- By 2025, the ratio moderated to 30 to 1 as more Chinese graduates remained home.
Examining granular career paths reveals the exact mechanics of this flow:
- The single largest cross-border pipeline in the entire global AI ecosystem is Chinese undergraduate researchers moving to the United States for graduate training and staying to work. In 2025, 1,071 researchers followed the “China undergrad -> USA grad -> Works in USA” trajectory.
- An additional 108 researchers completed both undergraduate and graduate degrees in China before relocating to work in the United States.
- In reverse, the return flow remains modest: 132 researchers completed undergraduate studies in China, earned graduate degrees in the United States, and returned to work in China.
- Crucially, American-educated researchers moving to work in China remain virtually nonexistent in the data, underscoring that American institutions do not face an intellectual drain toward Chinese labs.
The 30-to-1 ratio illustrates the enduring asymmetrical draw of American research institutions, where academic freedom, frontier venture capital, and open computational ecosystems continue to pull top Chinese minds across the Pacific.
6. 10.0%: India faces severe brain drain as nine in ten top graduates leave
While Asian economies such as China and South Korea are demonstrating rising capacity to retain domestic researchers, India confronts the most acute talent drain of any major economy. In the 2025 cohort, India recorded an elite AI talent retention rate of just 10.0%.
Out of 411 researchers who completed their undergraduate education in India, only 41 remained to work in the country, while 370 emigrated abroad:
- India experienced a net loss of -367 researchers, the second-largest absolute talent deficit globally behind China (-1,729).
- Only 3 foreign-educated researchers moved to India, highlighting that the nation has yet to establish itself as an attractive destination for international scientists.
The destination of Indian talent is heavily concentrated in the United States. The career-path analysis documents that 246 Indian-educated researchers completed graduate degrees in the United States and remained to work in American institutions. This single pathway accounts for 60% of all Indian-origin elite researchers in the cohort.
Furthermore, India’s overall footprint in elite academic AI research declined slightly, dropping by 2 percentage points in global share between 2022 and 2025. No Indian university or research institute ranked among the top 30 global institutions in either reporting year. For India’s booming digital economy, retaining foundational machine learning researchers remains a primary institutional challenge.
7. #1: Peking University overtakes corporate and American labs in talent production
The institutional balance of power in elite research generation has shifted decisively from Western corporate laboratories to Asian universities. In 2025, Peking University claimed the number-one global ranking among all institutions producing elite AI research talent.
This dethroning marks a major symbolic milestone:
- In 2022, Google occupied the number-one spot globally.
- By 2025, Peking University seized the top ranking, reflecting immense publication volumes across NeurIPS main and benchmark tracks.
The institutional realignment extends across East and Southeast Asia:
- South Korea’s Korea Advanced Institute of Science and Technology (KAIST) leapt twelve positions between 2022 and 2025, rising to become the third-highest-ranked institution globally in elite AI talent production.
- Singapore established two institutions in the global top 20: the National University of Singapore (NUS) rose from #25 in 2022 to #13 in 2025, while Nanyang Technological University (NTU) climbed from #29 to #16.
Conversely, traditional European powerhouses experienced steep declines. Swiss federal institute ETH Zurich and the University of Oxford—both prominent fixtures in earlier rankings—dropped entirely off the list of top 30 institutions in 2025.
As observed in our tracking of institutional patent filings across corporate research labs, academic institutions in East Asia are operating as highly disciplined talent incubators, supplying the scientific labor that sustains both domestic state priorities and international technology giants.
8. 77.2%: South Korea leads Asian talent retention as KAIST leaps to third
Beyond China, the most striking success story in national talent strategy is South Korea. In 2025, South Korea achieved a talent retention rate of 77.2%, ranking second globally behind only the United States (88.7%).
Out of 591 researchers who graduated from South Korean undergraduate programs, 456 remained to work in the domestic ecosystem:
- 407 researchers followed the complete domestic lifecycle: “South Korea undergrad -> South Korea grad -> Works in South Korea.”
- Only 70 South Korean graduates relocated to the United States for graduate school and subsequent employment.
South Korea’s high retention rate reflects strong industrial synergy between government research funding and corporate semiconductor giants. With Samsung, SK hynix, and Naver investing billions into proprietary AI models and hardware integration, South Korean researchers find world-class domestic environments to deploy their expertise.
The broader lesson of the Carnegie findings is that talent retention is not solely a function of national size, but of deliberate ecosystem design. Supported by massive capital expenditure across hyperscaler infrastructure, nations that align university research pipelines with domestic commercial deployment can successfully insulate themselves from international brain drain.
How to read global AI talent telemetry
Evaluating international machine learning human capital data requires understanding five fundamental methodological principles established by Carnegie and MacroPolo:
- Conference authorship as an elite proxy. Authors published at NeurIPS represent the top tier of foundational machine learning researchers (the “Navy Seals” of AI). The data does not measure general software developers, data analysts, or enterprise IT personnel, but rather the specialized researchers advancing algorithmic frontiers.
- Undergraduate degree as the origin proxy. A researcher’s origin is classified by the country where they completed their earliest undergraduate degree, rather than legal citizenship or place of birth. This provides a clean, standardized baseline for tracking cross-border human capital flows.
- Three-stage complete career path sample. To eliminate missing-data inferences, Carnegie’s primary analysis evaluates the subset of authors with complete, verified three-stage profiles (undergraduate, graduate, and current employer). In the 2025 cohort, this sample encompassed 10,280 unique researchers (40% of the conference author pool).
- Brain gain versus brain drain calculations. Net migration is calculated by comparing a researcher’s undergraduate origin country with their current employment location. It measures net balance-of-payments in human talent rather than temporary multi-stop migratory paths.
- Observation year timing. To ensure longitudinal consistency, current workplace affiliations are measured exactly one year following each conference: 2023 for the 2022 cohort, and 2026 for the 2025 cohort.
The global AI talent race at a glance
The following table summarizes the verified talent origin shares, employment distributions, net migration balances, and domestic retention rates established in the Carnegie Endowment’s 2026 Global AI Talent Tracker study.
| Metric | Measured value | Reporting benchmark | Core structural or geopolitical driver | Primary source |
|---|---|---|---|---|
| Chinese undergraduate origin share | 57% of elite talent | 2025 cohort | Up 11 percentage points from 2022 (46% baseline) | Carnegie Global AI Talent Tracker |
| United States undergraduate origin share | 13% of elite talent | 2025 cohort | Reflects domestic undergraduate STEM pipeline gap | Carnegie Global AI Talent Tracker |
| China share of employed researchers | 41% of workforce | 2025 benchmark | Surpassed US (up from 27% in 2022) as #1 work hub | Carnegie Global AI Talent Tracker |
| United States share of employed researchers | 34% of workforce | 2025 benchmark | Down from 46% in 2022 while remaining top magnet | Carnegie Global AI Talent Tracker |
| United States net talent inflow | +2,145 researchers | 2025 balance | Welcomed 2,300 arrivals while losing only 155 | Carnegie Global AI Talent Tracker |
| China net talent outflow | -1,729 researchers | 2025 balance | Lost 1,847 researchers while attracting 118 | Carnegie Global AI Talent Tracker |
| India net talent outflow | -367 researchers | 2025 balance | Lost 370 researchers while attracting only 3 | Carnegie Global AI Talent Tracker |
| Singapore net talent inflow | +218 researchers | 2025 balance | Attracted 249 arrivals while losing only 31 | Carnegie Global AI Talent Tracker |
| United States talent retention rate | 88.7% retention | 2025 benchmark | Retained 1,369 of its own 1,544 graduates | Carnegie Global AI Talent Tracker |
| South Korea talent retention rate | 77.2% retention | 2025 benchmark | Ranked second globally; retained 456 of 591 graduates | Carnegie Global AI Talent Tracker |
| China domestic talent retention rate | 68.7% retention | 2025 benchmark | Rose from 57% in 2022 (retained 4,056 of 5,903) | Carnegie Global AI Talent Tracker |
| Europe talent retention rate | 60.1% retention | 2025 benchmark | Retained 398 of 662 undergraduate graduates | Carnegie Global AI Talent Tracker |
| United Kingdom talent retention rate | 47.2% retention | 2025 benchmark | Retained 102 of 216 undergraduate graduates | Carnegie Global AI Talent Tracker |
| India domestic talent retention rate | 10.0% retention | 2025 benchmark | Retained only 41 of 411 undergraduate graduates | Carnegie Global AI Talent Tracker |
| Bilateral US-China talent flow ratio | 30 to 1 ratio | 2025 benchmark | 30 Chinese-origin in US for every 1 US-origin in China | Carnegie Global AI Talent Tracker |
| Top global talent producing institution | Peking University | 2025 ranking | Dethroned Google (#1 in 2022) to claim top spot | Carnegie Global AI Talent Tracker |
| KAIST institutional ranking | #3 globally | 2025 ranking | Leapt twelve positions since 2022 | Carnegie Global AI Talent Tracker |
| China -> USA -> USA career path | 1,071 researchers | 2025 cohort | Largest cross-border migration pipeline in AI | Carnegie Global AI Talent Tracker |
| India -> USA -> USA career path | 246 researchers | 2025 cohort | Represents 60% of all Indian-origin elite talent | Carnegie Global AI Talent Tracker |
| Total unique NeurIPS 2025 authors | 25,677 authors | NeurIPS 2025 | Total pool across 5,823 accepted conference papers | Carnegie Global AI Talent Tracker |
| Complete career trajectory sample | 10,280 researchers | 2025 sample | 40% of unique authors with complete verified histories | Carnegie Global AI Talent Tracker |
Source: Carnegie Endowment for International Peace, Who’s Ahead in the Global AI Talent Race?.
What to watch
- United States high-skilled STEM visa processing times and green card backlogs, monitoring whether administrative delays accelerate talent diversion to Singapore, Canada, and the UK.
- Chinese domestic research remuneration packages and compute access, observing whether sovereign subsidies sustain the 68.7% domestic retention rate amid economic pressures.
- European research institution competitive positioning, tracking whether initiatives like the European AI Office succeed in reversing the drop of ETH Zurich and Oxford from top talent rankings.
- India’s semiconductor and AI mission execution, observing whether domestic AI compute subsidies and tech parks improve India’s 10% talent retention rate before 2028.
- Corporate versus academic compensation divergence, evaluating whether tech hyperscalers continue to recruit leading faculty or whether academic labs maintain independent research pipelines.
- Asian institutional collaboration networks, tracking whether talent partnerships between Singapore, South Korea, and China formalize into regional research corridors.
The bottom line
The 2026 Global AI Talent Tracker study demonstrates that the global distribution of artificial intelligence expertise has entered a multipolar, asymmetrical era. China has cemented a commanding lead in human capital creation, producing 57% of the world’s elite AI researchers and employing 41% of the global research workforce as domestic retention climbs to 68.7%. Yet the United States maintains an indispensable structural advantage as the world’s primary talent magnet, absorbing a net gain of +2,145 researchers and benefiting from an asymmetrical 30-to-1 bilateral talent flow with China. While East Asian centers like South Korea and Singapore rapidly ascend the institutional rankings through deliberate retention policies, Europe and India face persistent brain drain challenges. As foundation model capabilities increasingly reflect the raw mathematical density of research teams, national competitiveness will depend as much on retaining and attracting human minds as on building physical server racks. For continuing analysis of workforce trends, technical tooling, and technological competition, explore our AI & Work section.
Related reading
- Stanford AI Index: The Investment Surge and the Shrinking US Lead: foundation model benchmarks, private investment trends, and technical capabilities.
- GitHub Octoverse: The Developer Milestone and Autonomous Agent Surge: platform developer demographics, agent-started pull requests, and software engineering velocity.
- Global Generative AI Patents: China’s Lead and the Inventions Surge: patent office data, enterprise AI inventions, and international intellectual property competition.