Central banks and other official institutions bought 288.9 tonnes of gold in the second quarter of 2026, up from 56.5 tonnes in the first quarter, according to the World Gold Council. Over the same quarter, the average LBMA Gold Price was US$4,506.29 an ounce, 8% below the record average of the first quarter and 37% above a year earlier.
This post sets out what the Council’s own data shows about official-sector buying, how the price and fund flows moved, and what the European Central Bank says about gold’s weight in the world’s reserves. Everything here comes from those primary reports. Where a number is our own calculation, we say so.
1. 288.9 tonnes: a rebound after a weak first quarter
The World Gold Council’s Gold Demand Trends report for the second quarter of 2026, published on 30 July 2026, puts net gold purchases by central banks and other official institutions at 288.9 tonnes. That is 62% higher than the same quarter a year earlier and 411% higher than the first quarter, when purchases were 56.5 tonnes.
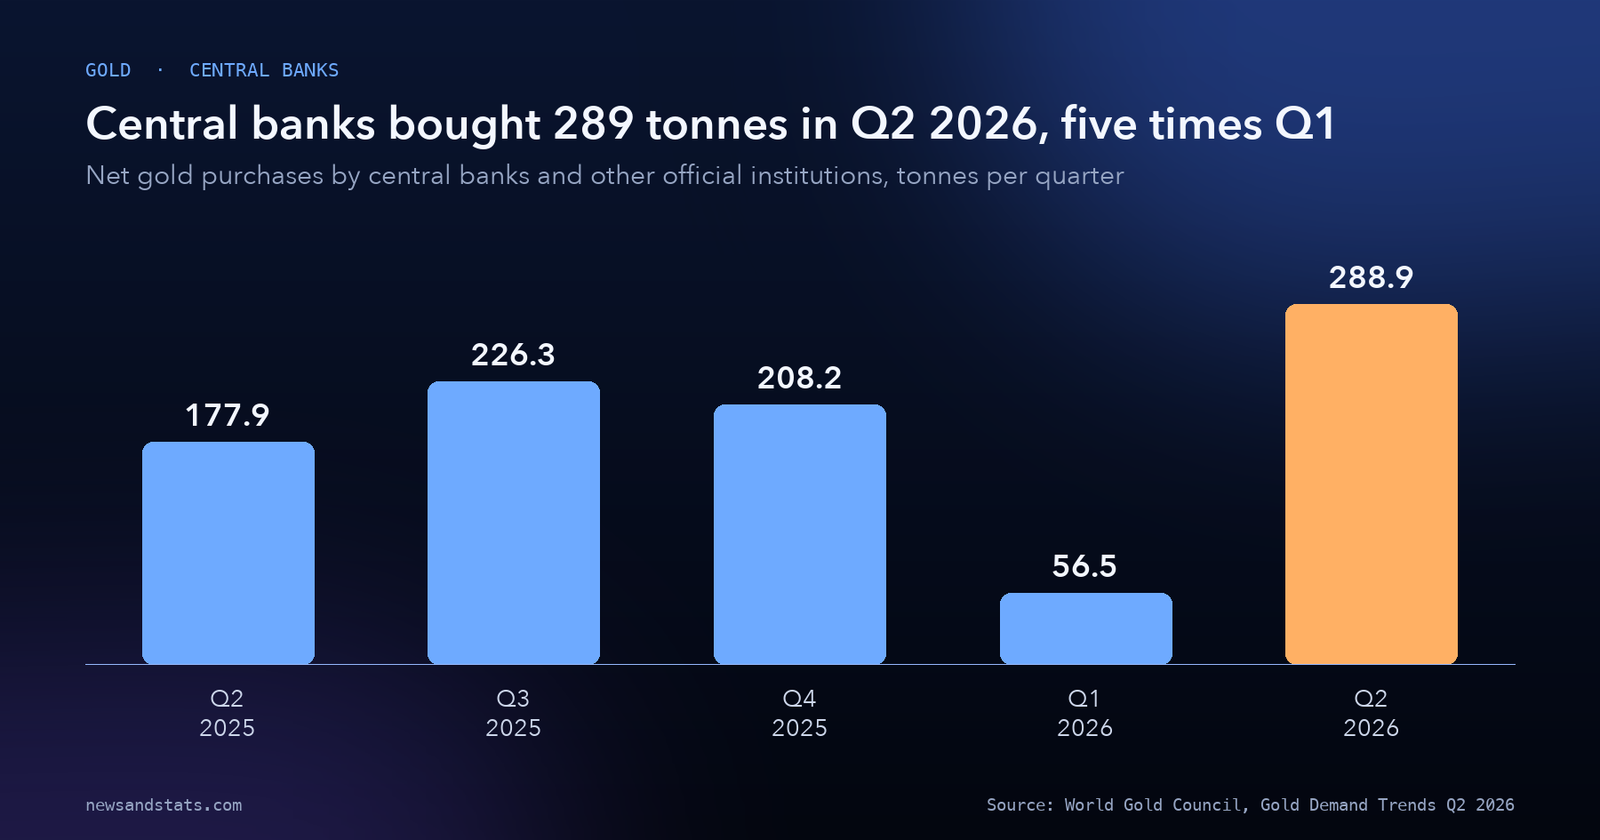
Source: World Gold Council, Gold Demand Trends Q2 2026, Table 1.
The Council describes the pattern in plain terms. After what it calls a notable slowdown in the first quarter, buying “recovered sharply to the lofty levels that have been typical in the last four years.”
Our calculation of the same two figures: 288.9 divided by 56.5 is about 5.1, so the second quarter was roughly five times the first. Added together, the first half of 2026 comes to 345.4 tonnes.
| Quarter | Central banks and other institutions (tonnes) | Gold ETFs and similar products (tonnes) | LBMA Gold Price, quarterly average (US$/oz) |
|---|---|---|---|
| Q2 2025 | 177.9 | 171.1 | 3,280.4 |
| Q3 2025 | 226.3 | 225.7 | 3,456.5 |
| Q4 2025 | 208.2 | 175.7 | 4,135.2 |
| Q1 2026 | 56.5 | 62.4 | 4,872.9 |
| Q2 2026 | 288.9 | -44.8 | 4,506.3 |
Source: World Gold Council, Gold Demand Trends Q2 2026, Table 1.
One quarter does not make a trend. The swing from 56.5 to 288.9 tonnes in two consecutive quarters is large enough that single-quarter comparisons say little on their own, which is why the Council frames the first quarter as a slowdown rather than a change of direction.
2. $4,506: the average price after a record quarter
The Council’s tables carry the LBMA Gold Price as a quarterly average in US dollars per ounce. That average rose in every quarter from the second quarter of 2025 to the first quarter of 2026: from 3,280.4 to 3,456.5, then to 4,135.2, then to a record 4,872.9. In the second quarter of 2026 it eased to 4,506.3.
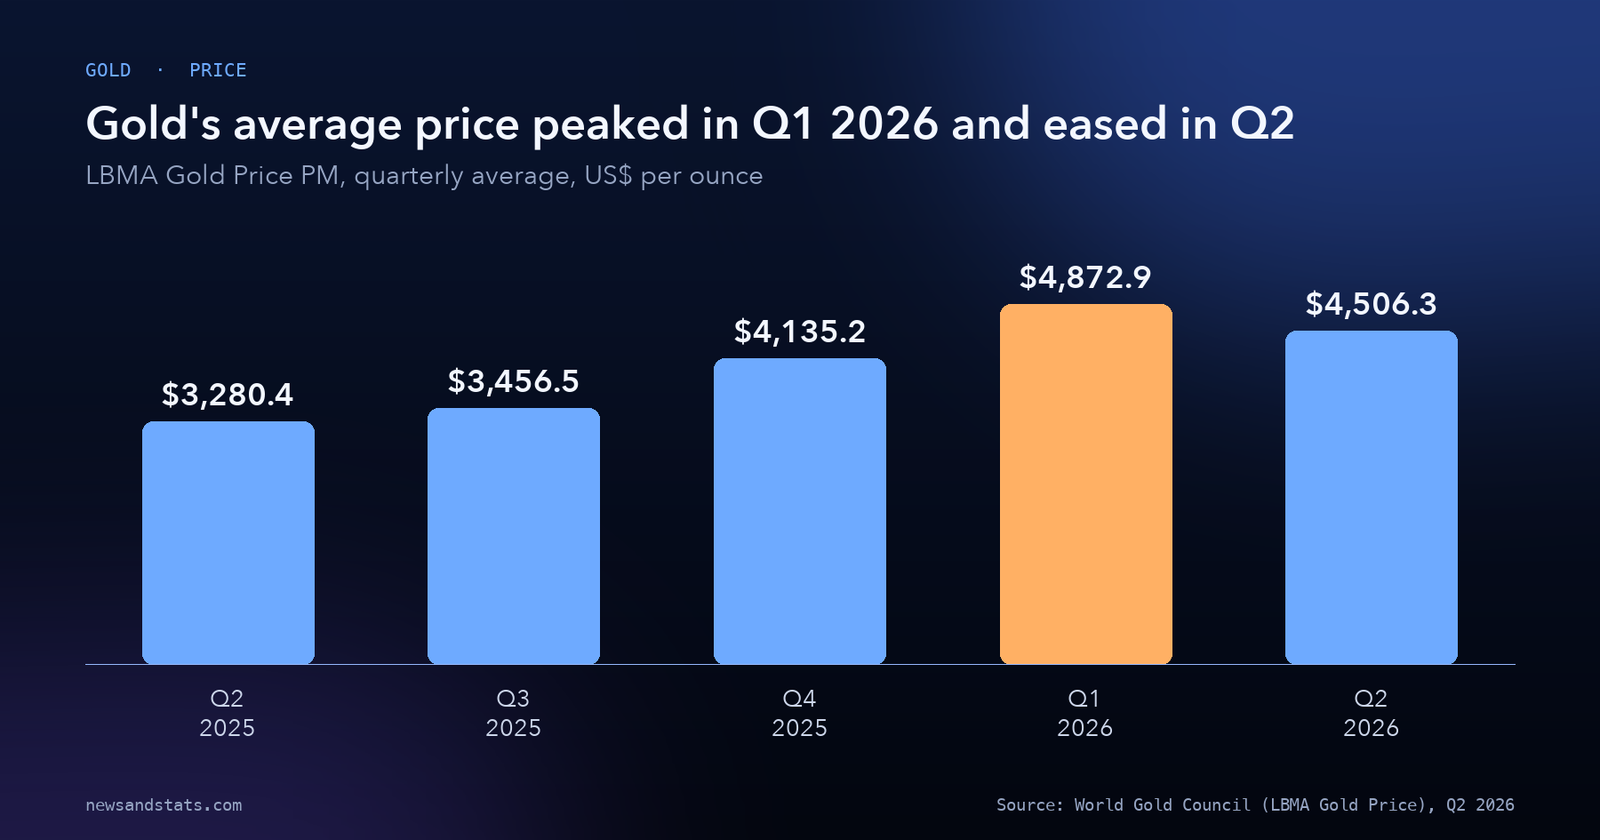
Source: World Gold Council, Gold Demand Trends Q2 2026 (LBMA Gold Price, quarterly average).
Three calculations from those figures, all ours:
- From the second quarter of 2025 to the record first quarter of 2026, the average price rose 48.5%.
- From the fourth quarter of 2025 to the first quarter of 2026, it rose 17.8%.
- From the first quarter to the second quarter of 2026, it fell 7.5%, which the Council rounds to 8%.
Quarterly averages smooth out the daily swings, so they say little about the highest or lowest price on any one day. We use them here because they come from a single consistent source.
3. Gold funds sold while central banks bought
Central banks were not the only large buyers and sellers in the quarter. Holdings in gold exchange-traded funds and similar products went from inflows of 62.4 tonnes in the first quarter to outflows of 44.8 tonnes in the second.
The Council ties the outflows to price and to expectations about inflation and interest rates. It says the outflows came “in response to weaker gold prices,” and it cites upward revisions to inflation and interest-rate expectations, particularly in North America, together with a stronger US dollar.
The two groups therefore moved in opposite directions in the same quarter. Our calculation from the table: in each of the four earlier quarters, the net buying of central banks and of funds was within a narrow band of each other, with the gap ranging from 0.6 to 32.5 tonnes. In the second quarter of 2026 the gap was 333.7 tonnes (288.9 against -44.8). The Council’s data records what each group did. It does not explain why central banks bought, so we do not offer a reason.
4. Where second-quarter demand came from
Total gold demand in the second quarter was 1,269 tonnes (1,268.9 in the Council’s table), unchanged from a year earlier. Within that total, the Council reports:
- Bar and coin investment of 307.1 tonnes, down 36% on the first quarter and 3% on a year earlier. The Council calls this a return to more typical levels of buying after two very strong quarters.
- Central bank and other institutional purchases of 288.9 tonnes, as above.
- Jewelry consumption of 278.2 tonnes, down 17% on a year earlier and the lowest quarterly volume since the pandemic. Spending on jewelry was US$40 billion, up 14% on a year earlier.
- Technology demand of 80.4 tonnes, up 2% on a year earlier.
Our calculation: central bank and institutional buying of 288.9 tonnes is about 22.8% of the 1,268.9 tonnes of total demand.
5. First half 2026: a record in dollars, a small gain in tonnes
For the first half of 2026 the Council reports total gold demand of 2,522 tonnes, up 2% on the first half of 2025, with a record value of US$380 billion.
Our reading of those two facts together with the price data: the volume of gold demanded rose only 2% while the average price in the second quarter was 37% higher than a year earlier, so most of the increase in dollar value reflects the higher price rather than a larger quantity. That is an inference from the Council’s numbers, not a statement the Council makes in those words.
6. Buying and the price moved in opposite directions in three of four quarters
The table also lets us compare how the average price and central bank buying changed from one quarter to the next. These are our calculations from the Council’s figures.
| Change | Average price | Central bank purchases |
|---|---|---|
| Q2 to Q3 2025 | +5.4% | +27.2% |
| Q3 to Q4 2025 | +19.6% | -8.0% |
| Q4 2025 to Q1 2026 | +17.8% | -72.9% |
| Q1 to Q2 2026 | -7.5% | +411% |
In the first of those four changes, both rose. In the other three they moved in opposite directions: a higher price came with less buying in the fourth and first quarters, and a lower price came with sharply more buying in the second quarter of 2026. Five quarters are far too few to establish a rule, and the data does not say why. But the pattern is a reminder that official buying is not simply a reaction to the price in the same quarter, which is one reason this article avoids explaining the purchases by the price move.
7. 2025 in full: 863 tonnes, below the 1,000-tonne mark
Zoom out to calendar years and the picture changes again. The Council’s full-year 2025 report, published on 29 January 2026, puts central bank net purchases at 863.3 tonnes in 2025, down 21% from 1,092.4 tonnes in 2024. It says 2025 fell short of “the exceptional 1,000t threshold reached in each of the previous three years.” The 2025 total combines the changes that central banks report with an estimate for unreported buying.
The European Central Bank gives a rounded version of the same story in its June 2026 report on the international role of the euro: purchases “eased to around 850 tonnes, from over 1,000 tonnes per year between 2022 and 2024.” We use the Council’s more precise figure of 863.3 tonnes for calculations, and note that the two agree broadly.
8. Who bought in 2025
Official gold buying is concentrated in a few countries. The Council’s full-year 2025 report lists the largest buyers:
| Buyer | 2025 purchases (tonnes) | Note |
|---|---|---|
| National Bank of Poland | 102 | Largest buyer for the second consecutive year |
| National Bank of Kazakhstan | 57 | Its highest annual buying on record back to 1993 |
| Central Bank of Brazil | 43 | Added between September and November after re-entering the market |
| State Oil Fund of Azerbaijan | 38 | Acquired in the first three quarters; a sovereign wealth fund, not a central bank |
| Central Bank of Turkey | 27 | Based on data to the end of October |
| People’s Bank of China | 27 | Full year |
| Czech National Bank | 20 |
Source: World Gold Council, Gold Demand Trends Full Year 2025, Central Banks.
Reporting windows differ by country, so the figures cover slightly different periods. The ECB’s report independently names Poland as the largest official-sector buyer in 2025, at about 100 tonnes. China, whose economy we compared with India in our India vs China post, appears in the list with 27 tonnes.
9. Gold’s share of official reserves: 27%, and why that overstates the change
The European Central Bank’s report, dated 2 June 2026, finds that gold made up 27% of global official reserves at the end of 2025, above both the euro (15%) and US Treasuries (22%).
The ECB immediately adds a caution. It says this development “largely reflects valuation effects”: the gold price rose by around 60% in 2025 and 30% in 2024 in nominal terms, which mechanically raises gold’s share. At constant end-2023 gold prices, the ECB reports, gold’s share would be 16%, level with the euro’s 16%, while US Treasuries would be 26%.
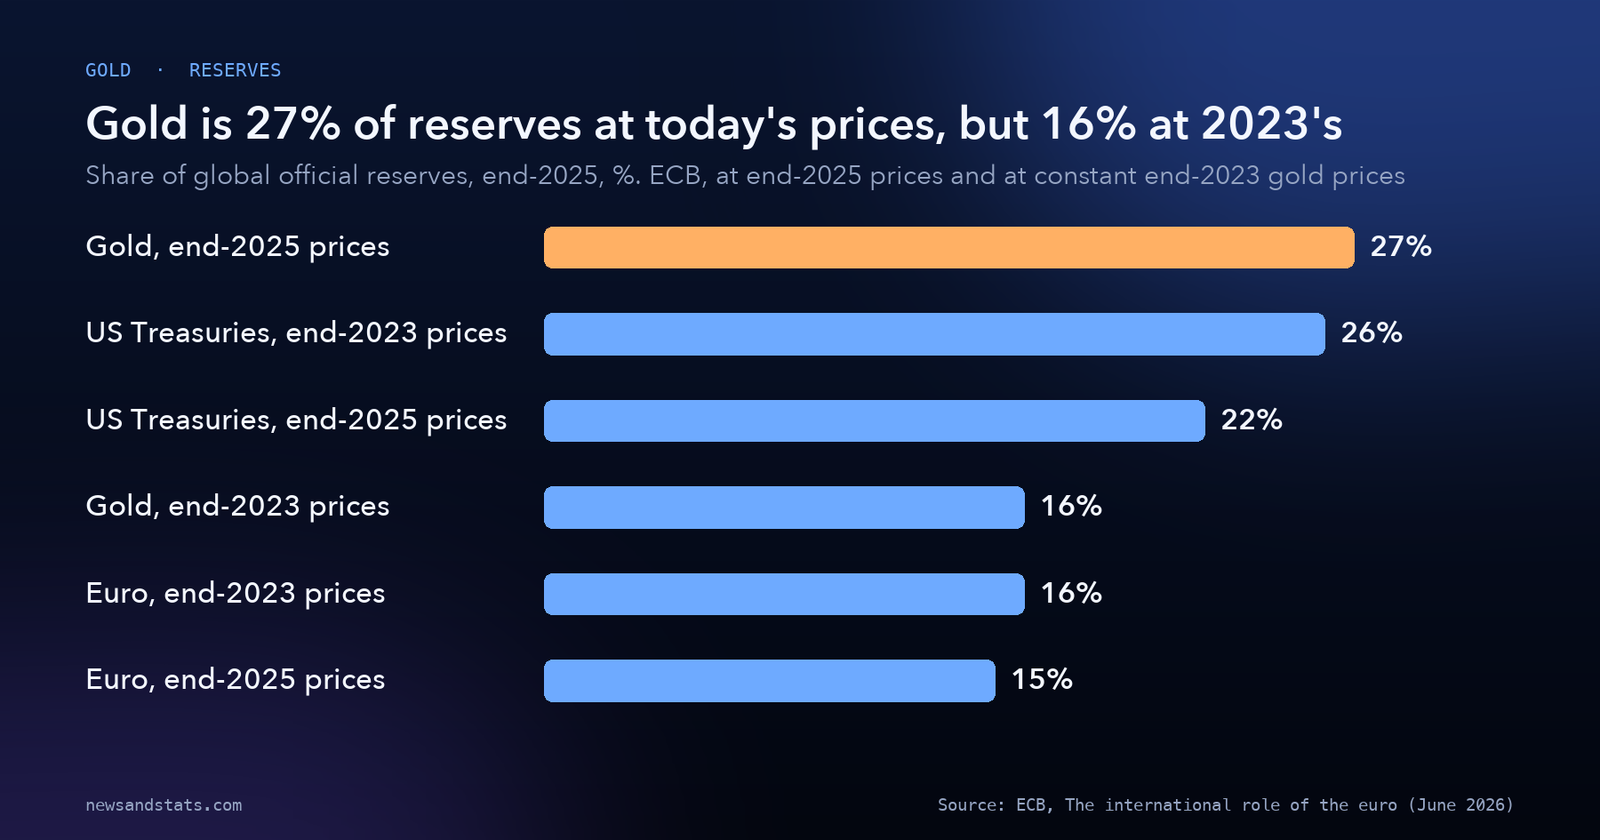
Source: European Central Bank, The international role of the euro (June 2026).
Our calculation: the gap between 27% and 16% is 11 percentage points. That gap is what the ECB attributes largely to price rather than to new buying.
The same section of the ECB report contains one more data point. It says the Turkish central bank sold or loaned out about 130 tonnes of gold after the outbreak of war in the Middle East. For the broader economic costs of the conflict, see our post on the energy shock.
10. How to read these numbers
Five cautions follow from the data above.
- Quarterly central bank figures swing. The move from 56.5 to 288.9 tonnes in one quarter shows why a single quarter is a poor guide to the year. The Council’s own wording treats the first quarter as a slowdown.
- Tonnes and dollars tell different stories. First-half demand rose 2% in tonnes, yet its value was a record US$380 billion.
- Averages are not peaks. The record in this article is a quarterly average. It says nothing about the highest price on any single day.
- A larger reserve share is partly a price effect. The ECB’s own estimate puts gold at 16% of reserves at constant 2023 prices, against 27% at end-2025 prices.
- Full-year totals include estimates. The Council’s 2025 total of 863.3 tonnes combines reported changes with an estimate for unreported buying.
What to watch
- The Council’s next Gold Demand Trends report, which will show whether official buying stayed near the second-quarter level of 288.9 tonnes or fell back toward the first quarter’s 56.5 tonnes.
- Whether gold funds return to inflows after the 44.8-tonne outflow in the second quarter.
- Whether full-year 2026 central bank purchases finish above or below 2025’s 863.3 tonnes. The first half stands at 345.4 tonnes by our calculation.
- The ECB’s next report on the international role of the euro, which will show whether gold’s share rises again at constant prices.
- Further reporting from Poland and Kazakhstan, the two largest buyers in the Council’s 2025 data.
- How the Council describes the price drivers in its next report, given its second-quarter reference to a stronger US dollar and revised interest-rate expectations.
The bottom line
Official gold buying in 2026 has been uneven: 56.5 tonnes in the first quarter, then 288.9 tonnes in the second. The price swung the other way, with the quarterly average peaking at US$4,872.9 an ounce in the first quarter and easing to US$4,506.3 in the second. The reserve data adds a warning about headline numbers: gold’s 27% share of global reserves is largely a result of its price rise, and falls to 16% at constant 2023 prices. For global growth and inflation forecasts, see our post on the IMF’s October outlook, and for more of our data coverage, the World in Numbers section.
Related reading
- The world economy in 8 numbers: what the IMF’s October 2026 outlook says: the global growth and inflation backdrop.
- Who pays for the 2026 energy shock? The numbers, country by country: the war’s costs for importing countries.
- India vs China: the economic gap in 10 numbers: the two largest emerging economies compared.