Global spending on energy represents as much as 10% of world gross domestic product (GDP), and the markets for hardware such as batteries, transformers, turbines, motors, and heat exchangers are worth trillions of dollars. Against that financial backdrop, clean energy innovation has ceased to be an academic pursuit or a niche sustainability initiative. It has become a core instrument of industrial policy, national security, and trade competitiveness. According to the International Energy Agency (IEA) in its report The State of Energy Innovation 2026, one in ten patents worldwide is now related to energy. That is a higher innovation intensity than in chemicals, pharmaceuticals, or transport.
Yet beneath this patent expansion lies an acute funding reallocation. Public research and development (R&D) budgets have softened, venture capital has retreated under macroeconomic pressure, and artificial intelligence ventures are absorbing early-stage capital. Here are the eight numbers that explain who controls clean energy innovation, where the capital is flowing, and how the industrial balance of power is shifting.
1. 40%: The unprecedented concentration in battery patents
The most striking development in global energy technology is the concentration of intellectual property in energy storage. According to the IEA report The State of Energy Innovation 2026, the share of all energy patenting represented by energy storage reached 40% in 2023. Based on preliminary data, the agency states that this share is set to grow further in 2024 and 2025.
The IEA analysis notes that no other single energy technology has ever commanded such a dominant share of global patenting. This shift reflects the foundational role of electrochemistry in modern industrial strategy. Batteries are no longer viewed merely as components for passenger electric cars. They are critical infrastructure for power system flexibility, national defense, and industrial electrification. As power grids worldwide confront grid bottlenecks and power constraints, stationary battery systems and advanced chemistries represent the primary mechanism to absorb renewable generation and maintain frequency stability.
The patent data tracked by the IEA is based on International Patent Families (IPFs). Each IPF represents a unique invention for which patent applications have been filed in at least two countries or regional patent offices. Measuring IPFs strips out low-value domestic filings and captures inventions that companies deem valuable enough to protect across multiple international markets. That 40% of these high-value families now focus on energy storage demonstrates how decisively private and public capital has converged on battery architectures.
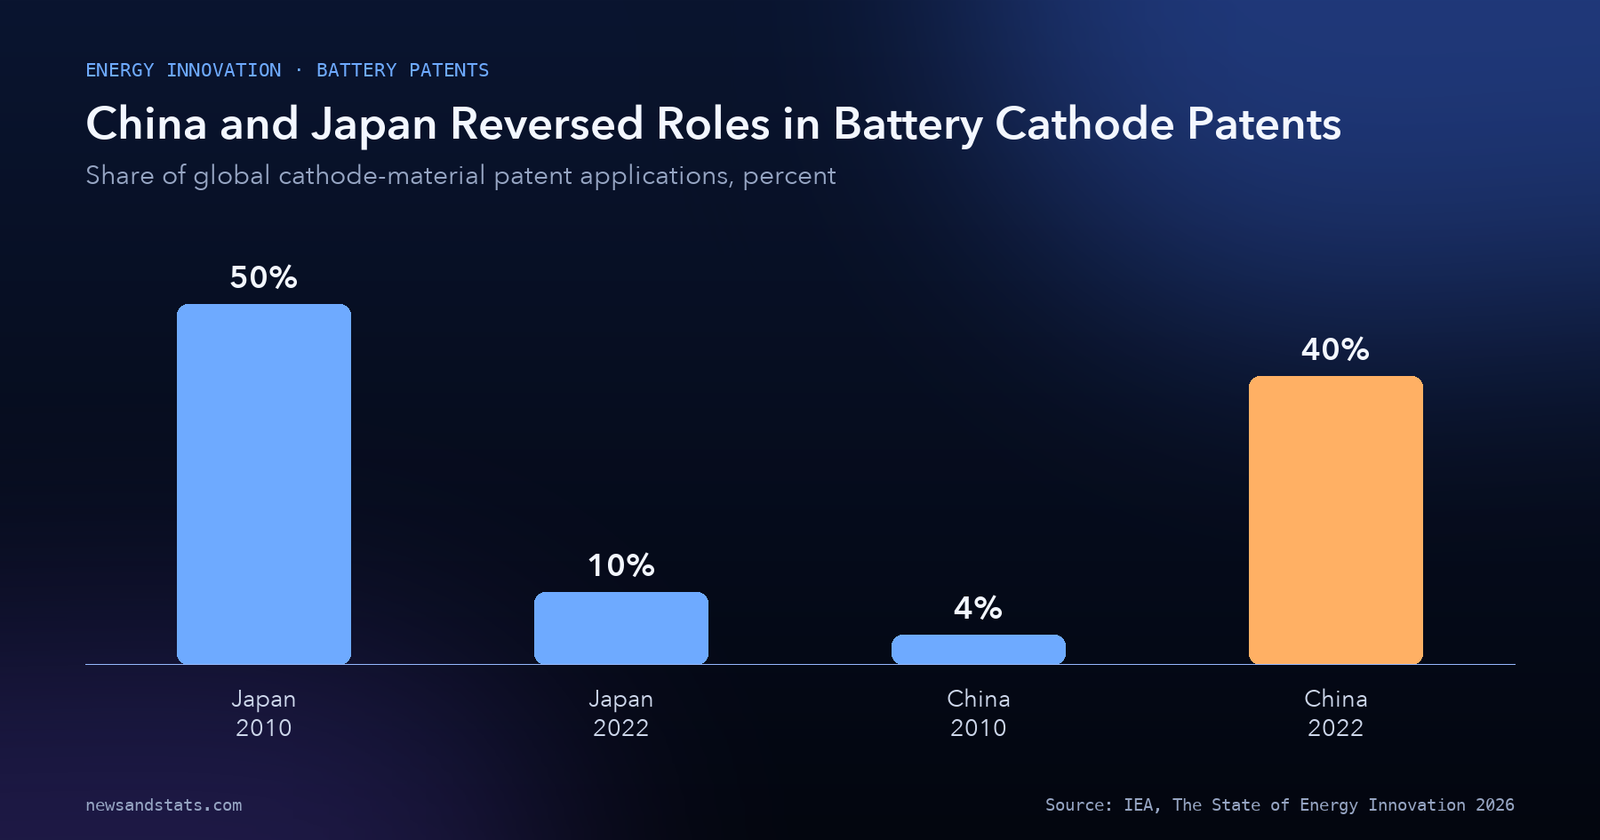
2. 4% to 40%: How China and Japan reversed roles in cathode materials
Within the battery sector, the geographic center of gravity has undergone a historic inversion. The IEA data shows that China, Korea, and Japan remain the leading sources of lithium-ion battery patents globally, but their relative contributions have transformed over the past decade.
In 2010, Japan filed 50% of all international patent applications for battery cathode materials. By 2022, Japan’s share had fallen to below 10%. Over the exact same period, China’s share of cathode-material patents surged from 4% to almost 40%. Our calculation: Japan experienced a decline of 40 percentage points in its cathode patent share, while China achieved an increase of 36 percentage points.
Source: IEA, The State of Energy Innovation 2026.
Cathode materials represent the most expensive and chemically demanding component of a lithium-ion cell, determining energy density, thermal safety, and cycle life. Japan pioneered early commercial lithium-ion chemistry, but Chinese research institutions and manufacturing conglomerates rapidly scaled development of lithium iron phosphate (LFP) chemistries and high-nickel formulations.
This rapid transfer of patent leadership parallels dynamics observed in the semiconductor manufacturing race, where early intellectual leadership can be overtaken by competitors that combine state research subsidies with massive domestic supply chains. While Japan retains the highest Revealed Technology Advantage (RTA) in batteries among major economies—a metric measuring a country’s share of battery patents relative to its share of all patents—China’s sheer volume of patent filings has established a formidable barrier to entry. In 2023, Chinese inventors filed double the number of international energy patent applications compared with 2020, reaching twice the level of the United States, Japan, or Europe.
3. $55 billion: Public energy R&D dips as budgets tighten
While patent activity expanded, government financial commitments to energy research experienced a noticeable contraction. According to the IEA, public energy R&D spending globally fell by 2% in 2025 to an estimated $55 billion (USD 55 billion), down from its recent peak in 2023.
The IEA attributes this reduction to two primary factors: the conclusion of large demonstration project commitments made under the 2023 European Union budget, and budget reductions in North America. In the United States, the federal energy R&D budget dipped by 8% in 2025, with several budgeted programs paused or cancelled as research priorities underwent administrative review.
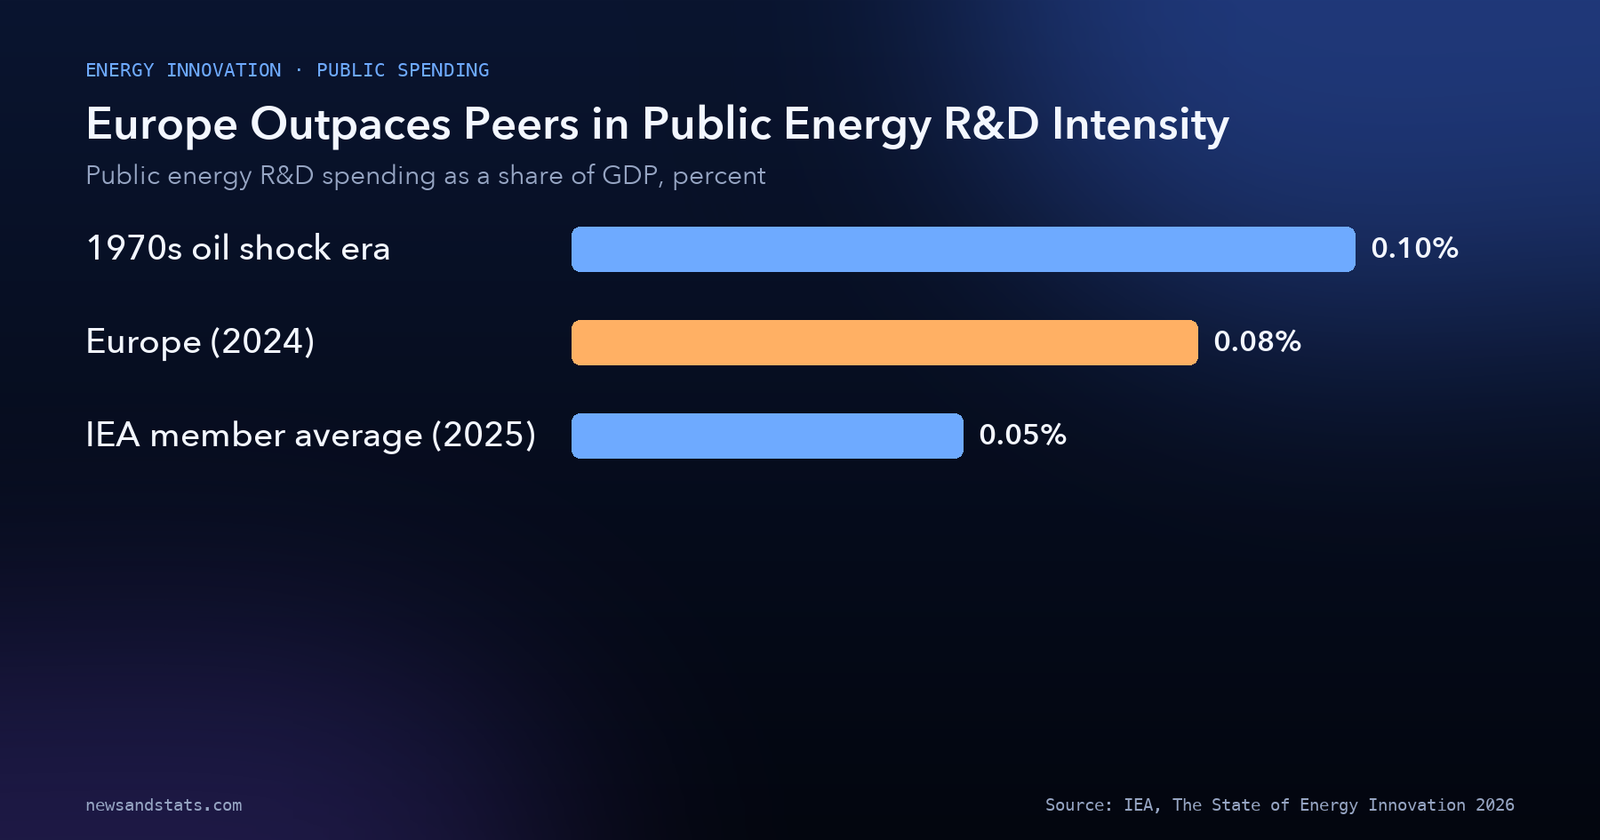
This public retrenchment comes at a sensitive moment for clean technology development. Public energy R&D spending across IEA member countries currently averages around 0.05% of GDP. That is half the 0.1% of GDP recorded in the late 1970s and early 1980s, when Western governments mobilized massive research initiatives in the wake of the oil shocks to diversify their domestic energy bases.
The historical returns on public research spending have been documented by retrospective economic assessments. The IEA notes that evaluations of multi-decade US public energy programs up to 2015 demonstrated economic benefits to the US economy at least three times greater than their original costs. In specific fields such as geothermal energy, wind turbine aerodynamics, and building efficiency technologies, public R&D produced several hundreds of dollars in economic benefits, lower fuel expenditures, and consumer savings for every dollar of taxpayer funding.
4. $160 billion: Corporate R&D dominates, powered by China
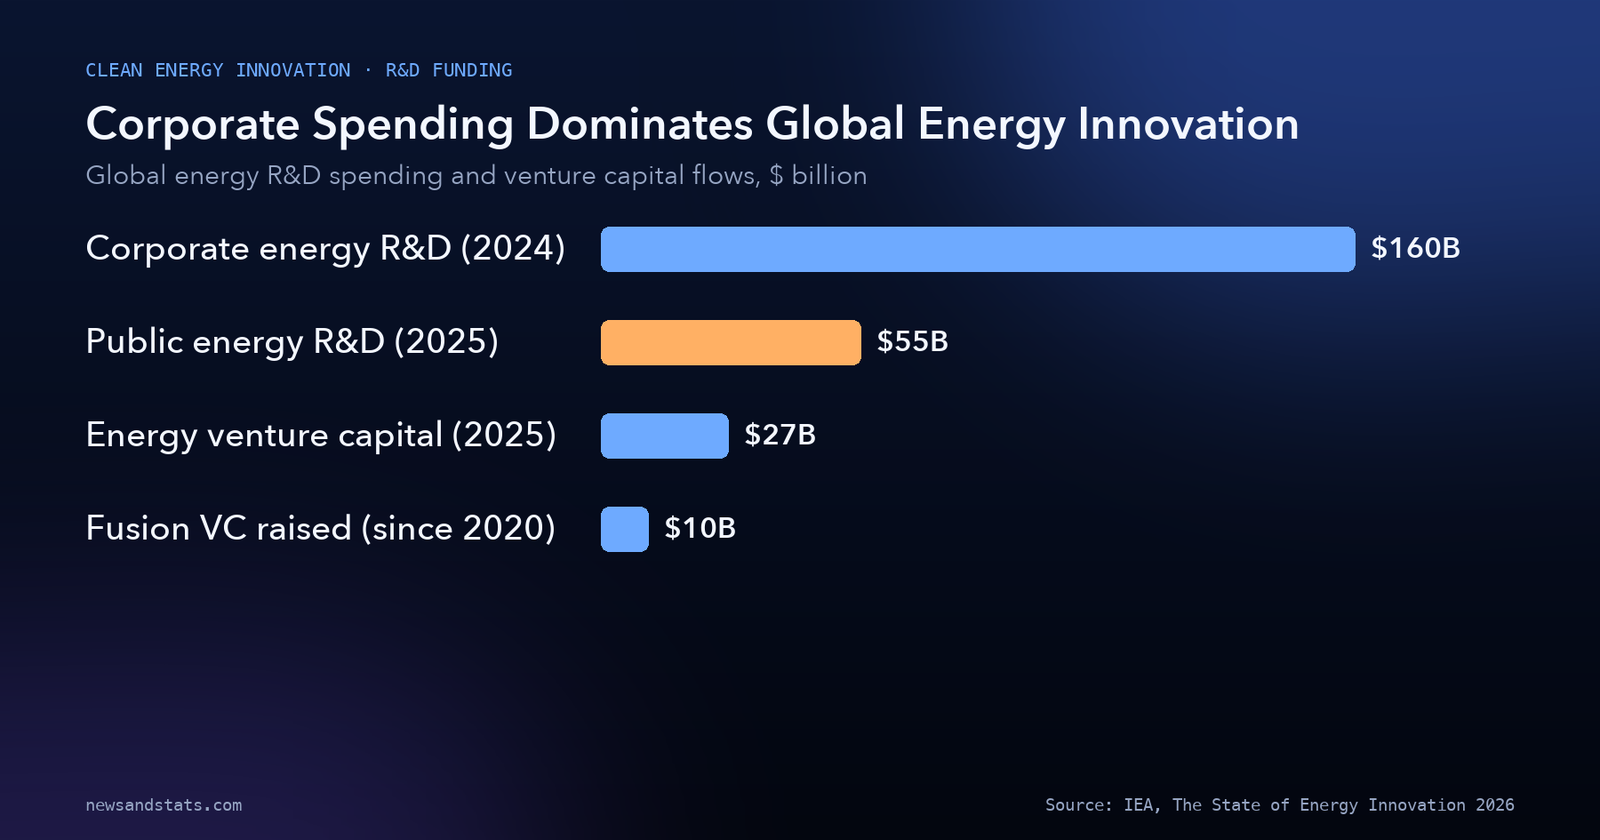
Private industry provides the largest share of funding for clean technology development, but its momentum is slowing. The IEA reports that corporate energy R&D spending reached $160 billion (USD 160 billion) in 2024, the most recent year with complete corporate financial reporting.
Annual growth in corporate energy R&D slowed to 1% in 2024. Excluding the pandemic contraction in 2020, that 1% growth rate represents the slowest pace of corporate spending expansion since 2015. Higher borrowing costs, cost inflation in industrial supply chains, and market soft patches in sectors like offshore wind and hydrogen electrolyzers prompted corporate boards to tighten capital expenditures.
The internal structure of corporate spending has become heavily concentrated geographically. The IEA highlights that increased spending by Chinese companies accounts for almost all the net growth in corporate energy R&D globally over the past decade. Today, Chinese corporations account for 60% of all corporate R&D in energy supply and infrastructure sectors worldwide.
Source: IEA, The State of Energy Innovation 2026.
Our calculation: corporate energy R&D ($160 billion in 2024) is roughly 2.9 times the size of global public energy R&D ($55 billion in 2025). When combined with $27 billion in venture capital, total tracked global energy technology funding reached $242 billion. As examined in our analysis of the economic gap between India and China, China’s industrial strategy relies heavily on state-backed corporate R&D to establish export scale, giving Chinese manufacturers an enduring cost advantage over international rivals.
5. $27 billion: Venture capital retreats as AI pulls capital away
Venture capital investment in energy technology start-ups fell for the third consecutive year in 2025, dropping to $27 billion (USD 27 billion).
This contraction stems from macroeconomic headwinds and intense competition for limited risk capital. Higher global interest rates increased the cost of capital, discouraging institutional limited partners from funding capital-intensive, multi-year clean hardware projects. Instead, venture capital funds prioritized smaller deal sizes and longer due diligence cycles.
Simultaneously, the boom in generative artificial intelligence created a massive capital diversion. According to the IEA, the share of global venture capital funding directed to AI companies rose to almost 30% in 2025, while the share allocated to energy technology shrank. Large, non-specialist venture funds that had actively backed clean technology between 2020 and 2022 shifted their attention and partner bandwidth to AI model developers and infrastructure start-ups.
This capital rotation highlights a fundamental tension in modern industrial markets. As documented in our examination of the hyperscaler infrastructure boom, technology conglomerates are deploying hundreds of billions of dollars into data centers and compute clusters. Yet the very energy technologies required to power those clusters cleanly—such as next-generation geothermal, long-duration storage, and advanced nuclear—must compete against software ventures for early-stage equity financing.
The geographic distribution of venture funding remained skewed. United States start-ups raised nearly 50% of all global energy venture capital in 2025, driven by an established network of domestic deep-tech investors. European start-ups accounted for 25% of global energy VC in 2025, a marked increase from 15% five years earlier.
6. One-third: The deep-tech pivot in energy start-ups
While overall venture capital dollars contracted, the internal composition of energy start-up funding underwent a structural reorganization. Between 2018 and 2021, early-stage clean technology investment was dominated by electric mobility ventures, including electric vehicle manufacturers, scooter fleets, and consumer charging networks.
As electric mobility matured into an established manufacturing sector with compressed margins, venture capital pivoted toward heavy industrial deep tech. The IEA identifies seven technology segments that have offset most of the post-2021 decline in electric mobility funding:
- Carbon dioxide removal
- Critical minerals processing and recycling
- Next-generation geothermal energy
- Low-emissions industrial production (such as green steel and cement)
- Sustainable aerospace
- Advanced nuclear fission
- Fusion energy
From 2015 to 2019, these seven areas collectively represented less than 5% of total energy venture capital, with aviation accounting for half of that modest share. In 2025, these seven deep-tech areas accounted for one-third (33%) of total energy venture capital funding. Our calculation: the share of energy VC going to these seven heavy technology segments expanded roughly sevenfold, rising from less than 5% to 33%.
Nuclear fusion provides a clear illustration of this deep-tech influx. Despite commercial electricity generation remaining years away, fusion start-ups have raised $10 billion (USD 10 billion) in private capital since 2020. That accounts for over 5% of all energy venture capital deployed over that period. In 2025, experimental milestones were reached in government-funded facilities across China, France, Germany, the United Kingdom, and the United States, encouraging private investors to partner with public laboratories.
7. 0.08% of GDP: Europe leads in public innovation intensity
Although European venture-backed start-ups typically raise smaller funding rounds than their American peers, Europe has emerged as the global leader in public energy research intensity.
According to revised EU data cited by the IEA, European public energy R&D spending reached 0.08% of GDP in 2024, pulling away from both the United States and Japan. European governments spent $19 billion (USD 19 billion) on public energy research in 2024, with more than half of that total dedicated to energy efficiency and nuclear technologies.
Source: IEA, The State of Energy Innovation 2026.
Our calculation: Europe’s public R&D intensity of 0.08% of GDP is 60% higher than the IEA member average of 0.05% of GDP.
This sustained public commitment has fostered an active early-stage ecosystem. Europe was home to more than 40% of all energy start-ups worldwide that raised their first external funding round in 2025. Furthermore, among the frontrunner commercialization projects tracked by the IEA in its “Races to First”—which monitor progress toward 18 major technology breakthroughs—40% of the advanced-stage projects are located in Europe, compared with 20% in the United States.
However, Europe faces a persistent commercialization gap. While the continent excels in foundational research and early-stage incubation, patenting rates across major European economies have softened. European innovators frequently encounter hurdles when scaling capital-intensive manufacturing facilities, leading promising technologies to be commercialized or manufactured in North America or East Asia.
In Japan, public innovation policy has stabilized around the government’s $75 billion (USD 75 billion) Green Transformation (GX) fund. Japan maintains significant technological capabilities in advanced chemistries, hydrogen-based fuels, and maritime propulsion. In 2025, a Japanese industrial manufacturer completed the first full-scale testing of an ammonia-fueled ship engine.
8. Over 70%: Perovskite takes over the solar research landscape
Solar photovoltaic (PV) hardware is often perceived as a commoditized, mature technology. Yet academic and industrial patenting data reveals an active materials science race.
The IEA reports that since 2010, international patent filings for traditional crystalline silicon PV have steadily declined. In their place, patenting for metal halide perovskite solar cells has expanded dramatically. Perovskite solar technologies now account for over 70% of all solar cell patent applications globally.
Perovskite materials possess crystalline structures that absorb light across different wavelengths than silicon. When layered onto silicon cells in tandem configurations, perovskites can theoretically push solar module efficiencies far beyond silicon’s practical limits. In 2025, researchers achieved the world’s first 33% efficiency solar cell at marketable commercial dimensions.
China leads global perovskite patent applications, followed by Korea and Japan. While perovskite modules are not projected to displace standard silicon panels in the near term due to long-term degradation challenges, they demonstrate how established renewable sectors continue to generate radical architectural iterations.
9. 80%: Why clean energy innovation shifted toward security
The institutional priorities directing energy innovation have fundamentally pivoted away from decarbonization in isolation toward national resilience.
In a comprehensive survey of global energy experts and practitioners conducted by the IEA for its 2026 report, 80% of respondents ranked energy security among the top three drivers of energy innovation in 2025. Energy security surpassed greenhouse gas emissions reduction, consumer affordability, and broader national economic performance as the primary motivation for research programs.
This strategic recalibration reflects real-world supply vulnerabilities exposed over the past four years. Geopolitical disruptions in Eastern Europe and shipping lanes in the Middle East—detailed in our coverage of the global energy shock—demonstrated that reliance on distant fossil fuel supply chains creates macroeconomic fragility. At the same time, the concentration of critical mineral refining and battery manufacturing in China has alarmed policymakers in Washington, Brussels, and Tokyo.
In response, governments introduced more than 80 new energy innovation policies and over 60 new policy initiatives across 32 countries and jurisdictions in 2025. Major legislative and executive frameworks—such as the US Genesis Mission and the European Union’s proposed Competitiveness Fund—explicitly mandate technological self-reliance in power grids, domestic critical minerals extraction, and nuclear power.
As IEA Executive Director Fatih Birol stated upon the publication of the report on 17 February 2026: “Energy innovation has become a strategic priority for governments around the world.”
The agency’s findings are detailed in its full report overview and corroborated by its official news release, titled Energy innovation enters security-focused phase as batteries dominate patent landscape. The release notes that over 320 new energy technology start-ups raised their initial funding rounds in 2025, and tracked emerging technologies registered 50 upgrades in technology readiness levels.
10. How to read the energy innovation numbers
Interpreting international energy innovation statistics requires distinguishing between patents, research budgets, and deployed industrial capacity. Five nuances clarify the data:
- Patents measure invention, not deployment. A 40% share in battery patents indicates intense research activity and corporate positioning. It does not mean alternative technologies like solar, wind, or heat pumps are stalling; rather, it reflects that core wind and crystalline solar technologies have entered manufacturing maturity where fewer novel patent families are filed.
- International patent families filter out domestic inflation. Domestic patent counts in single jurisdictions can be distorted by local filing subsidies. The IEA relies on International Patent Families (IPFs) filed across at least two offices, providing an internationally standardized metric of commercial intent.
- Corporate and public R&D report on different timelines. Corporate R&D figures reflect consolidated financial filings through calendar year 2024, whereas public R&D estimates incorporate preliminary government budget appropriations for 2025. Comparing them requires noting the one-year offset in reporting availability.
- Revealed Technology Advantage (RTA) measures specialization, not scale. An economy can have a high RTA in a sector (such as Japan in batteries) because that sector accounts for a disproportionate share of its domestic patents, even if another economy (such as China) files a higher absolute number of patents.
- Venture capital represents high-risk equity, not total capital expenditure. The $27 billion deployed by venture funds finances early-stage technology risk. Commercial deployment of proven technologies is financed through bank debt, project bonds, and utility balance sheets, which operate at a scale an order of magnitude larger.
The global energy innovation landscape at a glance
The following table summarizes the primary metrics tracked in the IEA’s 2026 innovation assessment across corporate spending, public budgets, venture capital flows, and intellectual property.
| Metric | Measured value | Reference period | Primary driver or leader | Source |
|---|---|---|---|---|
| Energy share of all global patents | 10% (one in ten) | 2023 | Batteries and energy storage | IEA State of Energy Innovation |
| Energy storage share of energy patents | 40% | 2023 | Grid storage and EV architectures | IEA State of Energy Innovation |
| China share of cathode patents | 40% (almost 40%) | 2022 | Domestic supply chain expansion | IEA State of Energy Innovation |
| Japan share of cathode patents | 10% (below 10%) | 2022 | Share down from 50% in 2010 | IEA State of Energy Innovation |
| Corporate energy R&D spending | $160 billion | 2024 | Chinese firms (60% of supply R&D) | IEA State of Energy Innovation |
| Public energy R&D spending | $55 billion | 2025 | European Union and US federal programs | IEA State of Energy Innovation |
| Venture capital in energy start-ups | $27 billion | 2025 | US start-ups (nearly 50% share) | IEA State of Energy Innovation |
| AI share of global venture capital | 30% (almost 30%) | 2025 | Foundation models and AI compute | IEA State of Energy Innovation |
| Deep tech share of energy VC | 33% (one-third) | 2025 | Geothermal, fusion, minerals, nuclear | IEA State of Energy Innovation |
| Cumulative fusion start-up VC | $10 billion | 2020-2025 | Over 5% of total energy VC | IEA State of Energy Innovation |
| Europe public R&D intensity | 0.08% of GDP | 2024 | Efficiency and nuclear ($19 billion) | IEA State of Energy Innovation |
| IEA average public R&D intensity | 0.05% of GDP | 2025 | Down from 0.1% in 1970s oil shocks | IEA State of Energy Innovation |
| Perovskite share of solar cell patents | Over 70% | 2024 | Tandem cell research, led by China | IEA State of Energy Innovation |
| Expert survey: energy security priority | 80% | 2025 | Supply disruption and mineral security | IEA State of Energy Innovation |
Source: IEA, The State of Energy Innovation 2026 and IEA News Release.
What to watch
- Whether global public energy R&D rebounds in 2026 or slips further below $55 billion as governments manage elevated sovereign borrowing costs.
- The deployment of commercial perovskite-silicon tandem modules, following the 33% cell efficiency record demonstrated in 2025.
- The outcome of the European Union’s proposed Competitiveness Fund in providing scale-up debt for first-of-a-kind clean industrial manufacturing facilities.
- Whether US federal energy research appropriations stabilize or face additional cancellations following the 8% reduction observed in 2025.
- Start-up capital flows in 2026, specifically whether venture capital allocated to artificial intelligence ventures continues to crowd out clean energy hardware developers.
- Milestones in solid-state battery commercialization from Japanese and Chinese automakers, tracking progress under the IEA Races to First benchmarks.
The bottom line
Clean energy innovation is no longer a peripheral environmental initiative; it is a multi-trillion dollar industrial competition where one in ten global patents is now contested. While corporate research spending reached $160 billion and battery technology captured an unprecedented 40% of energy patents, public research budgets contracted to $55 billion and venture capital fell to $27 billion as AI captured almost 30% of global risk equity. With 80% of practitioners prioritizing national security, the race has shifted toward domestic critical minerals, advanced storage, and industrial resilience. For the broader economic context shaping these investments, see our review of the macroeconomic outlook from the IMF, and explore our Industries section for deeper examinations of global technology supply chains.
Related reading
- India vs China: the economic gap in 10 numbers: industrial strategy and manufacturing investment compared.
- Data Center Power Demand Is Set to Double by 2030. The Grid Is the Bottleneck.: the power generation and grid constraints facing digital infrastructure.
- Why memory chips got so expensive: the DRAM shortage in numbers: how capital concentration and manufacturing lead times create hardware bottlenecks.