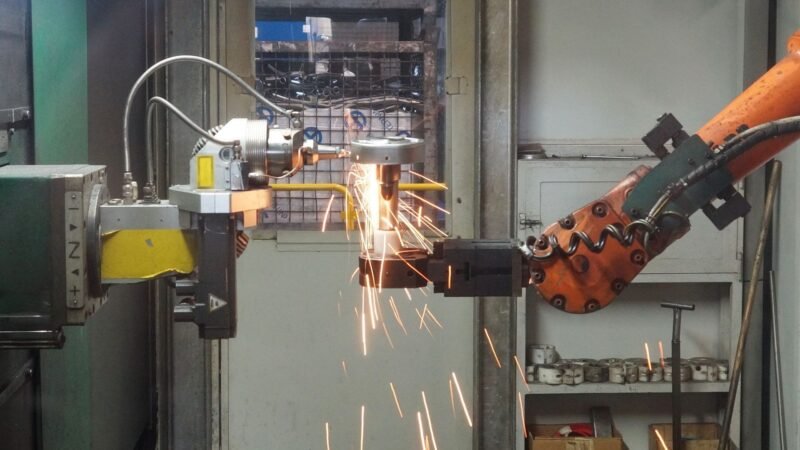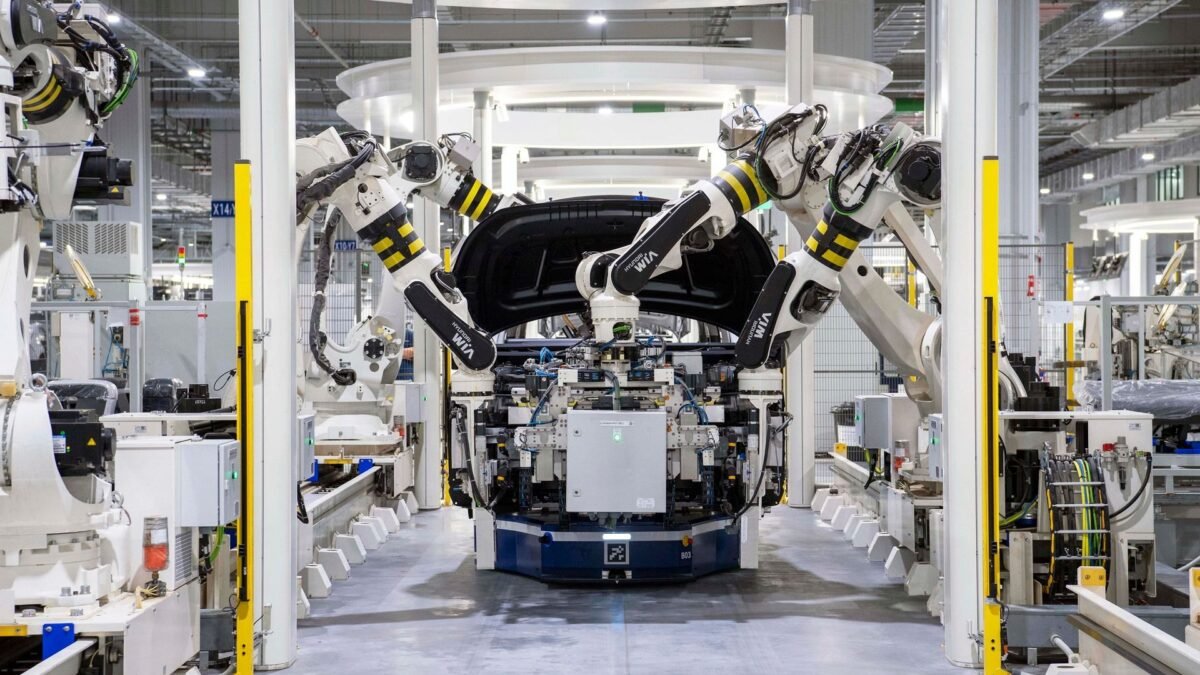
While public debate around artificial intelligence focuses heavily on large language models and software automation and white-collar tasks, physical automation across the world’s factory floors has crossed a historic threshold. According to the International Federation of Robotics (IFR) in its World Robotics 2026 Report, the global operational stock of industrial robots surged by 9% in 2025 to reach a record 5 million units.
That five-million-robot milestone represents more than double the number of operational factory robots operating just seven years ago. As manufacturers grapple with aging workforces, nearshoring mandates, and wage pressures, annual industrial robot installations jumped by 11% in 2025 to exceed 600,000 new units worldwide. Driven by advances in machine vision, artificial intelligence perception, and simplified programming, robots are moving beyond specialized automotive assembly lines into food processing, electronics, and general metal fabrication. Here are the eight numbers that explain who controls global factory robotics, where automation is expanding fastest, and how the industrial geography of manufacturing is being redrawn.
1. 5 million units: The global operational robot fleet doubles
The benchmark figure in modern manufacturing is the total fleet of active machines. According to the IFR, the global operational stock of industrial robots reached exactly 5 million units at the end of 2025, marking a 9% expansion over 2024 levels.
The IFR defines an industrial robot based on the International Organization for Standardization (ISO) standard: an automatically controlled, reprogrammable multipurpose manipulator programmable in three or more axes. These machines perform precision welding, painting, high-speed sorting, palletizing, and machine tending across automated assembly plants.
The trajectory of this operational stock highlights how rapidly automation has compounded. Seven years earlier, in 2018, the world’s operational robot stock stood at approximately 2.4 million units. Our calculation: the operational factory robot fleet expanded by 108% between 2018 and 2025, adding 2.6 million net operational machines to the global industrial base.
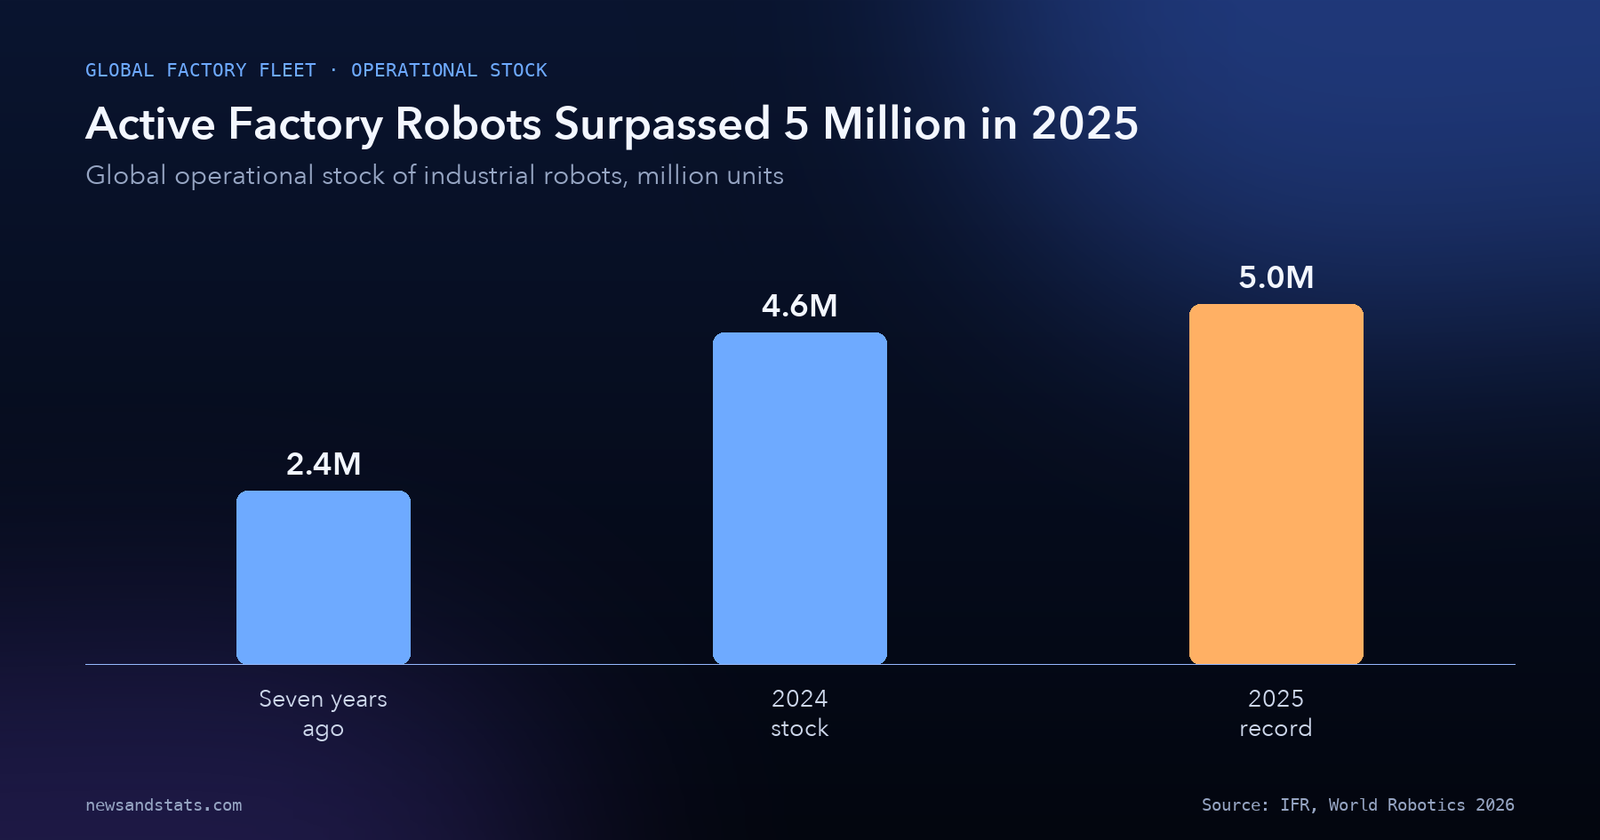
Source: IFR, World Robotics 2026 Report.
As IFR President Jane Heffner stated upon the release of the report on 24 September 2026: “Industrial automation is progressing at high speed. The new mark of five million robots operational in factories worldwide is more than double the number seven years ago. The strongest growth is taking place in Asia, followed by Americas. Europe is moving ahead more slowly.”
2. More than 600,000 units: Annual industrial robot installations hit a record
Operational fleets expand only when annual factory shipments accelerate. In 2025, factories worldwide installed more than 600,000 new industrial robots, representing an 11% jump year-on-year.
This marks the first time in history that annual global deployments broke through the 600,000-unit ceiling. The milestone follows four consecutive years in which global annual installations had hovered above 500,000 units (with 542,000 units installed in 2024 according to IFR statistical accounts).
The IFR projects that this growth trajectory will persist throughout the decade. According to its medium-term outlook, annual installations are forecast to expand by 9% in 2026 to reach 655,000 units, before climbing to 806,000 units annually by 2029.
The acceleration in factory installations is occurring in parallel with rising power requirements for automated industrial clusters. As analyzed in our review of power grid bottlenecks and infrastructure constraints, modern electrified factories with automated robotic lines, induction furnaces, and computer vision systems demand highly reliable, unconstrained substation interconnections.
3. 59%: China’s overwhelming share of global deployments
Geographically, the expansion of factory robotics is heavily skewed toward East Asia. In 2025, China alone accounted for 59% of all industrial robot installations worldwide.
Annual installations in China surged by 20% year-on-year to reach 354,000 units in 2025. That volume exceeded China’s previous all-time annual record by almost 60,000 units. To grasp the magnitude of China’s automation drive: China deployed more than nine times as many industrial robots in 2025 as the United States, and nearly ten times as many as Japan.
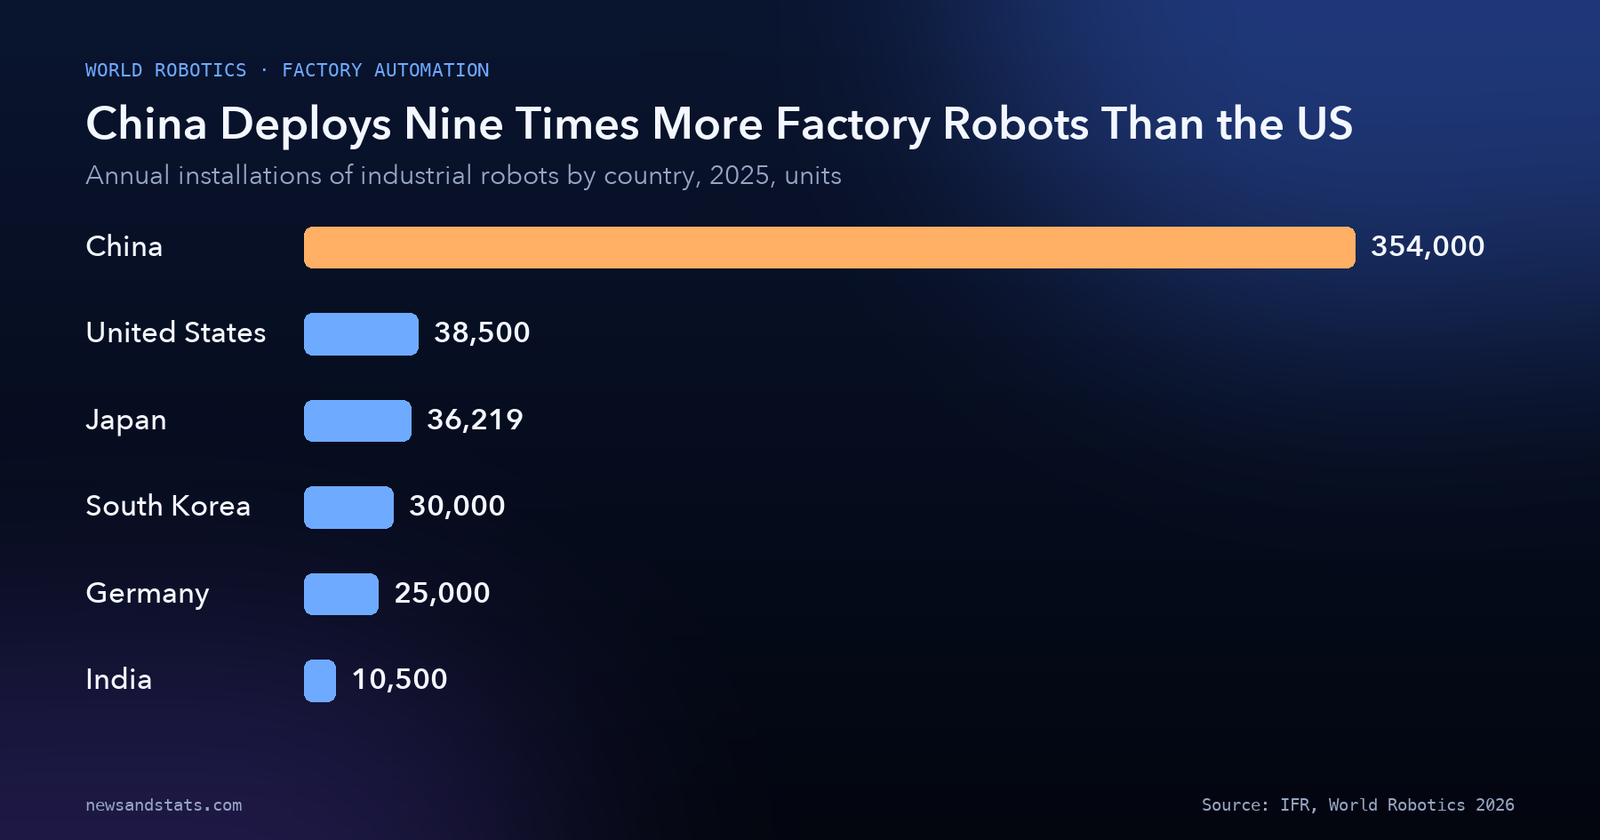
Source: IFR, World Robotics 2026 Report.
Our calculation: China’s 354,000 installations out of more than 600,000 global units represents 59% of world shipments. In 2024, China had installed 295,000 units, representing a 54% global share. China’s increase of 59,000 units in 2025 was itself larger than the entire annual robot deployment of any other nation on earth.
This deployment scale is anchored in national planning. As detailed in our analysis of the economic gap between India and China, China’s newly published 15th Five-Year Plan (spanning 2026 to 2030) places physical robotics and embodiment at the center of its modern industrial apparatus. Rather than deploying AI primarily for digital consumer software, Chinese policy mandates integrating machine learning into physical production tools, with robotics serving as the primary vehicle to offset an aging demographic profile.
4. 55%: Domestic manufacturers capture China’s home market
China’s robotics boom is no longer an import story for Japanese and European robot makers. In 2025, Chinese domestic robot manufacturers sold more industrial robots within China than all foreign suppliers combined.
According to the IFR, installations by domestic Chinese robotics brands expanded by 15% in 2025 to reach 195,000 units. This gave domestic producers a 55% share of China’s market in 2025. While that represents a minor consolidation compared to 57% in 2024, it confirms that domestic manufacturers such as Estun, Inovance, and EFORT have established structural leadership over legacy foreign competitors like Fanuc, ABB, Yaskawa, and Kuka.
Our calculation: with 195,000 domestic units installed out of 354,000 total Chinese installations, domestic brands captured 55.1% of the market, leaving 159,000 units to foreign suppliers. A decade earlier, foreign suppliers controlled the vast majority of Chinese factory installations. By pairing lower component costs with localized customer integration, Chinese robotics conglomerates have achieved scale economies that are now propelling exports into Southeast Asia, Latin America, and Europe.
5. Almost 38,500 units: The United States moves into second place
While China dominates absolute volume, the Western market experienced a notable reallocation. In 2025, the United States surpassed Japan to become the second-largest market for industrial robots in the world.
Annual installations of industrial robots in the United States grew by 12% in 2025 to reach almost 38,500 units. The IFR notes that this marks the third highest annual installation total ever recorded in United States industrial history, rebounding from a cyclical downturn in 2024.
According to preliminary data released by the IFR in its report US Robot Industry Returns to Double Digit Growth, the American automation rebound was propelled by diversification beyond automotive assembly. While the automotive industry remained the largest single customer with 13,500 units (just 1% below 2024 levels), automation in the food and beverage industry surged by 30%. The food sector reached approximately 3,000 installations in 2025, matching annual deployments in traditional metal and machinery as well as electrical-electronics manufacturing.
The adoption of smart robotics in US manufacturing relies heavily on advanced memory chips and compute hardware, as real-time edge processing and 3D machine vision replace rigid pre-programmed arm routines. In response to reshoring demand, North America’s automation trade association (A3) presented a formal “Vision for a National Robotics Strategy” to federal lawmakers, advocating the creation of a Federal Robotics Office, tax credits for automation capital expenditures, and domestic procurement preferences.
6. 36,219 units and 30,000 units: Contraction in Japan and South Korea
In contrast to North American growth, traditional East Asian manufacturing powerhouses faced headwinds. Japan, long the world’s second-largest robotics market, slipped to third place globally in 2025.
Installations in Japan fell by 19% year-on-year to 36,219 units. The IFR notes that while domestic Japanese demand is projected to recover moderately over the long term, a sharp short-term rebound remains unlikely due to restrained domestic capital investment and shifting overseas production strategies among Japanese conglomerates.
In the Republic of Korea, robot installations totaled 30,000 units in 2025, down 1% year-on-year. South Korean installations have trended sideways around 31,000 units annually since 2019, reflecting saturation in established semiconductor and battery gigafactories. However, the IFR expects Korean demand to break out of this plateau by 2027 as major new automotive investments in electric vehicle platforms come into operational effect.
7. 27% CAGR: India emerges as the fastest-growing major market
While India’s absolute deployment volume remains smaller than the top five established automation nations, its rate of acceleration is the highest among major industrial economies.
India installed almost 10,500 industrial robots in 2025, representing a 15% increase year-on-year. This pushed India into sixth place worldwide, sitting directly behind Germany.
Between 2020 and 2025, annual industrial robot installations in India expanded at a compound annual growth rate (CAGR) of 27%. That 27% CAGR outpaced every other top-ten manufacturing nation over the same five-year window.
Automotive assembly and component suppliers account for the majority of Indian deployments, but electronics manufacturing services (EMS) and metal fabrication have expanded rapidly under government production-linked incentive (PLI) schemes. For emerging manufacturing economies managing fossil fuel import price shocks, robotic automation provides a mechanism to raise factory precision, reduce material scrap rates, and meet rigorous export quality standards.
In Europe, Germany maintained its status as the fifth-largest robot market globally and the dominant automation hub in Europe, accounting for 41% of all installations across the European Union. However, German sales fell 8% in 2025 to fewer than 25,000 units, weighed down by higher energy costs and automotive sector restructuring. Elsewhere in Europe, installations fell 11% in Italy to about 7,800 units, slipped 8% in France to almost 4,500 units, and declined 15% in Spain to about 4,300 units.
8. 1,220 vs 166: The robot density paradox
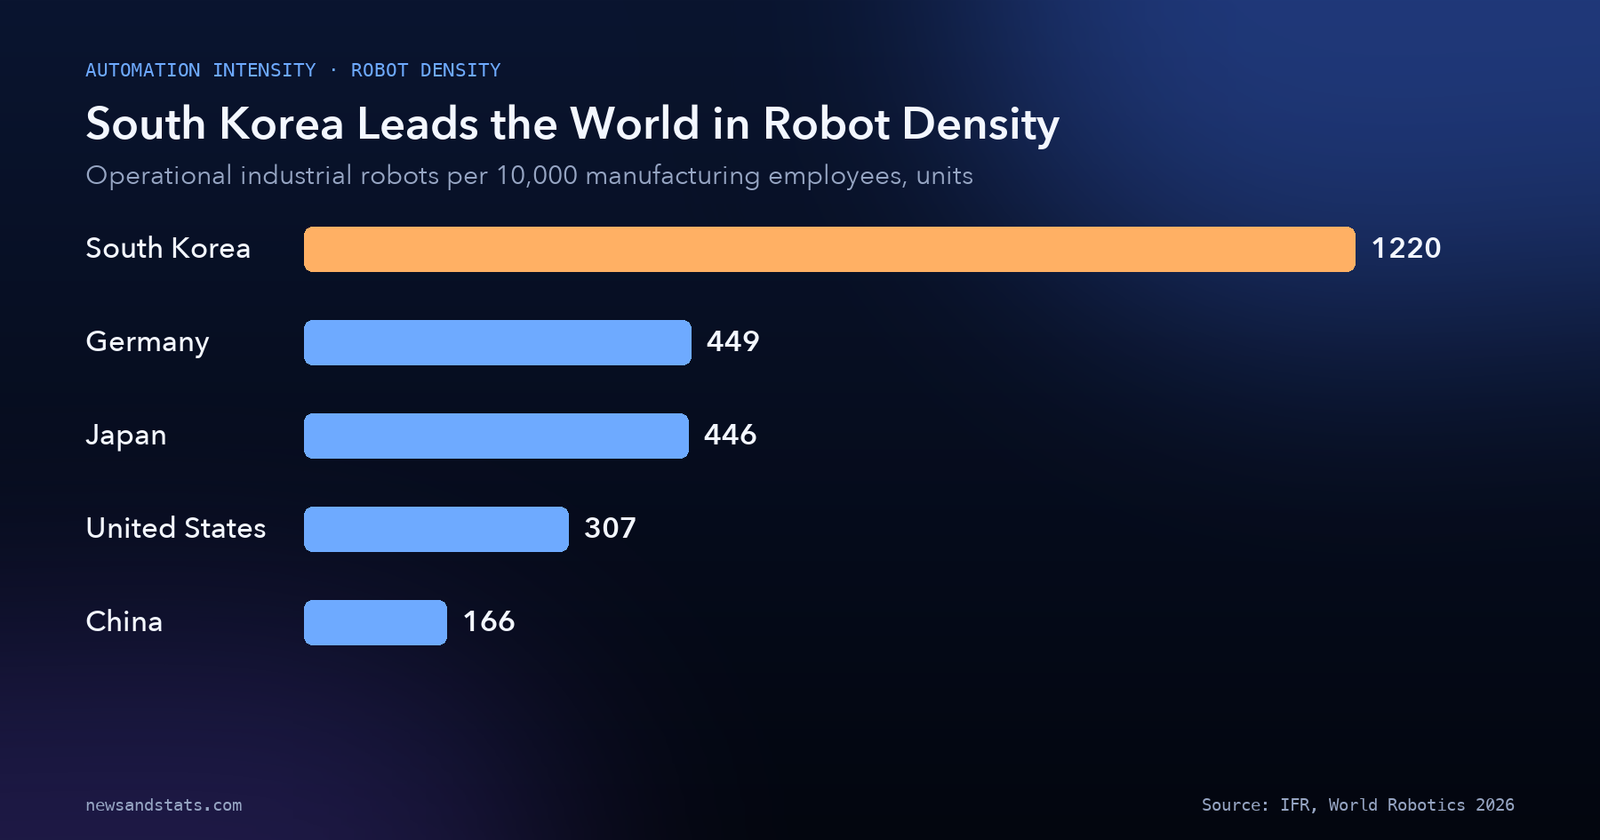
Comparing absolute installation counts creates a misleading impression of national automation intensity. Because economies differ dramatically in manufacturing workforce size, the IFR measures automation intensity through robot density: the number of operational industrial robots in use for every 10,000 employees in the manufacturing industry.
On this normalized benchmark, the global leaderboard looks entirely different:
- South Korea ranks first in the world by a wide margin, operating 1,220 industrial robots per 10,000 manufacturing employees.
- Germany ranks second among major economies with 449 robots per 10,000 workers.
- Japan follows closely with 446 robots per 10,000 workers.
- The United States ranks eighth globally with 307 robots per 10,000 workers (advancing two positions from the prior year).
- China, despite installing 59% of all new robots worldwide, records a density of 166 robots per 10,000 manufacturing workers.
Source: IFR, World Robotics 2026 Report.
Our calculation: South Korea’s robot density (1,220) is nearly four times higher than that of the United States (307) and more than seven times higher than that of China (166).
This density gap explains why China’s massive installation numbers are set to continue. Because China employs tens of millions of factory workers, reaching the automation intensity of Germany or Japan will require deploying millions of additional machines. Rather than a sign of saturation, China’s 354,000 annual installations represent an economy rapidly closing the gap between its manufacturing scale and its workforce density.
The broader institutional role of robotics standards is coordinated by the International Federation of Robotics, which brings together national robotics associations and academic bodies across more than 20 countries.
How to read the World Robotics numbers
Navigating global robotics statistics requires recognizing five analytical nuances:
- Annual installations differ from operational stock. Installations measure new machines sold and synchronized during a calendar year (over 600,000 in 2025). Operational stock measures active machines on factory floors (5 million units in 2025), adjusted for decommissioning based on an average service life of 12 years.
- Robot density normalizes for industrial scale. A large country can install hundreds of thousands of robots while maintaining low density, while a compact industrial economy like South Korea can achieve high density with a smaller absolute fleet.
- Industrial robots are distinct from service robots. Industrial robots operate in factory environments under ISO standards. Professional service robots—such as automated guided vehicles (AGVs) in logistics warehouses, which surged 24% to 250,000 units in 2025—are tracked in a separate IFR statistical module.
- Domestic market share measures origin of assembly, not component content. A Chinese domestic robot may incorporate Japanese harmonic drive gearboxes or European servomotors, while a foreign brand’s robot may be manufactured inside a Shanghai plant.
- Economic cycles drive volatile annual swings. Factory automation is a capital expenditure. High interest rates or automotive retooling delays produce sharp annual drops (such as Japan’s 19% decline in 2025) without altering multi-year automation trajectories.
The global industrial robotics landscape at a glance
The following table summarizes the primary metrics tracked in the IFR’s World Robotics 2026 report across national markets, installation growth, and automation density.
| Metric | Measured value | Year or period | Primary driver or milestone | Source |
|---|---|---|---|---|
| Global operational robot stock | 5 million units | 2025 | Surged 9% year-on-year; doubled in 7 years | IFR World Robotics 2026 |
| Global annual robot installations | >600,000 units | 2025 | Jumped 11%; first time over 600,000 | IFR World Robotics 2026 |
| Global installations forecast 2026 | 655,000 units | 2026 | Projected 9% expansion | IFR World Robotics 2026 |
| Global installations forecast 2029 | 806,000 units | 2029 | Long-term automation baseline | IFR World Robotics 2026 |
| China annual installations | 354,000 units | 2025 | Grew 20%; exceeded record by 60,000 | IFR World Robotics 2026 |
| China global installation share | 59% | 2025 | Up from 54% in 2024 | IFR World Robotics 2026 |
| China domestic brand market share | 55% (195,000 units) | 2025 | Domestic brands outsold foreign suppliers | IFR World Robotics 2026 |
| United States annual installations | ~38,500 units | 2025 | Up 12%; 2nd largest globally (surpassed Japan) | IFR World Robotics 2026 |
| Japan annual installations | 36,219 units | 2025 | Down 19%; moved from 2nd to 3rd globally | IFR World Robotics 2026 |
| South Korea annual installations | 30,000 units | 2025 | Down 1%; sideways trend around 31,000 | IFR World Robotics 2026 |
| Germany annual installations | <25,000 units | 2025 | Down 8%; 41% share of total EU market | IFR World Robotics 2026 |
| India annual installations | ~10,500 units | 2025 | Up 15%; 6th globally; 27% CAGR (2020-2025) | IFR World Robotics 2026 |
| South Korea robot density | 1,220 per 10,000 | 2025 | World leader in automation intensity | IFR World Robotics 2026 |
| Germany robot density | 449 per 10,000 | 2025 | Highest in Europe | IFR World Robotics 2026 |
| Japan robot density | 446 per 10,000 | 2025 | Close behind Germany | IFR World Robotics 2026 |
| United States robot density | 307 per 10,000 | 2025 | 8th globally; up two ranks | IFR World Robotics 2026 |
| China robot density | 166 per 10,000 | 2025 | Room for structural expansion | IFR World Robotics 2026 |
Sources: IFR, Five Million Robots now Operate in Factories Globally and US Robot Industry Returns to Double Digit Growth.
What to watch
- Whether global installations reach the IFR’s forecast of 655,000 units in 2026, confirming continued industrial automation momentum.
- The evolution of China’s domestic brand market share, monitoring whether domestic producers expand beyond 55% and increase shipments into Europe.
- United States non-automotive robotics demand, tracking whether food processing and metal fabrication maintain 30% growth rates.
- The legislative trajectory of the proposed US National Robotics Strategy, specifically whether Congress authorizes a Federal Robotics Office and automation tax credits.
- South Korea’s anticipated 2027 demand rebound, observing whether new automotive electric vehicle retooling programs lift installations above 31,000 units.
- India’s installation trajectory, assessing whether its 27% CAGR pushes the country past Germany in annual installations before 2028.
The bottom line
Factory automation reached a historic milestone in 2025 as active industrial robots hit 5 million units globally and annual installations jumped 11% to exceed 600,000 machines. China solidified its manufacturing supremacy by installing 354,000 units—capturing 59% of global deployments and deploying more than nine times as many robots as the United States. While the US climbed to second place with almost 38,500 units and South Korea maintained world-leading density at 1,220 robots per 10,000 workers, physical AI and machine vision are driving automation far beyond traditional car plants into general manufacturing. For additional analysis of workplace transformation, explore our AI & Work section, and visit our global technology supply chains reporting for deeper industry data.
Related reading
- Is AI hurting entry-level jobs? Two studies, two answers: how cognitive automation is reshaping white-collar employment.
- Data Center Power Demand Is Set to Double by 2030. The Grid Is the Bottleneck.: the physical infrastructure and power requirements behind digital transformation.
- India vs China: the economic gap in 10 numbers: industrial capacity, manufacturing output, and demographics compared.