The global trade outlook 2026 just received a sharp rewrite. In its October 2026 update, the World Trade Organization raised its forecast for world merchandise trade volume growth this year to 3.9%, more than double the 1.9% it projected back in March. The reason is not that the Middle East conflict eased. It is that a surge in AI-related investment is pulling in more imported chips, servers and data-center equipment than anyone expected, and that import demand is outweighing the drag from disrupted oil, gas and fertilizer shipments. The result is a trade economy being pulled in two directions at once: goods trade stronger than planned, services trade weaker, and one narrow category of hardware now driving nearly half of all the growth.
The global trade outlook 2026: what the WTO’s October update says
When the WTO published its previous Global Trade Outlook and Statistics report in March 2026, the Middle East conflict had only just begun, and the durability of the AI investment boom was still an open question. Its baseline scenario put 2026 merchandise trade volume growth at 1.9%, with a range running from 1.4% in a high-energy-price scenario to 2.4% in a strong-AI scenario, according to the WTO’s Global Trade Outlook and Statistics, October 2026 update.
By October, both scenarios had partly played out — and the AI scenario dominated. The updated forecast puts world merchandise trade volume growth at 3.9% in 2026 and 4.1% in 2027, up from the earlier 1.9% and 2.6%. Asian economies are expected to be the biggest contributor to that growth for the third year running, adding 4.0 percentage points of the total 3.9%, or more than all of it on their own. North America adds another 0.5 percentage points and Europe 0.1, while the “Rest of World” category — dragged down almost entirely by the Middle East — subtracts 0.7 percentage points.
The dollar value of trade moved even faster than the volume. World merchandise trade’s current-dollar value rose 15% year-on-year in the first half of 2026, against volume growth of just 3.5% over the same period — one of the largest gaps between value and volume growth the WTO has recorded in recent years, reflecting higher prices for fuels and for the electronic components that go into data centers.
Services trade is moving the other way
Not every part of trade got a lift. The WTO now expects commercial services trade volume growth to slow to 3.3% in 2026, down from the 4.8% it had projected in March, before rebounding to 6.4% in 2027. The culprit is the Middle East conflict, which has depressed travel and transport in a region that serves as a hub for both. Forecast growth in transport services for 2026 was cut to 0.9%, and travel services to just 0.2%. “Other commercial services” — a category that includes digitally delivered services such as software and cloud computing — is expected to hold up far better, growing 4.8% in 2026, because it is less exposed to the conflict and more tied to the same AI investment lifting goods trade.
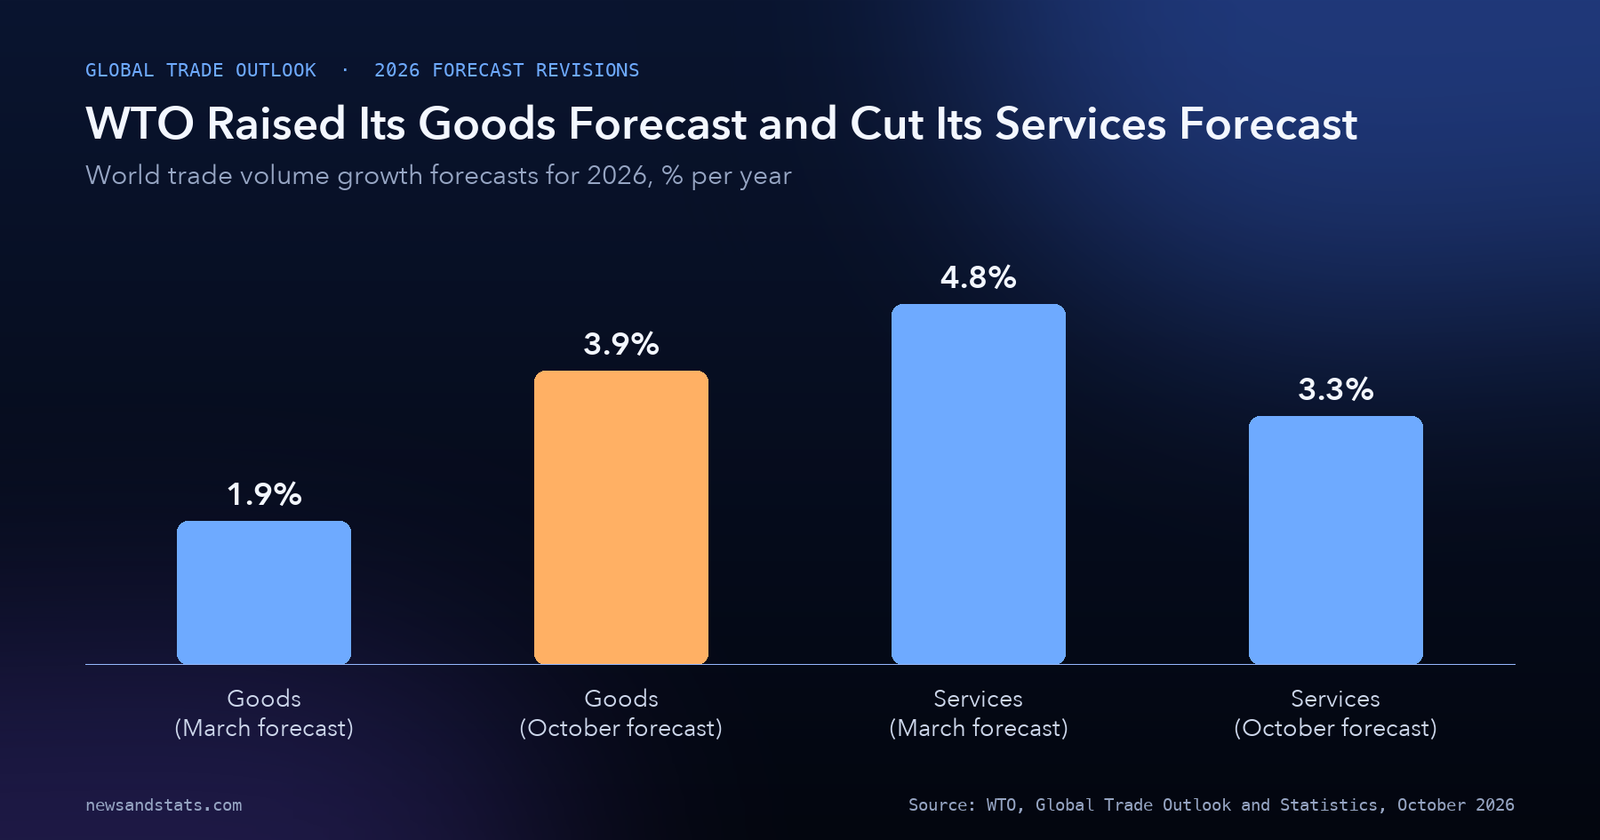
Source: WTO, Global Trade Outlook and Statistics, October 2026, Executive summary and Table 1.
Put goods and services together, and the WTO expects total world trade in goods and services to grow by approximately 3.7% in 2026 and 4.7% in 2027 — both comfortably above its estimate of world GDP growth of 2.6% in 2026 and 2.9% in 2027. Trade growing faster than output is partly a reflection of how AI-related investment is being funded: it draws in more imports per dollar spent than most other kinds of spending.
Who actually trades the most: the world’s top exporters and importers
Behind the growth rates sits a world merchandise trade system still dominated by a handful of economies. China remained the single largest exporter of goods in 2025, at $3,771 billion, 14.4% of the world total, with the United States the largest importer, at $3,505 billion, 13.2% of the total. The next table shows the top five on each side.
| Rank | Top exporters, 2025 | Value ($ billion) | Share | Rank | Top importers, 2025 | Value ($ billion) | Share |
|---|---|---|---|---|---|---|---|
| 1 | China | 3,771 | 14.4% | 1 | United States | 3,505 | 13.2% |
| 2 | United States | 2,180 | 8.3% | 2 | China | 2,588 | 9.7% |
| 3 | Germany | 1,765 | 6.7% | 3 | Germany | 1,538 | 5.8% |
| 4 | Netherlands | 989 | 3.8% | 4 | United Kingdom | 949 | 3.6% |
| 5 | Hong Kong, China | 754 | 2.9% | 5 | Netherlands | 873 | 3.3% |
Source: WTO, Global Trade Outlook and Statistics, October 2026, Appendix Table 1.
The top 30 exporters together account for 83.4% of world merchandise exports, and the top 30 importers for 82.2% of world imports — a level of concentration that has shifted only gradually over the years, even as the identity of the fastest-growing exporters (discussed below) changes quickly. For more on how two of the economies in that table, China and India, compare on the broader numbers, see our piece on India vs China’s export economies.
The real engine: an AI investment boom, not a broader expansion
The WTO is explicit about what changed between March and October: a “stronger-than-expected surge in AI-related capital investment.” Estimates of just the US side of that spending vary by source, but point in the same direction. The WTO report cites estimates of $660 billion to $690 billion from Futurum Group and $725 billion to $765 billion from Goldman Sachs Research for 2026 hyperscaler AI capital expenditure — companies such as Amazon, Google, Meta, Microsoft and Oracle building out data centers, servers and networking equipment — a 77% increase on 2025 spending by either measure. The United States accounts for between two-thirds and three-quarters of global spending in this category, and worldwide AI infrastructure spending is expected to rise by at least 30% in 2026 compared with 2025. We covered the company-by-company breakdown of that spending in our hyperscaler capex bet piece; this report shows what that spending is doing to trade statistics once the equipment crosses a border.
It is worth being precise about what the WTO’s GDP figures do and do not mean. The 2.6% global GDP growth estimate used in this report is the WTO’s own consensus estimate, built by combining data from the OECD, World Bank, IMF, UN and national statistical offices — it is not the IMF’s own forecast, which can differ. Readers who want the IMF’s specific projections should see our look at the IMF’s October outlook, published two days before this WTO update.
AI-enabling goods: from a rounding error to 14.8% of world trade
The WTO’s report includes a dedicated chapter measuring trade in what it calls “AI-enabling goods” — the raw materials, intermediate inputs and finished products that support the development and production of AI technologies, from refined critical minerals through chips, boards, servers, and the power, cooling and networking equipment that feed the data centers these goods build. Because no customs code simply says “AI,” the WTO’s economists built a list of product codes to track it, refining an earlier list first published in the WTO’s World Trade Report 2025.
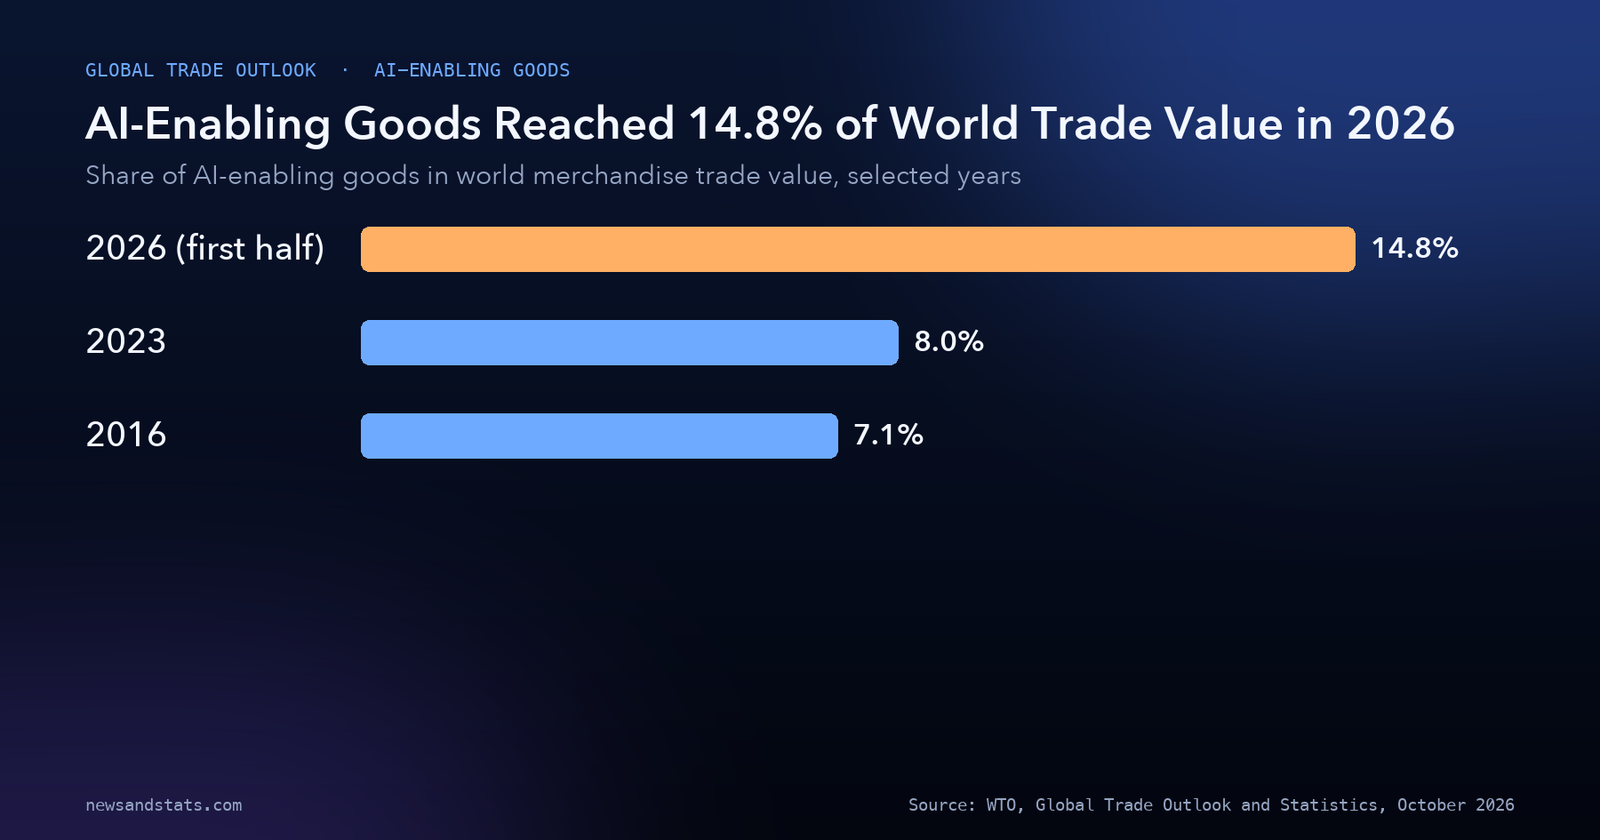
Trade in those goods used to move roughly in line with the rest of merchandise trade. That stopped in 2024. After falling 10% in 2023, AI-enabling goods trade grew 16% in 2024, 31% in 2025 and 67% in the first half of 2026, measured in US dollar value terms. Its share of world merchandise trade value, which had sat at 7.1% in 2016 and only 8.0% in 2023, jumped to 14.8% in the first half of 2026.
Source: WTO, Global Trade Outlook and Statistics, October 2026, Analytical chapter on AI-enabling goods trade, p. 32.
The growth has an outsized effect on the headline trade numbers because of how fast it is moving: even though AI-enabling goods still make up less than 15% of world trade, they accounted for 47% of the total growth in world merchandise trade value in the first half of 2026. Part of that expansion reflects genuinely higher volumes of chips and servers moving across borders, but part of it is price. The European Central Bank estimates import prices for AI-enabling goods rose about 10% year-on-year in 2025 and 20% to 30% year-on-year in the first half of 2026, according to the figure the WTO cites from that research — a reminder that a dollar-value growth rate is not the same thing as a volume growth rate.
A boom concentrated in a few hands
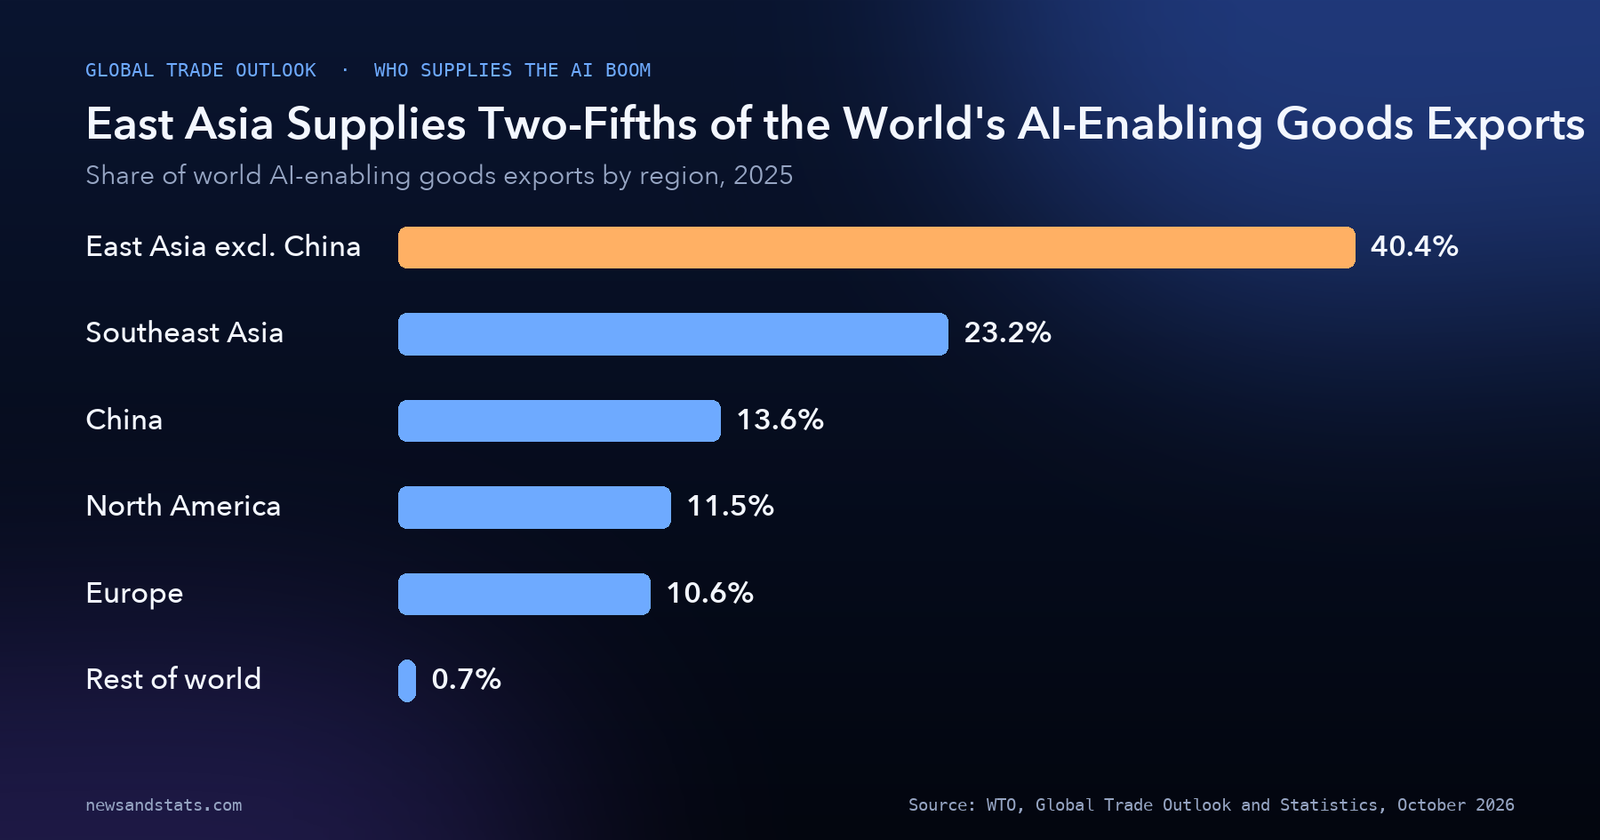
Trade in AI-enabling goods is unusually concentrated, and the concentration is rising. In 2025, the top 10 traders of these goods accounted for around 85% of world exports and about 80% of world imports — roughly twice the concentration seen in overall merchandise trade. By region, East Asia excluding China supplied 40.4% of world AI-enabling goods exports in 2025, against only 10.8% of overall merchandise exports; Southeast Asia supplied 23.2%, against 8.1% of overall exports. China’s and North America’s shares of AI-enabling exports were close to their overall trade shares (13.6% versus 14.4% for China, 11.5% versus 13% for North America), while Europe’s share of AI-enabling exports, at 10.6%, was far below its 35.5% share of overall merchandise exports — a gap tied to where the memory-chip shortage we covered separately is actually concentrated.
Source: WTO, Global Trade Outlook and Statistics, October 2026, Chart 24 and accompanying text, pp. 32-33.
On the import side, China takes in 20.1% of world AI-enabling goods imports against only 9.7% of overall imports, and North America takes 19.9% against 17.9% of overall imports — both regions pulling in more of these specific goods than their overall trade weight would suggest, because both are building out AI infrastructure or supplying it. Europe’s import share of AI-enabling goods, 12.3%, is about a third of its 35.9% share of overall imports. The pattern since 2015 shows US imports of AI-enabling goods shifting increasingly toward East Asia excluding China, Southeast Asia and the rest of North America, consistent with how hyperscaler data-center build-outs source their hardware, while the share of this trade running through China directly has been declining, except for Southeast Asian imports from China.
The Middle East conflict’s toll on trade and prices
None of the AI-driven growth erases what the conflict in the Middle East has done to trade in and around the region. The WTO’s updated forecast puts Middle East merchandise export volume growth at -17.2% for 2026 (against a pre-conflict projection of positive growth) and import volume growth at -15.4%. Quarterly data show how sharply the shock has deepened: year-on-year export growth in the Middle East fell from 13.9% in the fourth quarter of 2025 to -9.5% in the first quarter of 2026, and to -27.7% in the second quarter, as the conflict that began in March took hold. The region’s GDP is forecast to contract 4.0% in 2026 as a result, and services exports from the region are forecast to fall 10.3% for the year, worse than the 9.2% drop the WTO had projected in March.
The mechanism runs largely through energy. According to the International Energy Agency’s figures as cited in the WTO report, about 20 million barrels of oil a day transited the Strait of Hormuz before the conflict; an estimated 3.5 to 5.5 million barrels a day were diverted through pipelines via Saudi Arabia to the Red Sea and via the United Arab Emirates to the port of Fujairah, through September, before further escalation disrupted the Red Sea route as well. Brent crude peaked at $138 a barrel on 8 April 2026, up from roughly $70 before the conflict began, then fell to around $75 after the United States and Iran signed a memorandum of understanding in June. By the time this October report was being finalized, the WTO describes prices as having climbed back to around $100. For a detailed, country-by-country look at who is absorbing those costs, see our earlier piece on who pays for the 2026 energy shock, and for the natural-gas side of the disruption, see the global LNG supply wave, since LNG, unlike oil, cannot easily be rerouted through pipelines when shipping lanes are disrupted.
The energy shock has also pushed up inflation forecasts. Before the conflict, the WTO says global headline inflation for 2026 was projected to decline to 3.7%; it has since been revised up to 4.7% for the year, feeding into higher market interest rates as well.
Beneath the headline numbers, US-China trade keeps splitting apart
A separate, slower-moving story runs underneath this year’s AI-and-conflict narrative: the continued decoupling of US-China trade. The WTO’s analysis finds that US imports from China fell 29% in 2025, cutting China’s share of US imports from 13.8% to 9.3% — compared with a share of more than 20% before 2018. Trade between the two countries appears to have only marginally stabilized in 2026 after that sharp 2025 drop. Unlike the broader pattern of trade splitting along geopolitical lines — which the WTO finds has actually narrowed somewhat in 2025 and into 2026, as the gap between trade within blocs of geopolitically aligned economies and trade between them has not kept widening — the US-China decoupling cuts across every product category and is most pronounced for the most complex, technologically advanced products.
What to watch
- Whether the AI investment boom continues at its current pace. The WTO explicitly flags a slowdown or reversal of AI investment spending as a risk to the 2026 and 2027 forecasts, given how import-intensive that spending has become.
- Whether the Middle East conflict is resolved. The WTO’s more optimistic 2027 forecasts for both merchandise and services trade, and for the Middle East’s own GDP and exports, are explicitly conditioned on a “timely resolution” of the conflict.
- The gap between crude oil and refined-product prices. The WTO flags the persistent “crack spread” between crude and products such as gasoline and jet fuel, a sign of refinery bottlenecks, as a continuing drag on household purchasing power and trade growth.
- Whether AI-enabling goods trade keeps outpacing total trade. A share that rose from 8.0% to 14.8% of world merchandise trade value in under three years is a trend worth tracking for whether it keeps accelerating, plateaus, or partly reflects a price bubble in chip and memory costs.
- US-China trade stabilization. Whether the marginal stabilization seen so far in 2026, after a 29% drop in US imports from China in 2025, holds or reverses.
The bottom line
World trade in 2026 is growing faster than almost anyone expected in March — not despite the Middle East conflict, but alongside it, because a surge in AI-related investment has pulled in more imported hardware than the conflict’s energy disruptions have taken away. That growth is narrow: a category of goods that is still under 15% of world trade produced nearly half of this year’s growth, and the supply of that category is unusually concentrated in East Asia. Meanwhile, the Middle East’s own trade is shrinking sharply, services growth has cooled, and a slower, separate story of US-China decoupling continues underneath both trends. Whether 2026’s trade growth holds up in 2027 depends on two things the WTO itself flags as uncertain: whether the AI investment boom keeps its pace, and whether the conflict behind the energy shock is resolved.
Related reading
- The world economy in 8 numbers: what the IMF’s October 2026 outlook says: the IMF’s own GDP growth forecasts, for comparison with the WTO’s consensus estimate used here.
- Who pays for the 2026 energy shock? The numbers, country by country: a country-by-country look at the energy costs behind the Middle East trade collapse described above.
- The $750 billion AI bet: who spends it, and who pays: the company-level breakdown of the hyperscaler spending driving AI-enabling goods trade.
- Why memory chips got so expensive: the DRAM shortage in numbers: more on the chip shortages behind the AI-enabling goods price increases noted above.