After eight months of acute volatility and fears of an enduring energy deficit, the global petroleum complex has reached a decisive structural turning point.
According to the latest iea oil market report published by the International Energy Agency on 13 November 2026, global oil production has officially surpassed consumption for the first time since the outbreak of regional hostilities in the Middle East. Titled Straightening out, the report details how a dramatic resurgence in Gulf exports, combined with sustained output growth across the Americas, generated an unprecedented supply surge that flipped physical market balances into a net surplus heading into the fourth quarter of 2026.
Worldwide oil output surged by 2.3 million barrels per day (mb/d) in October to reach 105.4 mb/d, lifting global production by an extraordinary 5.3 mb/d since August. In response to this influx of crude, physical benchmark prices experienced their sharpest downward correction of the year: North Sea Dated crude plunged by 32%, sliding from an early October peak of $136 per barrel ($136/bbl) to $93/bbl by mid-November.
Yet the headline price retreat conceals severe underlying asymmetries. While crude supplies have expanded, global on-land inventories remain at their lowest levels in a decade, and the international refining complex is struggling with acute bottlenecks. Persistent disruptions to Russian refinery infrastructure and constrained Gulf processing have left diesel prices stranded near $180/bbl—77% above pre-war levels.
1. The 5.3 mb/d supply surge: from deficit to surplus
The primary catalyst behind the market’s rapid turnaround is a sudden, aggressive recovery in physical crude extraction and maritime loadings.
Between August and October 2026, global petroleum supplies expanded by 5.3 mb/d, rising from an implied production level of 100.1 mb/d in August (my calculation) to 105.4 mb/d in October. This marked one of the fastest two-month volume expansions in the history of commercial oil markets. A 3.0 mb/d increase in September was followed by an additional 2.3 mb/d surge in October, driven by a rapid restoration of loading operations across Persian Gulf terminals.
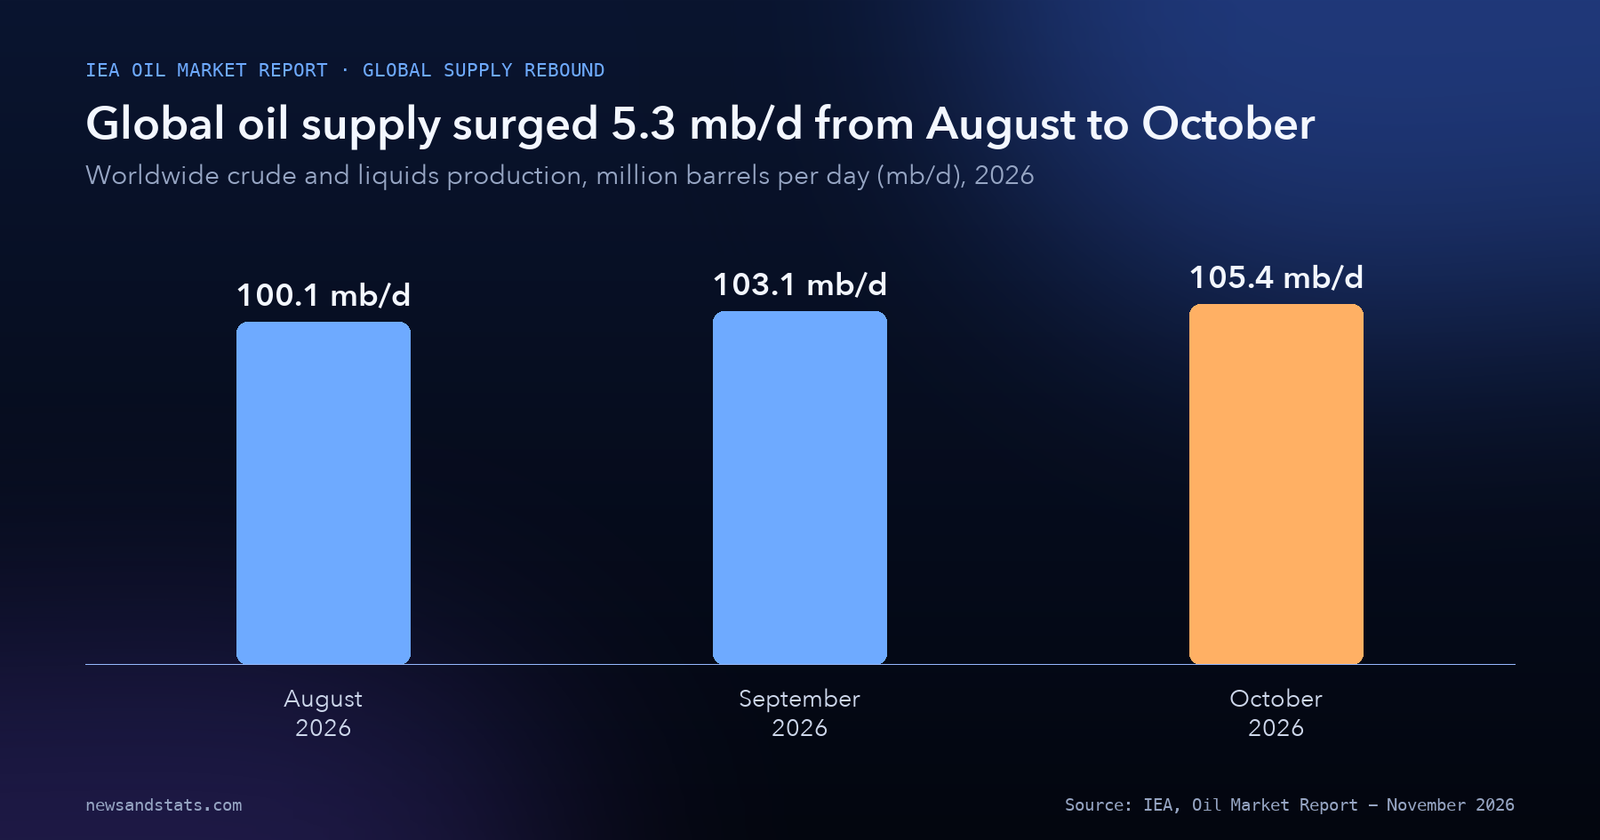
Source: IEA, Oil Market Report – November 2026, global oil supply overview.
This rapid recovery narrowed the year-on-year global production decline to 2.9 mb/d in October, compared with an average year-on-year loss of 8.0 mb/d between March and September. Gulf oil exports, excluding Oman, climbed to 18.4 mb/d during October. While this total remains 26% below pre-war levels, physical crude oil flows specifically jumped to 15.0 mb/d, equivalent to 82% of pre-war volumes.
The sheer scale of this recovery prompted the IEA to revise its fourth-quarter 2026 global supply forecast upward by 3.3 mb/d. Over the full calendar year of 2026, worldwide oil supply is now projected to contract by an average of 4.8 mb/d, before rebounding by 6.6 mb/d in 2027 to reach an average of 108.1 mb/d.
As observed in our earlier analysis of the global LNG supply wave, supply interruptions in critical energy waterways create violent short-term dislocations, but upstream producers ultimately deploy alternative routing and deferred production capacity to restore market equilibrium once immediate security risks stabilize.
2. A 32% price collapse: North Sea Dated tumbles to $93/bbl
The return of 5.3 mb/d of crude to physical trade channels punctured the speculative risk premium that had gripped international financial markets since early autumn.
On 8 October 2026, North Sea Dated crude oil—the primary physical benchmark against which more than two-thirds of the world’s crude is priced—peaked at $136/bbl amid widespread panic over potential infrastructure destruction in the Persian Gulf. By mid-November 2026, Dated Brent had tumbled by 32%, shedding $43/bbl (my calculation) to trade at $93/bbl.

Source: IEA, Oil Market Report – November 2026, benchmark crude oil pricing section.
This represents an extraordinary 21-percentage-point divergence from refined products (my calculation), as crude prices fell three times faster than consumer fuels. Even after this 32% decline, however, crude prices remain $22/bbl above pre-war baselines. Subtracting this $22/bbl premium from the current $93/bbl spot price reveals an underlying pre-war price baseline of $71/bbl (my calculation).
This price collapse brings substantial relief to energy-importing nations that endured punishing foreign exchange drains during the summer. As documented in our investigation into who pays for the 2026 energy shock, elevated crude prices imposed tens of billions of dollars in unbudgeted import costs across developing economies. The retreat toward $93/bbl significantly reduces sovereign subsidy burdens and calms imported inflation.
However, maritime shipping costs continue to distort landed crude economics. While freight rates for mid-sized Aframax and Suezmax tankers softened during October, charter rates for Very Large Crude Carriers (VLCCs) moving crude from the Middle East to Asia remained pinned near historic records, eroding margins for Asian coastal refiners.
3. The 462-million-barrel inventory draw and the on-land depletion
While the market balance has shifted into surplus on paper, the physical safety cushion of global petroleum stocks has been hollowed out.
In October 2026, observed global oil inventories increased by 52 million barrels (mb), equivalent to a build of 1.7 mb/d. This represented the first monthly net inventory expansion recorded since June 2026. However, the composition of this inventory build reveals severe structural vulnerability.
The entire October build was concentrated at sea. Oil on water surged by 86 mb to reach its highest level since January 2026, as millions of barrels of newly loaded Gulf crude entered transit. In contrast, on-land inventories continued their steep descent:
- Total on-land commercial and strategic stocks fell further in October, remaining at their lowest absolute level since at least 2016.
- Total OECD oil inventories declined by 47 mb during the month.
- OECD commercial industry stocks accounted for 41 mb of that decline, dropping far below five-year historical averages.
- Cumulatively since the outbreak of regional hostilities in early 2026, observed global oil inventories have plunged by 462 mb.
This inventory drawdown demonstrates why energy markets remain sensitive to supply shocks despite the recent price collapse. The world has burned through nearly half a billion barrels of reserves to cushion the deficit over the past eight months.
As detailed in our research on maritime trade chokepoints and rerouting, when tankers are forced to navigate extended oceanic detours or sit idle awaiting secure escort corridors, oil is locked in floating transit rather than arriving at commercial tank farms. Refiners are operating with razor-thin on-land crude cover, leaving zero buffer against unexpected winter outages.
4. The diesel disconnect: why product tightness persists at $180/bbl
The most critical operational insight in the IEA’s November report is the widening disconnect between upstream crude availability and downstream refined product markets.
While crude oil prices plunged by 32%, wholesale diesel prices fell by only 11% in Europe over the same timeframe. At approximately $180/bbl, European diesel remains 77% above pre-war price levels. Subtracting the implied baseline shows that pre-war European diesel traded near $102/bbl (my calculation). The premium of finished diesel over crude oil—known in the refining industry as the diesel crack spread—has expanded to historic levels near $87/bbl (my calculation).
This product tightness is driven by a convergence of severe refining bottlenecks across three continents:
- Refinery crude throughput contractions: Global refinery processing runs fell by 1.3 mb/d month-on-month in October to a seasonal low of 81.3 mb/d. Global runs are forecast to contract by an average of 2.2 mb/d over full-year 2026, before recovering by 2.5 mb/d in 2027 to reach 84.3 mb/d.
- Russian refining degradation: Ukrainian long-range drone strikes have inflicted structural damage on major Russian conversion units, severely degrading the country’s diesel export capability and keeping export volumes constrained regardless of policy announcements.
- Gulf product processing delays: While Gulf crude export terminals recovered rapidly to 15.0 mb/d, refined product and LPG export facilities remain damaged, running at roughly half of pre-war throughput.
- Freight and feedstock friction: High tanker freight rates crushed refining margins in Asia and Europe, preventing refiners from importing alternative crude grades to maximize middle distillate output.
This dynamic aligns with our broader findings on the surge in global commodity prices, where refined fuels and energy-intensive inputs exhibited persistent inflation even as raw mineral benchmarks stabilized. Because diesel powers freight trucking, container rail, agricultural harvesting, and industrial mining, $180/bbl diesel sustains broad-based inflationary pressure across the real economy.
To prevent critical winter supply disruptions, the IEA confirmed that member governments are accelerating the release of emergency diesel stocks under the Collective Action framework established on 11 March 2026, bridging the supply deficit until global refinery runs rebound to a projected 84.7 mb/d in December.
5. OPEC+ crude supply dynamics: Gulf rebounds while quotas lag
The November report provides field-by-field production data for the OPEC+ alliance, illustrating how member states responded to the supply deficit in October 2026.
Total OPEC+ crude oil output reached 37.72 mb/d in October, rising from 35.71 mb/d in September. Within this total, the core OPEC-8 group produced 19.55 mb/d, while non-OPEC partners contributed 13.89 mb/d. Exempt producers—Iran, Libya, and Venezuela—pumped a combined 4.28 mb/d.
| OPEC+ member nation | September 2026 supply | October 2026 supply | October target gap | Implied target | Sustainable capacity | Effective spare capacity |
|---|---|---|---|---|---|---|
| Saudi Arabia | 8.93 mb/d | 9.99 mb/d | -0.48 mb/d | 10.48 mb/d | 12.11 mb/d | Available buffer |
| Russia | 8.52 mb/d | 8.73 mb/d | -1.22 mb/d | 9.95 mb/d | 9.30 mb/d | Available buffer |
| Iraq | 4.06 mb/d | 4.60 mb/d | +0.17 mb/d | 4.43 mb/d | 4.87 mb/d | Available buffer |
| Kuwait | 1.58 mb/d | 2.03 mb/d | -0.65 mb/d | 2.68 mb/d | 2.88 mb/d | Available buffer |
| Iran (exempt) | 1.94 mb/d | 1.86 mb/d | N/A | N/A | 3.80 mb/d | Shut-in capacity |
| Kazakhstan | 1.88 mb/d | 1.76 mb/d | +0.13 mb/d | 1.63 mb/d | 1.94 mb/d | 0.18 mb/d |
| Nigeria | 1.48 mb/d | 1.44 mb/d | -0.06 mb/d | 1.50 mb/d | 1.52 mb/d | 0.08 mb/d |
| Mexico (exempt) | 1.38 mb/d | 1.37 mb/d | N/A | N/A | 1.41 mb/d | 0.04 mb/d |
| Libya (exempt) | 1.26 mb/d | 1.28 mb/d | N/A | N/A | 1.34 mb/d | 0.06 mb/d |
| Venezuela (exempt) | 1.16 mb/d | 1.14 mb/d | N/A | N/A | 1.12 mb/d | 0.00 mb/d |
| Algeria | 0.98 mb/d | 0.98 mb/d | -0.03 mb/d | 1.01 mb/d | 1.01 mb/d | 0.03 mb/d |
| Oman | 0.89 mb/d | 0.88 mb/d | +0.04 mb/d | 0.84 mb/d | 0.90 mb/d | Available buffer |
| Total OPEC+ alliance | 35.71 mb/d | 37.72 mb/d | -2.39 mb/d | 34.45 mb/d | 44.05 mb/d | 0.45 mb/d |
Source: IEA, Oil Market Report – November 2026, Table 1: OPEC+ Crude Oil Production.

Source: IEA, Oil Market Report – November 2026, Table 1: OPEC+ crude oil production breakdown.
The field data highlights three distinct operational dynamics within OPEC+:
- Saudi Arabia’s production swing: Saudi Aramco increased crude extraction by 1.06 mb/d month-on-month, pumping 9.99 mb/d in October compared to 8.93 mb/d in September. Despite this expansion, Saudi output remained 480,000 barrels per day below its implied quota target of 10.48 mb/d.
- Iraq and Kuwait restoration: Iraqi production rose by 540,000 b/d to 4.60 mb/d, exceeding its implied quota target by 170,000 b/d. Kuwait ramped output by 450,000 b/d to 2.03 mb/d, though remaining well below its sustainable capacity of 2.88 mb/d.
- Sanctioned and constrained barrels: Russian crude output rose modestly to 8.73 mb/d, lagging 1.22 mb/d below its implied target of 9.95 mb/d due to infrastructure bottlenecks and upstream maintenance. Iranian supply slipped from 1.94 mb/d to 1.86 mb/d, constrained by maritime export blockades.
Across the 18 members bound by quota agreements, OPEC+ produced 32.07 mb/d in October—lagging 2.39 mb/d below official production targets. Subtracting current October output of 37.72 mb/d from total sustainable capacity of 44.05 mb/d indicates a nominal theoretical capacity buffer of 6.33 mb/d (my calculation). However, the IEA notes that effective spare capacity that can be brought online within 90 days across non-shut-in fields stands at just 450,000 barrels per day (0.45 mb/d).
6. The Americas Quintet: non-OPEC expansion adds 1.6 mb/d
While headline attention focused on Gulf restoration, the structural bedrock supporting the global oil balance in 2026 is non-OPEC production growth from the Western Hemisphere.
The IEA highlights the pivotal role played by the “Americas Quintet”—a coalition of five non-OPEC producers comprising the United States, Canada, Brazil, Argentina, and Guyana:
- In 2026, the Americas Quintet is on track to expand crude and liquids output by 1.6 mb/d, partially offsetting the 4.8 mb/d annual loss from the Middle East and Russia.
- In 2027, the Quintet will contribute an additional 1.1 mb/d of new supply.
- Non-OPEC supply growth, combined with a 5.3 mb/d anticipated recovery in Gulf output, will lift total global oil supply by 6.6 mb/d in 2027 to 108.1 mb/d.
In the United States, Atlantic Basin and Gulf Coast refineries have run at maximum capacity, leveraging discounted domestic sweet crude to capture record refining margins while maximizing fuel exports to Europe and Latin America. In Guyana, offshore deepwater developments in the Stabroek block continue to beat commissioning schedules, while Brazilian pre-salt floating production, storage, and offloading (FPSO) units maintain steady ramp-ups.
This non-OPEC expansion ensures that even if geopolitical tensions in the Persian Gulf flare intermittently, structural supply additions will continue to expand the global production base throughout 2027.
7. Global demand drag: how structural efficiency limits recovery
On the consumption side of the balance sheet, the IEA’s November data reveals that high prices and economic friction have caused substantial demand destruction.
Worldwide oil demand is forecast to contract by 2.7 mb/d in 2026 to average 102.3 mb/d:
- Year-on-year demand contractions reached 5.0 mb/d in the second quarter of 2026 and 3.8 mb/d in the third quarter.
- The contraction will narrow to 2.7 mb/d in the fourth quarter of 2026 as export flows stabilize.
- In 2027, global oil demand is projected to rebound by 2.0 mb/d, remaining below 2025 pre-crisis consumption.
Importantly, the composition of 2027 demand growth is heavily skewed toward industrial chemicals rather than mobility fuels. Petrochemical feedstocks—specifically liquefied petroleum gas (LPG), ethane, and naphtha—will account for roughly 80% of total oil demand growth next year as disrupted Gulf export supply chains normalize.
Conversely, road transportation fuels will see negligible demand growth. The IEA notes that eight months of elevated retail gasoline and diesel prices have accelerated structural energy transition dynamics.
As detailed in our analysis of rapid global adoption of electric vehicles, sustained fuel price spikes permanently alter commercial fleet purchasing decisions. Fleet operators in China, Europe, and the United States accelerated transitions to commercial electric vans, battery-powered heavy trucks, and hybrid powertrains, while passenger car electrification permanently displaces hundreds of thousands of barrels per day of internal combustion fuel demand.
What to watch
- The December refinery rebound: Watch whether global refinery crude throughputs reach the IEA’s projected 84.7 mb/d in December, easing current middle distillate supply deficits.
- European diesel crack spreads: Monitor whether European wholesale diesel prices decline from $180/bbl toward historical parity with crude as emergency IEA diesel reserves enter physical channels.
- On-land commercial inventory stabilization: Track weekly OECD petroleum inventory statistics to observe when the 462 mb cumulative inventory drain ceases and on-land tanks begin building from decade lows.
- VLCC tanker freight rate normalisation: Follow tanker charter costs for Persian Gulf to East Asia routes; sustained high freight rates will continue to suppress Asian refining margins despite cheaper crude.
- Americas Quintet upstream capital expenditure: Assess whether non-OPEC producers in the United States, Guyana, and Brazil sustain upstream drilling momentum as benchmark crude retreats toward $93/bbl.
The bottom line
The global petroleum complex has shifted from acute deficit into physical rebalancing. Driven by a 5.3 mb/d supply surge from August to October and sustained non-OPEC expansion from the Americas Quintet, worldwide crude production reached 105.4 mb/d, prompting a 32% collapse in Dated Brent prices to $93/bbl. However, with cumulative global stocks drawn down by 462 mb and refinery bottlenecks keeping diesel stranded near $180/bbl, the energy system remains vulnerable until downstream conversion units and on-land inventories are fully rebuilt. For ongoing coverage of energy infrastructure and global manufacturing, visit our Industries section.
Related reading
- Who pays for the 2026 energy shock? The numbers, country by country: sovereign fiscal exposure and fuel subsidy stress across emerging economies.
- The Global LNG Supply Wave Is Still Coming, but the Gulf Outage Has Delayed Its Relief: liquefaction timelines, feedgas infrastructure, and natural gas market dynamics.
- Global Maritime Trade in 8 Numbers: How Chokepoint Rerouting Reshapes Shipping: container freight shifts, tanker routing bottlenecks, and global ton-mile expansion.
- Global Electric Car Sales in 8 Numbers: China Produces 75% of EVs as Exports Surge: vehicle electrification milestones and long-term oil displacement trends.