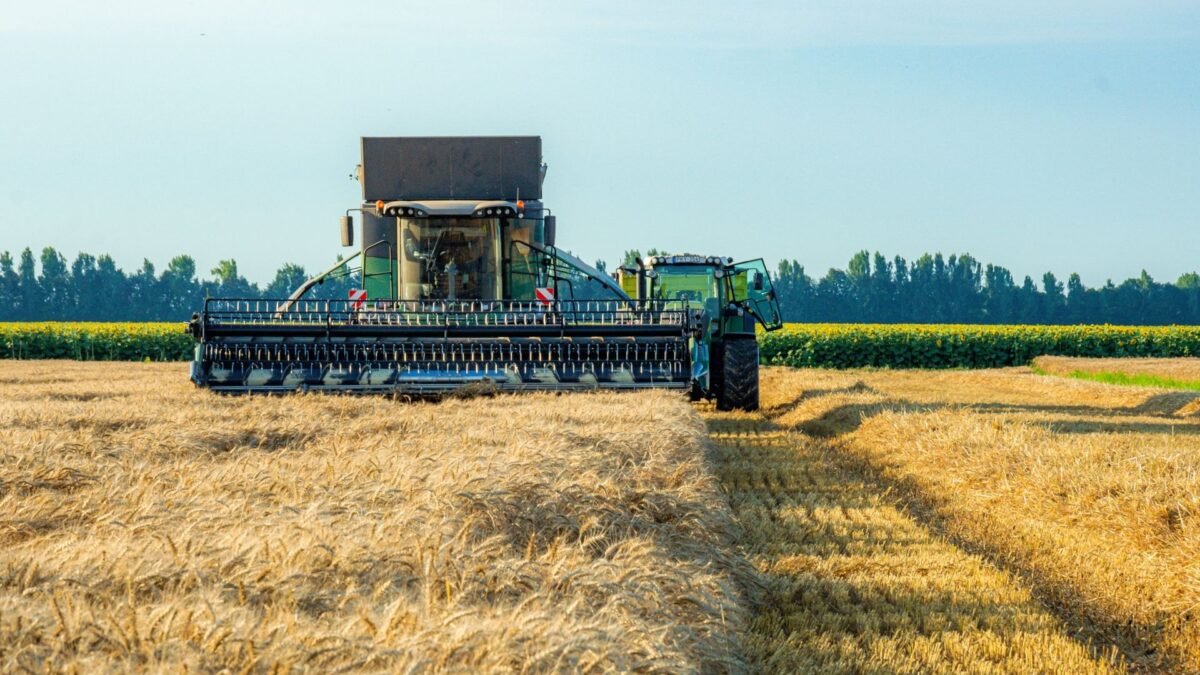
Global food commodity markets experienced modest downward relief in late autumn, pausing a three-month inflationary climb.
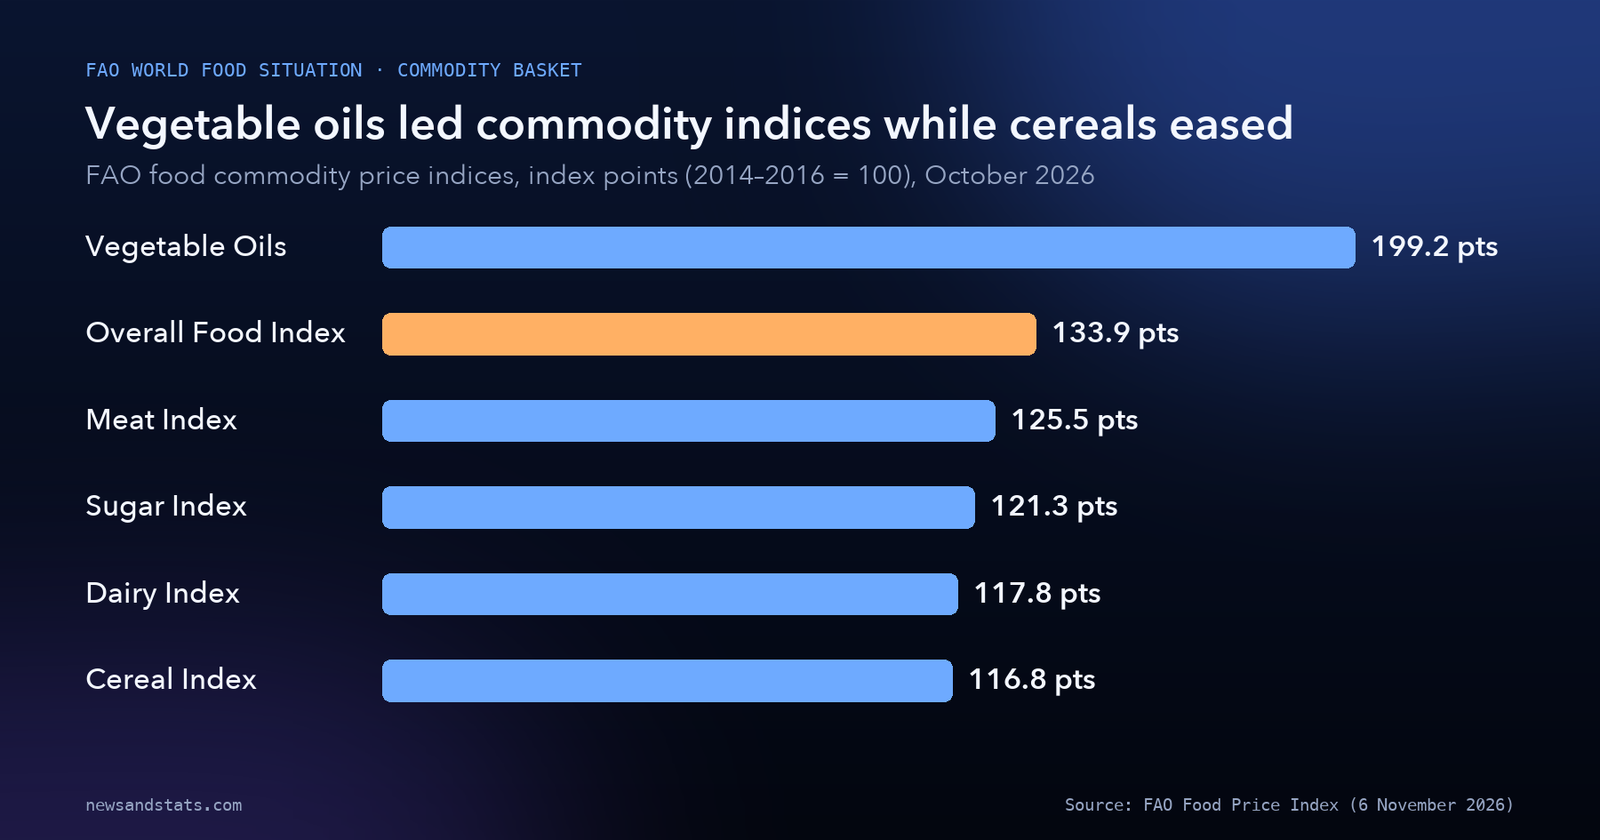
According to the official fao food price index released by the Food and Agriculture Organization of the United Nations on 6 November 2026 in Rome, the benchmark barometer of international food trade averaged 133.9 points in October 2026. This marked a decline of 1.6 points, or 1.2%, from its revised September level of 135.5 points (my calculation).
The modest headline decline, however, masks deep divergence across agricultural sectors. While bumper grain harvests and sluggish global demand pushed cereal quotations down by 4.5% month-on-month, the international sugar market experienced an aggressive rally, jumping 6.6% in a single month to reach its highest level since December 2024. Simultaneously, vegetable oils held near multi-year highs at 199.2 points, driven by relentless demand from the global biofuel sector.
Compared to a year earlier, the FAO Food Price Index stands 7.5 points, or 5.9%, higher than in October 2025. Yet it remains 26.3 points, or 16.4%, below the historic peak of 160.2 points recorded in March 2022 (my calculation) following the outbreak of the war in Ukraine. For developing nations and food-importing economies, the current market dynamic presents a complex picture: staple grain costs have softened, but essential cooking oils, dairy protein, and sugar continue to exert severe pressure on household budgets.
1. The 133.9 benchmark: easing from summer highs
The FAO Food Price Index tracks monthly changes in the international prices of a globally traded basket of food commodities, weighted by the average export shares of five major commodity groups over the 2014–2016 base period.
In October 2026, downward movements in cereals, meat, and dairy outweighed gains in vegetable oils and sugar:
- Overall Food Price Index (FFPI): Averaged 133.9 points, down 1.6 points (-1.2%) from September.
- Year-on-year change: Up 7.5 points (+5.9%) from October 2025’s implied level of 126.4 points (my calculation).
- Post-crisis historical context: Down 26.3 points (-16.4%) from the all-time peak of 160.2 points set in March 2022.
Source: FAO, Food Price Index, Commodity group index breakdown.
As documented in our broader coverage of the surge in global commodity prices, raw food prices are uniquely vulnerable to weather shocks, energy input costs, and maritime logistics friction. The October retreat provides breathing room for central banks attempting to anchor inflation expectations, but the structural floor under food commodities remains significantly elevated compared to pre-2020 averages.
Subtracting the Cereal Index (116.8 points) from the Vegetable Oil Index (199.2 points) reveals an enormous 82.4-point spread (my calculation) between basic grains and processed fats, illustrating how divergent supply shocks can distort consumer grocery baskets.
2. Grains retreat: the 4.5% tumble in the Cereal Price Index
Cereals represent the foundational staple of human caloric intake, and their pricing trajectory is the primary determinant of global food security. In October 2026, the FAO Cereal Price Index dropped sharply.
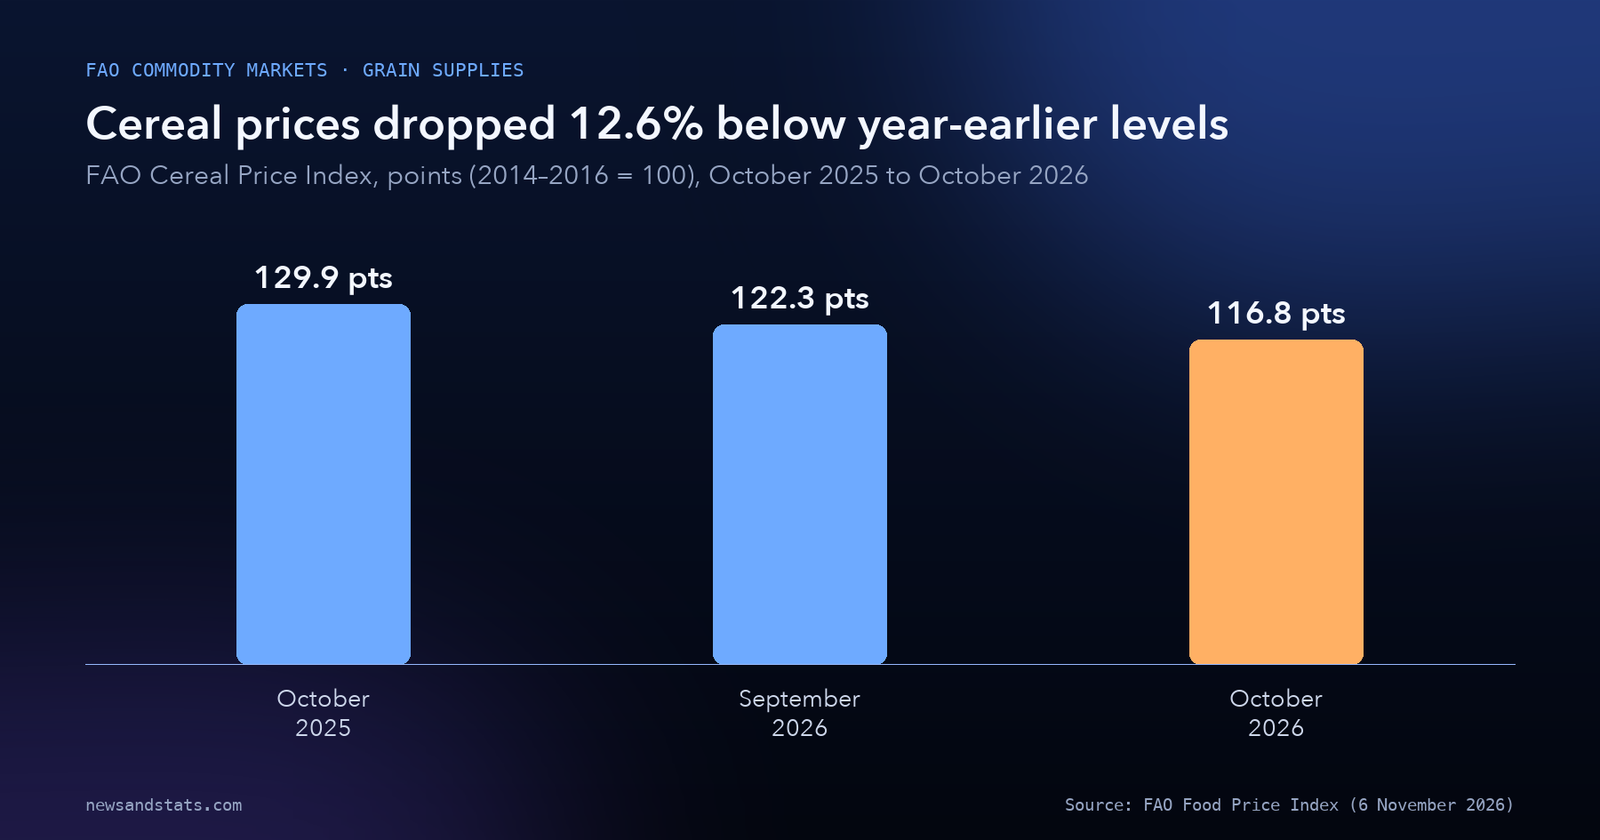
The Cereal Price Index averaged 116.8 points in October 2026:
- Month-on-month contraction: Down 5.5 points (-4.5%) from September’s level of 122.3 points (my calculation).
- Year-on-year contraction: Down 13.1 points (-12.6%) compared to October 2025’s level of 129.9 points (my calculation).
Source: FAO, Food Price Index, Cereal Price Index series.
The decline in grain prices was driven by several favorable harvest developments across major exporting regions:
- Wheat harvest outlook: World wheat quotations fell in October, ending four consecutive monthly increases. The retreat was supported by an improving production outlook in Argentina, where late-season rainfall bolstered yield expectations, and subdued international import demand.
- Black Sea export corridors: Market expectations of easing constraints on Black Sea shipping corridors placed downward pressure on quotations, although continuing logistical friction prevented a more pronounced price collapse.
- Maize market correction: International maize prices eased following a three-year high recorded in September. Rapid seasonal harvest progress in the United States, combined with expectations of ample exportable supplies across South American producers, alleviated supply tightness.
- Coarse grains: Barley and sorghum prices declined in tandem with wheat and maize, with favorable crop conditions in Australia driving down international feed barley benchmarks.
However, the rice market diverged from this downward trend. The FAO All Rice Price Index increased by 1.6% in October 2026. Adverse weather conditions, localized harvest delays among Southeast Asian exporters, and rising inland freight costs generated upward pricing pressure on staple white and parboiled varieties.
As explored in our analysis of global maritime trade and chokepoint rerouting, bulk grain carriers navigating extended oceanic routes face elevated bunker fuel and insurance premiums, ensuring that landed grain costs in importing nations remain higher than FOB port quotations suggest.
3. Vegetable oils at 199.2 points: biofuel demand fuels multi-year highs
While grain prices tumbled, the market for vegetable fats remained intensely stressed. The FAO Vegetable Oil Price Index averaged 199.2 points in October 2026, edging up by 0.6 points, or 0.3%, from September’s level of 198.6 points (my calculation).
Standing just below the 200-point threshold, the Vegetable Oil Index is the highest-priced commodity group in the FAO basket, reflecting tight physical availability and structural competition from renewable diesel refiners:
- World soybean oil: Quotations rose to their highest levels since late 2022, propelled by robust mandate-driven demand from the international biofuel sector and seasonally declining export supplies from South America.
- Sunflower oil: Rebounded from multi-month lows, underpinned by tight export availabilities from the Black Sea region amid ongoing infrastructure and maritime transport disruptions.
- Palm oil: International quotations remained virtually unchanged month-on-month but stayed well above their October 2025 levels, supported by steady import demand in India and China, competitive pricing relative to liquid oils, and projections of lower seasonal output across Indonesia and Malaysia for the 2026/27 cycle.
- Rapeseed oil: Declined counter-cyclically due to expanding autumn harvest supplies in Canada and lower-than-expected demand from European Union biodiesel producers.
As examined in our investigation into who pays for the 2026 energy shock, elevated crude oil and diesel prices directly incentivize governments and fuel blenders to increase mandated biofuel quotas. This dynamic binds agricultural markets directly to energy benchmarks: when refined diesel hovers near historic highs, vegetable oil is diverted into fuel tanks rather than food processing, creating an artificial price floor under cooking oils.
4. Sugar’s 6.6% surge: rain disruptions in Brazil and Asian supply risks
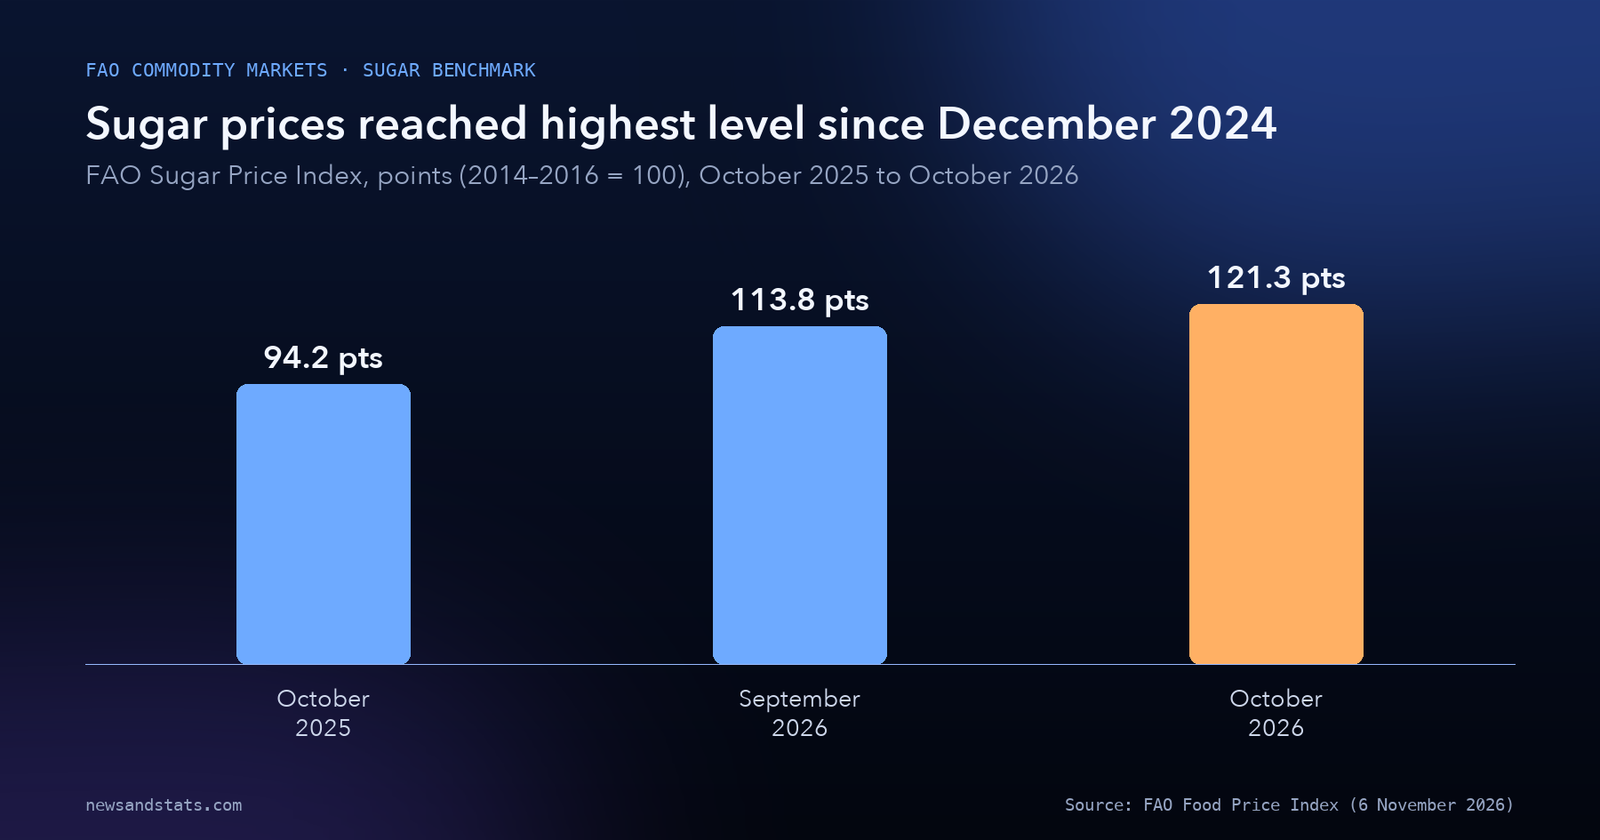
The most volatile component of the October FAO report was international sugar. The FAO Sugar Price Index surged by 7.5 points, or 6.6%, to average 121.3 points in October 2026, rising from September’s level of 113.8 points (my calculation).
October marked the fourth consecutive monthly increase for international sugar, propelling the index to its highest level since December 2024. Compared to October 2025, when the index stood at 94.2 points (my calculation), sugar prices have expanded by 27.1 points, or 28.8%.
Source: FAO, Food Price Index, Sugar Price Index series.
Subtracting the 4.5% cereal decline from the 6.6% sugar increase reveals an 11.1-percentage-point divergence (my calculation) between staple grains and sweet commodities.
The primary operational drivers behind the sugar price spike include:
- Brazilian crushing bottlenecks: Excessive rainfall across Brazil’s key Centre-South producing region disrupted sugarcane harvesting and mill crushing operations throughout October, delaying export shipments from the Port of Santos.
- Indian monsoon deficits: Concerns over production prospects in India deepened following below-normal and unevenly distributed monsoon rainfall across primary cane belts in Maharashtra and Karnataka, prompting expectations of continued export curbs.
- European and Thai downgrades: Crop forecasts for the 2026/27 season in Thailand and the European Union were revised downward due to localized pest pressures and adverse late-summer weather.
| Commodity group index | October 2026 index level | September 2026 index level | Month-on-month change | October 2025 index level | Year-on-year change |
|---|---|---|---|---|---|
| Vegetable Oil Price Index | 199.2 points | 198.6 points | +0.6 points (+0.3%) | Elevated | Substantially higher |
| Total Food Price Index (FFPI) | 133.9 points | 135.5 points | -1.6 points (-1.2%) | 126.4 points | +7.5 points (+5.9%) |
| Meat Price Index | 125.5 points | 127.1 points | -1.6 points (-1.2%) | Slightly lower | Slightly higher |
| Sugar Price Index | 121.3 points | 113.8 points | +7.5 points (+6.6%) | 94.2 points | +27.1 points (+28.8%) |
| Dairy Price Index | 117.8 points | 119.1 points | -1.3 points (-1.1%) | 141.8 points | -24.0 points (-16.9%) |
| Cereal Price Index | 116.8 points | 122.3 points | -5.5 points (-4.5%) | 129.9 points | -13.1 points (-12.6%) |
Source: FAO, Food Price Index, Table: Food commodity group price index overview (base 2014–2016 = 100).
5. Livestock and dairy divergence: butter and cheese retreat while powders surge
Livestock and dairy markets exhibited localized pricing divergence, characterized by expanding export supplies in Oceania and North America offsetting trade restrictions elsewhere.
Meat Price Index: down 1.2% to 125.5 points
The FAO Meat Price Index averaged 125.5 points in October, down 1.6 points, or 1.2%, from September’s level of 127.1 points, while remaining slightly above year-earlier levels:
- Pig meat: Quotations fell, led by the European Union, where ample domestic supply and subdued international import demand depressed processing margins.
- Ovine meat: Australian export supplies expanded seasonally, pushing prices down from recent record highs, though export availability remained structurally tight globally.
- Bovine meat: Eased slightly due to lower Australian cattle prices, while Brazilian beef held steady as strong import demand from the United States offset sluggish buying from China.
- Poultry meat: Remained broadly stable worldwide. In Brazil, international trade was preserved despite Newcastle disease outbreaks detected in the state of Santa Catarina on 18 October 2026, as trading partners honored regionalization agreements that confined trade curbs to the affected municipality.
Dairy Price Index: down 1.1% to 117.8 points
The FAO Dairy Price Index averaged 117.8 points in October 2026, dropping 1.3 points, or 1.1%, from September’s level of 119.1 points. While the overall index is 16.9% below its October 2025 level, its underlying sub-components experienced violent structural realignment:
- Skim milk powder (SMP): Surged to trade 45.8% higher than in October 2025. In the United States and Europe, robust demand for milk protein concentrates and nonfat dry milk tightened export availability despite steady total milk collection.
- Butter: Tumbled 31.1% lower than in October 2025, weighed down by elevated cold storage inventories in the European Union and aggressive export discounting from the United States.
- Cheese: Contracted 29.3% lower than in October 2025, as European production expanded faster than retail demand.
- Whole milk powder (WMP): Remained broadly stable, with firm prices in Oceania balancing modest declines in European markets.
Subtracting the 31.1% butter drop from the 45.8% milk powder surge indicates a dramatic 76.9-percentage-point pricing spread (my calculation) between dairy fats and dairy proteins.
6. The food security divide: why lower world indices mask local crises
While international headline food indices eased in October, the pass-through of global price declines to vulnerable local populations remains severely compromised.
In its accompanying monitoring reports, the FAO notes that 41 countries and territories worldwide continue to require external food assistance, primarily due to localized conflicts, insecurity, and acute climate shocks. In Low-Income Food-Deficit Countries (LIFDCs), aggregate cereal production for 2026 is forecast at 126.5 million tonnes, approximately 2% above 2025 levels and the five-year average.
However, currency depreciation and high domestic distribution costs prevent global price declines from reaching local retail markets:
- Foreign exchange depreciation: In nations categorized as low-income countries facing debt distress, domestic currencies have depreciated by 20% to 50% against the US dollar over the past two years. Because international commodities are priced in dollars, a 4.5% decline in world grain benchmarks is completely wiped out by local currency depreciation.
- Inland freight and energy costs: Diesel prices remaining near $180/bbl dramatically inflate the cost of moving imported grain from coastal container terminals to landlocked urban markets.
- Fertilizer cost lag: As explored in our reporting on clean energy innovation and fertilizer decarbonization, ammonia and nitrogen fertilizer prices spiked in tandem with natural gas during earlier energy shocks. Smallholder farmers who purchased agricultural inputs at peak prices face compressed margins as crop gate prices ease.
The net outcome is a widening divide between international wholesale indices and domestic food affordability. While wealthy economies benefit from disinflation across grain aisles, vulnerable communities absorb high baseline food expenditure shares.
What to watch
- The November 19 FAO Food Outlook: Monitor the forthcoming triannual flagship publication on global food markets for comprehensive 2026/27 supply-and-demand balances.
- Brazilian sugarcane crushing in November: Track whether rainfall tapers in the Centre-South region, allowing mills to resume normal processing before the seasonal inter-harvest closure.
- India’s sugar export quota announcement: Follow whether the Indian Ministry of Consumer Affairs maintains its restriction on sugar exports for the 2026/27 sugar season.
- Black Sea grain corridor continuity: Observe whether maritime export flows from Ukrainian and Russian ports maintain their current volume or face renewed shipping insurance friction.
- Winter wheat planting in the Northern Hemisphere: Watch soil moisture conditions across the US Southern Plains and Western Europe as farmers conclude autumn sowing.
The bottom line
The FAO Food Price Index dipped by 1.2% in October 2026 to 133.9 points, driven by a 4.5% drop in grain prices as Argentine harvests improved and US maize collection advanced. However, this downward movement was counterbalanced by an aggressive 6.6% surge in sugar to 121.3 points and persistent multi-year highs in vegetable oils at 199.2 points. While world food prices stand 16.4% below their March 2022 peak, elevated cooking oil costs, dairy protein shortages, and currency depreciation continue to challenge food security across 41 import-dependent nations. For ongoing coverage of macroeconomic trends and agricultural trade, explore our World in Numbers analysis.
Related reading
- Global Commodity Prices in 8 Numbers: The World Bank’s 23% Surge and Energy Shock Spillover: industrial minerals, energy feedstocks, and agricultural market interactions.
- Who pays for the 2026 energy shock? The numbers, country by country: energy market turbulence and the economic mechanics of food and fuel inflation.
- 68 Low-Income Countries, Ranked by Debt Risk: 10 Are Already in Distress: fiscal constraints, balance of payments stress, and import capacity in developing nations.
- Global Maritime Trade in 8 Numbers: How Chokepoint Rerouting Reshapes Shipping: agricultural bulk cargo routes, freight rate surges, and maritime logistics.
- Clean Energy Innovation in 8 Numbers: The Patent Race, Battery Dominance, and the $55 Billion Squeeze: chemical fertilizers, clean tech funding, and the energy transition.